Abstract
Injera, a fermented staple food traditionally made from Teff flour, is a key part of the Ethiopian diet, with nearly all Ethiopians eating it at least once daily. Compositing various grain-based, and oilseed flours with Teff flour improves the nutritional content, and cost-effectiveness of the produced Injera. In Ethiopia, very limited studies were conducted to investigate the use of sorghum, rice, and teff flour blends combined with flaxseed flour in Injera preparation. Thus, this study was conducted to evaluate the anti-nutritional factors, microbiological characteristics, and ideal blending proportions of sorghum, rice, teff, and flaxseed flours to create a superior quality Injera via D-optimal design. One-way and two-way ANOVA, alongside Tukey’s pairwise comparison method, was employed to assess mean differences. The aim was to enhance the nutritional quality of Injera compared to a control sample made from 100% sorghum flour. The optimal nutritional profile was achieved with a blend comprising 50% sorghum, 20% rice, 30% teff, and supplemented with 3% flaxseed flour. This blend resulted in Injera containing 3.02% fiber, 9.30% protein, 83.16% carbohydrate, 393.24 kcal/100 g energy, 13.99 mg/100 g iron, 4.06 mg/100 g calcium, and 3.78 mg/100 g zinc. The optimization process identified this blend as optimal for improving the nutritional quality of Injera. The findings underscore that blending teff with sorghum, rice, and flaxseed flour enhances the nutritive value of Injera.
Introduction
Injera is a traditional flatbread that serves as a dietary staple in Ethiopia and surrounding regions1. It is known for its unique spongy texture and slightly tangy taste2. This flatbread is typically made from teff flour, which comes from a highly nutritious grain3. Teff is valued for its high protein content, dietary fiber, and essential minerals like iron and calcium4. The grain Teff (Eragrostis tef (Zucc.) Trotter) has a nutritional composition of approximately 11% protein, 73% carbohydrates, 3% crude fiber, 2.5% fat, and 2.8% ash3. Teff flour is also utilized in food products, including breads, cookies, and baby foods. This is due to its whole grain usage, gluten-free properties, high iron content, and the digestibility of its proteins and starches3,5.
Currently, Teff is the priciest cereal cultivated in Ethiopia, largely because Injera made from Teff is a popular and culturally significant dish, often seen as a status symbol within the society (predominantly consumed in urban areas where household incomes are higher)3,6. Additionally, Teff and Injera are exported to countries like North America, the Middle East, and Europe due to their gluten-free nature and nutritional benefits6,7. Despite these advantages, there is growing interest in boosting the nutritional value of Injera while lowering its production costs by blending Teff with other flours, such as sorghum, rice, and flaxseed2,8,9. These alternatives are not only rich in essential nutrients but are also more widely available3.
Sorghum (Sorghum bicolor (L.) Moench.) is a vital cereal in some semiarid regions of the world, with around 40% of global production used for human consumption10. It was reported to have a proximate composition of 74.7% carbohydrates, 1.8% ash, 12.3% protein, 4.2% fat, and 1.7% fiber3,11. Sorghum is used as the second most preferred cereal for Injera preparation in Ethiopia. However, there has been minimal research on improving sorghum Injera quality12. Meanwhile, using Rice (Oryza sativa L.) flour in Injera production has gained popularity as a cost-effective alternative. Some modern recipes incorporate a mixture of teff and rice flour13,14. A common blend used in these recipes is around 50% teff flour and 50% rice flour15,16, Other ratio variations might be used, such as 70% teff flour to 30% rice flour, depending on availability and desired nutritional balance17,18. Injera made from a blend of cereals provides enhanced nutrition, offering higher levels of protein, iron, and calcium (notably with teff) while retaining good fiber content. Injera made entirely from sorghum is gluten-free and rich in antioxidants but has less accessible iron, lower calcium content, and incomplete protein. Nutritionally, rice is rich in beneficial phytochemicals, fiber, vitamins, minerals, and antioxidants, with lower amylose and higher amylopectin content contributing to better freeze-thaw stability19,20. Flaxseed (Linum Usitatissimum), known for its health benefits and nutritional value, enhances dough uniformity, and crumb elasticity, and prolongs the freshness of baked goods by improving water-binding capacity and reducing moisture loss21,22. Incorporating flaxseed into Injera enhances the omega-3 fatty acids, lignans, and dietary fiber, which can offer additional health benefits, including improved heart health and digestive support1,23,24. Compositing these grains flours with teff flour in various proportions has the potential to create a more nutritionally diverse product, improving the protein, fat, and fiber content of Injera18.
Composite flours enhance the nutrient profile, and overall appeal of Injera, and could significantly contribute to food security25. Yet, the use of composite flours raises concerns about anti-nutritional components like phytic acid, tannins, and phenols26. These substances can bind to minerals and reduce their absorption, thereby decreasing the bioavailability of essential nutrients27,28. Therefore, it is important to assess these anti-nutritional factors to ensure that the improved nutritional qualities of the composite Injera can be effectively absorbed and utilized by the body.
However, there is limited research on using blends of sorghum, rice, and teff flours without flaxseed flour in Injera preparation29. Given that sorghum and rice are more affordable in Ethiopia, there is a growing interest in mixing these ingredients with teff flour1,29. This research aims to encounter the rising demand for Teff together with the enhancement of the nutritional profile of Injera produced, by thoroughly investigating the nutritional, anti-nutritional, and microbiological aspects with optimal blending ratios of sorghum, rice, teff, and flaxseed flours to produce higher-quality Injera.
Materials and methods
Sample collection
The experimental materials included 15 kg of white sorghum (Melkam variety) obtained from the Gonder Agricultural Research Center, 14 kg of brown rice (X-Jigena variety) from the Fogera National Rice Research and Training Center, 8 kg of white Teff (Qoncho Teff variety, DZ-Cr-387) from Adet Agricultural Research Center, and 2 kg of flaxseed (Geregera variety). These specific varieties were chosen due to their widespread popularity, extensive production, and frequent use by Ethiopian farmers.
Sample preparation
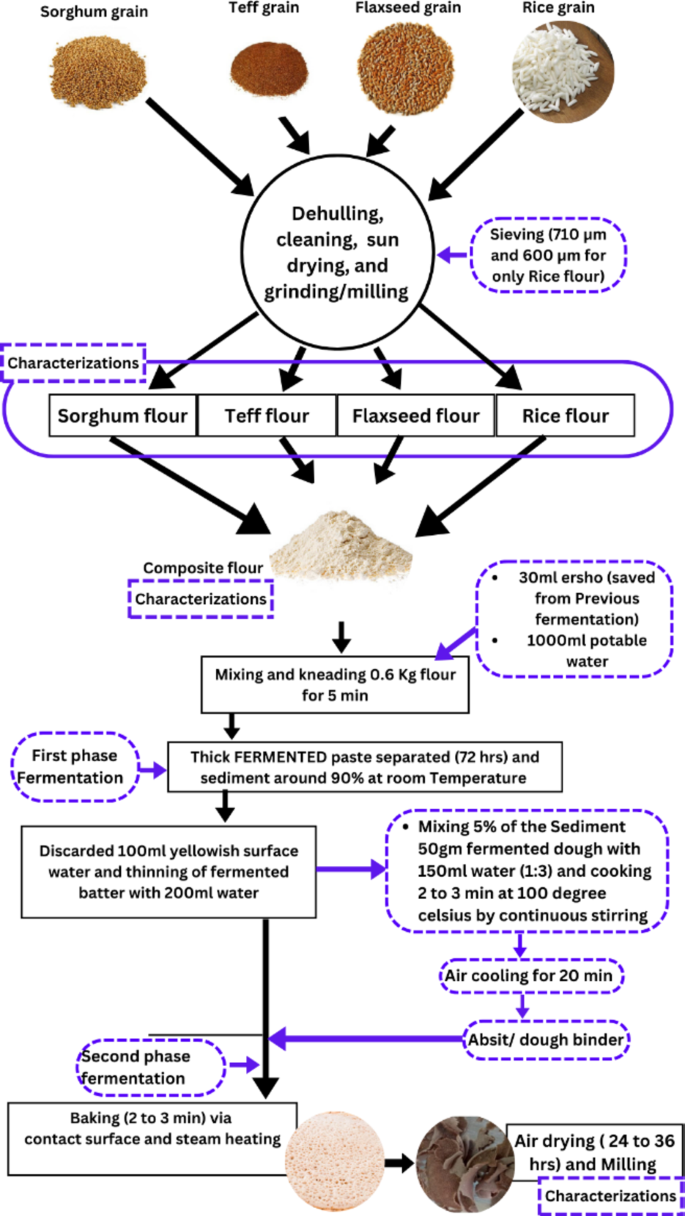
The samples collected were prepared by established methods of1,22,30,31,32. Each ingredient was processed according to the procedure outlined in Fig. 1. The sorghum, rice, teff, and flaxseed grains were cleaned manually through winnowing and handpicking. The sorghum, rice, and teff grains were milled into whole flour using a community cottage disk miller and then sieved using 710 μm and 600 μm sieves, respectively, based on their effectiveness13,30,32. Flaxseed was also ground using a high-speed multi-function oilseed and coffee mill. The prepared samples were stored in polyethylene plastic bags at a refrigeration temperature of 4 °C until further experimental analysis.

The experimental framework of the study design.
Treatment combinations and experimental design
The experiment utilized a D-optimal mixture design, incorporating three independent variable ingredients. The lower and upper treatment combination ranges were 43 to 50% for Sorghum flour, 20 to 27% Rice flour, and 23 to 30% Teff flour. Blending ratios for sorghum, rice, and teff flours were determined through preliminary trials and previous research11,18,22, and then calculated using Minitab software version 19.2. Each experimental treatment included a constant 3% flaxseed flour, except for treatments with 100% sorghum or teff flour.
Composite flour preparation
The composite flour was prepared according to the generated experimental design for injera preparation. The injera was prepared with 100% sorghum flour and 100% teff flour considered as the control12,33, and the composition is shown in Table 1.
Batter preparation, fermentation, and Injera preparation
The Injera was made using a specific composite flour blend of 0.6 kg (600 g) mixed with 1 L (1000 mL) of water to form a thick dough. Fermentation was initiated by adding 30 mL of Ersho, a starter culture saved from a preliminary test batter1,12. The dough was kneaded for 5 min to ensure uniformity, then sealed and fermented at room temperature for 72 h. Afterward, 100 mL of the surface liquid was removed, and 200 mL of potable water was added to thin the dough. To make Absit, 5% of the fermented dough was mixed with water (1:2 ratio), cooked at 100 °C for 3 min to gelatinize the starch, cooled, and reintroduced into the fermenting dough.
The second phase of fermentation lasted for 16 h, marked by bubble formation indicating that the fermentation was completed and the dough was ready for baking. Finally, 100 ml of potable water was added to the fermented dough to achieve the desired batter consistency30,32. About 500 g of fermented batter were poured in a circular motion onto a hot griddle called Metad (45–50 cm in diameter) and covered with a bamboo-based lid, Akambalo, to trap steam. Before pouring, the surface was rubbed with rapeseed flour using cloth. The Injera was baked at 190–210 °C for 2–3 min, then removed and stored in an airtight Mesob, a traditional woven container1,12,30,32,34,35. For determination (analysis) of proximate, mineral, and anti-nutritional properties the proportion of Injera was air-dried for 24–36 h at room temperature with the controlled conditions and converted into powder by FW100 high-speed universal disintegrator. After the analysis, the results were reported in dry base32,36.
Proximate composition of Injera
Moisture content
The moisture content of freshly baked Injera from composite flour was analyzed using the oven drying method (AOAC 2000, method 930.15). Pre-dried and weighed moisture dishes (W1) were filled with 5 g samples (W2) in triplicate and dried at 105 °C for 6 h until reaching a constant weight. After cooling in a desiccator, the final weight (W3) was recorded. Then, the moisture content was estimated by Eq. (1).
Crude protein
Protein content was measured using the Kjeldahl method, specifically the 920.87 protocol for analyzing crude protein in flour37. Approximately 0.5 g of the food sample was weighed and placed in a digestion flask. The sample was digested at 50 to 415 °C for 190 min with 5 mL of concentrated H2SO4 (as an oxidizing agent), anhydrous Na2SO4 (to raise the boiling point and speed up the reaction), and 1 gram of a catalyst mixture (Na2SO4 and CuSO4 in a 10:1 ratio). This process converted nitrogen (excluding nitrates and nitrites) into ammonium sulfate, while organic matter was broken down into CO2 and H2O. After digestion, the mixture was diluted with 50 mL of distilled water and 40 mL of 40% NaOH was added to release ammonia gas. The sample was distilled into a flask containing 25 mL of 4% boric acid until the volume reached 150 mL. The resulting borate ion was titrated with standard 0.1 N HCl to complete the analysis.
where T-Volume in mL of the standard acid solution used in the titration for the test material, B-Volume in mL of the standard acid solution used in the titration for the blank determination, N-Normality of standard sulfuric acid, and W-Weight in grams of the test material.
Conversion factor (5.7) for sorghum, rice, and teff cereals and (5.3) for flaxseed38.
Crude fat
Crude fat was analyzed using the Soxhlet extraction method (AOAC, 2000; method 920.39). A 5 g sample was placed in filter paper and extracted with hexane in a Soxhlet apparatus for 6–8 h. The extract was transferred to a pre-weighed evaporating beaker, rinsed with hexane, and evaporated until odorless. The beaker was dried at 120(:^circ:C) for 30 min, cooled in a desiccator, and re-weighed to determine the fat content. The Crude fat content was determined by Eq. (4).
where: W1 = Weight of extraction flask before extraction, and W2 = Weight of extraction flask after extraction.
Crude fiber
The crude fiber content was determined using a non-enzymatic gravimetric method as described by AOAC (2000). A 2 g sample of defatted food was placed in a 150 mL beaker with 60 mL of 1.25% H2SO4 and a pre-weighed 2 g boiled sample. The mixture was heated on a digestion apparatus, boiled for 45 min with periodic shaking, and then filtered through a screen sieve. The beaker was rinsed three times with 50 mL of near-boiling water, and the rinses were filtered. The residue was transferred to a digestion flask with 40 mL of 1.25% NaOH and boiled for 30 min, shaking every 5 min. The final residue was filtered using a 75 μm crucible under a 25 mm vacuum, dried at 130(:^circ:C) for 2 h, cooled in desiccators, and weighed (M1). The dried residue was ignited for 2 h at 600 ± 15 °C until ashing was completed and then cooled in desiccators and reweighed (M2). The crude fiber was determined with Eq. (5).
where M1 = mass of crucible and residue before ignition, and M2 = mass of crucible and residue after ignition.
Total ash
The ash content was performed by the official method 942.05 of AOAC (2000). The crucibles were thoroughly cleaned, dried at 120(:^circ:C), and pre-ignited at 550(:^circ:C) for 3 h. After cooling in desiccators, their mass was measured (M1) using an analytical balance. Approximately 5 g of the sample was weighed into the crucibles (M2) and heated in a furnace at 550(:^circ:C) for about 8 h until carbon was removed and the residue turned grayish-white. The sample was removed from the furnace placed in the desiccators and weighed (M3), the ash content was analyzed by Eq. 6.
Total carbohydrate
The total amount of carbohydrates in the samples was calculated by subtracting the parameters measured in the aforementioned test from 100%37.
where; % M (DB) is the percent of moisture content in dry base, %CP is the percent of crude protein, %A is the percent of ash, and %CF is the percent of crude fat.
Energy value/calorific value
The calorific value of food (in kcal/100 g) was determined by multiplying each gram of protein, fat, and carbohydrate obtained from laboratory analysis by their respective conversion factor.
The energy content of the food sample is determined by using multiplication factors of 4, 9, and 4 for every gram of protein, fat, and carbohydrate, respectively39,40.
Determination of anti-nutritional factors
Phytate
The phytate content was determined by the method outlined by41, with modifications by42. Approximately 0.1 g of dried Injera flour were extracted with 10 mL of 0.2% HCl at room temperature for one hour. After centrifugation at 3000 rpm for 30 min, the clear supernatant was used for phytate analysis. For the assay, 3 mL of the sample was mixed with 2 mL of Wade reagent (0.06% FeCl3·6H2O and 0.6% sulfosalicylic acid), and absorbance was measured at 500 nm using a UV-VIS spectrophotometer. Phytate concentration was calculated using a standard curve (4–32 ppm) and expressed as phytic acid in mg per 100 g of dry weight.
Where AB is the absorbance of the blank sample, AS is the absorbance of the sample, and 3 is the volume extracted from the sample (supernatant).
Condensed tannin
The method outlined by43 was employed for determining condensed tannins. A 0.30 g sample was placed in a screw-cap test tube with 8 mL of 1% HCl in methanol. The mixture was vortexed for 10 s and incubated in a water bath for 20 min, with a 10-second centrifugation halfway through. After incubation, the sample was vortexed again for 10 s, centrifuged at 1000 rpm for 15 min, and the supernatant was carefully decanted to avoid transferring solid residues. Two 1 mL aliquots were taken from the supernatant and placed into separate test tubes. One tube served as the sample, and the other as the blank. Both tubes were placed in a 30(:^circ:C) water bath for 20 min. During this period, 5 mL of vanillin reagent was added to the sample tube and 5 mL of 4% HCl in methanol was added to the blank tube at 15-second intervals. After 20 min, the absorbance of each sample and blank tube was measured at 500 nm, with the spectrophotometer zeroed using a methanol blank. 40 mg of D-Catechin was weighed and dissolved in 100mL of 1% HCl in methanol (stock) solution, then taken 0, 2.69, 5.38, 26.88, 53.76, and 107.52 ppm of stock solution was in a test tube. Adjust the volume of each tube to 1mL with 1% HCl in methanol.
Where V is the volume of extract in mL. A is Absorbance at 500 nm (absorbance of sample-absorbance of blank). m is the slope of the standard curve. W is the Weight of the sample.
Total phenolic content
Phenolic compounds concentration in the injera flour was extracted by methanolic extracts as described by44. For each sample, 5 g were homogenized with 10 mL of extraction solvent comprising 60% methanol and 0.1% HCl (acidic aqueous methanol by volume: H2O: HCl, 70:29.5:0.5) and heated in a water bath at 85(:^circ:C) for 2 h. After cooling, the mixture was transferred to a 100 mL volumetric flask and diluted to volume with distilled water. The extract was filtered under slight pressure using Whatman filter paper. A 5 mL aliquot of the extract was mixed with 15 mL distilled water, 5 mL Folin-Ciocalteu reagent, and 10 mL saturated sodium carbonate solution, then diluted to 100 mL with distilled water. The reaction was allowed to proceed for 30 min at room temperature, and absorbance was measured at 750 nm using a UV-Vis spectrophotometer. A standard curve was prepared using gallic acid solutions at 0, 0.05, 0.1, 0.15, and 0.2 ppm. The total content of phenolic compounds in sample extracts and gallic acid equivalent (GAE) was calculated by the formula:
where TP is the total phenolic content in mg/g, in GAE (Gallic acid equivalent), C is the concentration of gallic acid established from the calibration curve in mg/ml, V is the volume of sample extract in mL, and m is the weight of the sample in g.
Total flavonoid content
Total flavonoid content was determined by a colorimetric method as described by45. Total flavonoid content was measured by mixing 1 g of injera flour extract or 100 µL of supernatant with methanol and 2% AlCl3 solution. Absorbance was recorded at 415 nm after 10 min, using a blank without AlCl3 for calibration. Flavonoid levels were quantified using a quercetin standard curve (0–0.1 ppm) and expressed as mg quercetin equivalents (QE) per g of dry extract, based on the mean of three readings.
Where C is the concentration of quercetin equivalents (QE) per g of extract established from the calibration curve in mg/ml, V is the volume of solvent extract in mL, and W is the weight of the sample in g.
Mineral analysis
The mineral content of calcium, iron, zinc, magnesium, manganese, and potassium was analyzed using atomic absorption spectrophotometry (AAS) and flame photometry, following AOAC (2000) standards. A 2 g milled sample was digested in a 2:5 mixture of concentrated nitric acid (69%) and hydrochloric acid (37%) and then diluted to 50 mL with distilled water. Standard stock solutions for each mineral (iron, zinc, calcium, magnesium, manganese, and potassium) were prepared from 10 ppm stock solutions. The samples and standards were atomized using an air-acetylene flame, and absorbance was measured at specific wavelengths: 248.33 nm for iron, 213.8 nm for zinc, 422.67 nm for calcium, 285.21 nm for magnesium, 279.48 nm for manganese, and 766.49 nm for potassium. Then the solution was used to determine Fe, Zn, Ca, Mg, Mn, and K elements in the flour and formulated injera samples by Eq. 13.
Where W is the Weight (g) of the sample, V is the Volume of extract in mL, A is the Concentration (mg/l) of the sample solution, B is the concentration (mg/l) of the blank solution and D is the Dilution factor.
Total microbial load analysis
For microbiological stability analysis, freshly baked Injera samples were cooled for 1–2 h, then wrapped in clean polyethylene plastic and stored in a traditional Messob basket at room temperature (around 25(:^circ:C)) for 6 days. Samples were randomly collected on days 0, 2, 4, and 6 using sterile materials. The total aerobic bacteria and yeast-mold counts were determined using AACC (2000) methods, and results were reported as colony-forming units (CFU) per gram. Yeast mold and total bacteria were determined using the pour plate technique as described by22. To determine yeast and mold count, potato dextrose agar (PDA) was poured into plates, incubated aerobically at 25(:^circ:C) for 3–5 days, and colonies were counted (30–300 colonies per plate) as colony-forming units per gram of Injera (CFU/g). For total bacterial count, plate count agar (PCA) was used, and after incubating the plates aerobically at 35(:^circ:C) for 48 h, total aerobic bacteria were enumerated on plates with 30–300 colonies using a colony counter (CFU/g).
Statistical data analysis and optimal validation
All experimental measurements were conducted in triplicate, except for microbial load, which was done in duplicate. Data analysis was performed using Minitab version 19.2 with statistical methods including linear and quadratic regression models for mixtures, single-factor analysis, and two-way ANOVA. Tukey’s pairwise comparison was used to assess the significance of mean values at a 5% significance level (p < 0.05).
Results and discussions
Proximate composition of formulated Injera
Moisture content
The moisture content of the blended baked Injera ranged from 60.03 to 64.31%. In contrast, the moisture content of the control Injera, made solely from sorghum and teff flour, was 59.46% and 63.05%, respectively. This suggests that the blending ratio affects the moisture variation and softness of Injera under controlled baking conditions. As reported by46, injera made from various cereals has a moisture content exceeding 50%. Additionally35, , and47 indicated that the moisture content of blended injera products can reach 62–65%.
The lowest moisture content (60.03%) was found in the injera with BR2 (50% sorghum, 20% rice, and 30% teff), while the highest moisture content (64.31%) was observed in the injera with BR3 (46.5% sorghum, 23.5% rice, and 30% teff). As detailed in Table 2, the moisture content of the formulated injera decreased with higher sorghum flour composition and significantly increased with more teff and rice. Despite the initial moisture content of sorghum and teff flour being not significantly different (p < 0.05), sorghum injera experienced greater moisture loss during storage compared to teff injera12. This study consistently substituted 3% of flaxseed flour for each blended ratio48.
According to 23,49, flaxseed flour supplementation in cereal products positively affects moisture retention during storage after baking due to its water-binding potential. The interaction between the ingredients in the formulated injera showed a significant difference (p < 0.05) and high significance (p < 0.05) between the quadratic model interactions of sorghum with rice, sorghum with teff, and rice with teff (R² = 0.9476) (Table 2). The predicted moisture content of the formulated injera is estimated by Eq. 14.
Total ash content
In this study, ash content values were recorded in the range of 1.82–2.40% in the blend injera. Whereas sorghum and teff flour injera ash values are 1.70% and 2.31% respectively. The formulated blended injera BR4, which consists of 46.5% sorghum, 27% rice, and 26.5% teff, along with a 3% flaxseed flour supplement, showed the lowest total ash content at 1.82%. In contrast, the highest total ash content of 2.40% was found in the blended injera sample BR5, made up of 43% sorghum, 27% rice, 30% teff, and a 3% flaxseed flour substitution. As the composition of rice and sorghum flour increased the ash content also decreased but the teff flour composition increased the ash composition linearly increased (Eq. 15). The analyzed result showed that the ash content of injera optimization was significantly affected (p < 0.05) through the blending of different cereal components (Table 3). According to11,30,50 reports injera prepared from blended flours with higher teff flour compositions shows a higher ash content due to its high amount of minerals and ash in teff flour from other cereals. The predicted linear and quadratic models between sorghum, rice, and teff were significantly different among sorghum control injera (R2 = 0.9587).
Crude fat content
The crude fat levels of injera formulated with a 3% flaxseed flour supplement ranged from 2.50 to 3.20%. In contrast, the crude fat content of 100% sorghum and teff flour injera (used as controls) were 2.02% and 1.98%, respectively. There was a highly significant difference (p < 0.05) in the crude fat percentages observed in the interaction of sorghum with rice, sorghum with teff, and rice with teff, as shown by the linear and quadratic models (R² = 0.9733) (Table 2).
The lowest fat content (2.5%) was found in BR4 injera, made from a blend of 46.5% sorghum, 27% rice, and 26.5% teff. Conversely, the highest crude fat content (3.20%) was observed in BR2 injera, consisting of 50% sorghum, 20% rice, and 30% teff. The presence of sorghum in these blends increased the crude fat content of the injera. This increase is attributed to the relatively high fat content found in sorghum flour (2.10–7.60%,51), and rice flour (1.6-2.8 mg/100g52,53), .
Crude fiber content
The crude fiber content of formulated injera ranged from 2.40 to 4.50%, as shown in Table 3. The highest crude fiber content (4.50%) was observed in injera made from blending ratios BR4 (46.5% sorghum, 27% rice, 26.5% teff) and BR5 (43% sorghum, 27% rice, 30% teff). Conversely, the lowest crude fiber content (2.40%) was found in injera from blending ratios BR2 (50% sorghum, 20% rice, 30% teff), BR3 (46.5% sorghum, 23.5% rice, 30% teff), and BR10 (50% sorghum, 23.5% rice, 26.5% teff). Injera made with 100% sorghum flour (control) had a crude fiber content of 3.69%, which was higher than that of injera made with 100% teff flour (control), which had a content of 2.83%. There was a significant difference (p < 0.05) in crude fiber content between sorghum and teff flours. The crude fiber content in the blended injera samples was significantly influenced by the addition of brown rice flour, followed by sorghum flour, as the amount of flaxseed flour remained constant in each blend (Fig. 2). Although teff grain is known for its high bran and fiber content30, brown rice and sorghum flours also have high fiber content, as reported by54. The crude fiber content of composite flour injera samples varied from 0.8 to 1.0% and 3.91–5.2%, respectively18,55.

Contour plot of crude fiber (A) & crude protein interaction (B) response.
The crude fiber content of injera, based on the formulated blending ratio, exhibited a highly significant difference in both the linear and quadratic models when sorghum was combined with rice flour and teff flour. The model showed a significant difference (p < 0.05). The coefficient of determination for the formulated model was exceptionally high (R² = 0.9938).
Crude protein content
The crude protein content of the formulated injera ranged from 9.00 to 9.31%, while the sorghum and teff control injera products contained 8.91% and 8.14% crude protein, respectively (Table 3). The protein content of all formulated injera products showed a highly significant difference (p < 0.05) in both linear and quadratic models when sorghum was combined with teff flour and rice with teff flour. Significant variation was also observed in the interaction between sorghum and rice. The highest relative protein content (9.31%) was found in injera prepared with the BR2 blend (50% sorghum, 20% rice, 30% teff), while the lowest relative protein content (9.00%) was found in the BR6 (47.67% sorghum, 24.67% rice, 27.66% teff) and BR9 (48.83% sorghum, 25.83% rice, 25.34% teff) blends.
The increase in protein content of the formulated injera was attributed to the higher percentages of sorghum and teff, despite the constant supplementation of flaxseed, which has a high protein content. However, the contour plot and model predictions indicated that the protein content of the formulated injera was more influenced by teff flour, followed by rice flour (Fig. 2 and Eq. 18). The observed increase in protein content may be due to the improved or optimized protein content from blending and composite flours18,22 and could be linked to enzyme synthesis or changes in compositional proportions followed by the degradation of components56. Despite the constant addition of flaxseed, its protein content remained highly significant. Previous studies reported mean composite flour injera protein content in the range of 7.47–14.74%, which aligns with findings of13,18,50,57. The coefficient of determination for the interaction model was R² = 0.9707.
Total carbohydrate content
The carbohydrate content of formulated injera ranged from 81.39 to 83.67%, with sorghum and teff flour injera control values being 83.68% and 84.74%, respectively. The highest carbohydrate content (83.67%) was found in injera BR2 (50% sorghum, 20% rice, 30% teff), while the lowest (81.39%) was in BR5 (43% sorghum, 27% rice, 30% teff) (Table 3). There was a significant difference (p < 0.05) in the linear and quadratic models of carbohydrate interaction, such as between sorghum and rice and sorghum and teff flour (Table 2). The carbohydrate content of the blended baked injera increased as the proportion of teff flour, followed by sorghum flour, and rose (Fig. 3 & Eq. 19). Studies by11,33 indicate that sorghum, rice, and teff flour are rich sources of carbohydrates. Injera made from different composite flours showed a mean total carbohydrate content ranging from 73.89 to 86.8%, aligning with the findings of57,58.
The interaction significance model coefficient determination value (R2 = 0.9704%).

Mixture contour plot of carbohydrate (A) & gross energy interaction (B) response.
Gross energy value
The gross energy value of the formulated injera ranged from 388.40 to 398.26 kcal/100 g, with the control samples of 100% sorghum and teff flour injera showing energy values of 388.40 and 398.26 kcal/100 g, respectively (Table 3). The highest energy content was found in injera made from the BR2 blend (50% sorghum, 20% rice, 30% teff), while the lowest was in the BR5 blend (43% sorghum, 27% rice, 30% teff). There was a highly significant difference (p < 0.05) in the caloric content of the composite flour injera in both linear and quadratic models involving sorghum with rice, and rice with teff, whereas the difference between sorghum and teff was not significant (Table 2). Flaxseed flour did not significantly affect the gross energy of injera due to its low inclusion rate. These findings align with11,59, who reported that the gross energy of composite flour injera varied from 349.60 to 380.25 kcal/100 g. The increased energy value in the formulated injera is attributed to the high carbohydrate content in the sorghum, rice, and teff flour used in the study (Fig. 3).
Anti-nutritional factor analysis of composite flour injera
The phytate content in injera made from various composite flours ranged from 175.66 to 177.93 mg/100 g. Specifically, the phytate levels in 100% sorghum and teff flours were 178.26 mg/100 g and 176.14 mg/100 g, respectively. The highest phytate content (177.93 mg/100 g) was found in the BR7 blend (45.34% sorghum, 25.83% rice, 28.83% teff), while the lowest phytate content (175.66 mg/100 g) was observed in the BR9 blend (48.83% sorghum, 25.83% rice, 25.34% teff). Although teff flour had a lower phytate content compared to sorghum flour, an increase in the proportion of teff in the composite flour resulted in higher phytate concentrations in the injera. Table 4 illustrates the levels of anti-nutritional factors, total phenols, and total flavonoid content in injera samples.
The phytate content in injera made from blends aligns with the findings reported by11,51,60. The phytate content in injera made from teff flour specifically also corresponds with the results reported by11. The study showed no significant difference (p < 0.05) in the interaction between linear and quadratic models regarding the mixture of components, likely because all components in the mixture are rich sources of phytate. This anti-nutritional content chelates and binds minerals, reducing their bioavailability for nutritional absorption1,61, but also provides health benefits, such as anti-inflammatory and anti-cancer properties24,30. According to the model (Eq. 21) and the mixture contour plot (Fig. 4), the phytate content increases as the proportion of teff flour, followed by rice and sorghum, increases.

Contour plot of phytate (A) and total phenol component (B) response.
The amount of Total Phenol (TP) content ranged from 3.03 to 5.39 mg/100 g, and the phenol amount of individual sorghum and teff flours injera was 4.07 mg/100 g and 4.70 mg/100 g, respectively. The highest phenol content (5.39 mg/100 g) was determined in the blended injera prepared from BR2 (50% sorghum, 20% rice, 30% teff), whereas the lowest phenol content (3.03 mg/100 g) was present in BR5 (43% sorghum, 27% rice, 30% teff). The blended injera product total phenol result indicated that similar to the mixture contour plot and predicted model response composition of sorghum flour was increased the total phenol concentration in the blended injera also increased. According to62 studies the total phenol concentration of sorghum flour injera resulted in 3.69 mg/100 g and it was in agreement with the current study result. Different works of literature emphasized or reported that white sorghum flour observed low in total phenol content of injera has been agreed with reported by63,64, and another scientific justification reported studies blending, fermentation, and baking process parameters also reduce the anti-nutritional compounds and increased mineral bioavailability to the optimized nutritional quality of blended injera22,65. The result shows a significant difference (p < 0.05) in the linear and quadratic model mixture interaction of sorghum with rice and sorghum with teff (Table 5).
The phytate content in injera made from blends aligns with the findings reported by11,43,51. The phytate content in injera made from teff flour specifically also corresponds with the results reported by11. The study showed no significant difference (p < 0.05) in the interaction between linear and quadratic models regarding the mixture of components, likely because all components in the mixture are rich sources of phytate. This anti-nutritional content chelates and binds minerals, reducing their bioavailability for nutritional absorption1,61, but also provides health benefits, such as anti-inflammatory and anti-cancer properties30,65. According to the model (Eq. 22) and the mixture contour plot (Fig. 5), the phytate content increases as the proportion of teff flour, followed by rice and sorghum, increases.
The condensed tannin (CT) content in injera made from different composite flour ratios ranged from 0.00 to 0.17 mg/100 g. The control injeras made from sorghum and teff flour showed CT contents of 0.04 mg/100 g and 0.00 mg/100 g, respectively. A significant mean difference (p > 0.05) was observed between each blending ratio and the controls in terms of condensed tannin content, as shown in Table 4. Among the ten blended injera products, the highest condensed tannin content (0.17 mg/100 g) was found in BR8, which consisted of 48.83% sorghum, 22.34% rice, and 28.83% teff. This variation in CT content may be attributed to differences in fermentation composition66. These findings align with previous studies11,63,67,68, which have shown that white sorghum and teff flour have very low or no tannin content, respectively. The following contour plot (Fig. 5) and model (Eq. 23) also demonstrate that as the amount of brown rice increases, the concentration of condensed tannin increases, whereas an increase in the composition of white sorghum and teff flour leads to a decrease in condensed tannin concentration.

Contour plot of condensed tannin (A) and flavanoid content (B) response.
The total flavonoid (TF) content in the blended injera ranged from 298.5 to 388.2 mg/100 g. For comparison, the TF content in injera made from sorghum and teff flours alone was 289.9 mg/100 g and 304.9 mg/100 g, respectively. The highest TF content (388.2 mg/100 g) was observed in the BR6 blend (47.67% sorghum, 24.67% rice, 27.66% teff), while the lowest TF content (289.9 mg/100 g) was found in the BR5 blend (43% sorghum, 27% rice, 30% teff). These findings suggest that the flavonoid content originates from the outer layer and, aligns with previous research on the flavonoid content of grains like sorghum, rice, teff, and flaxseed63,64,69,70,71. Flavonoids are present in small amounts in sorghum, teff, rice, and flaxseed flours. Even though, the result indicates that in the mixture contour plot when sorghum and rice flour composition were increased the total flavonoid content also decreased in the blended injera foods but relatively increased by teff flour composition increased. According to researchers22, and65 report fermentation and baking process reduced these anti-nutritional compounds and increased mineral bioavailability to the optimized nutritional quality of blended injera. There was a non-significant difference (p < 0.05) in the linear and quadratic model interaction on the mixture of components (Table 5).
Mineral content analysis of composite flour injera
In this study, the contents of iron, zinc, calcium, magnesium, manganese, and potassium in the blended injera were analyzed. The iron content in the formulated blended injera varied between 12.13 and 16.17 mg per 100 g. In comparison, injera made from 100% sorghum flour had 11.1 mg of iron per 100 g, while injera made from 100% teff flour contained 24.50 mg per 100 g. The iron content of the 100% sorghum flour injera (used as a control) and the blended injera did not show a significant difference (p < 0.05). However, the component interaction in the blended injera improved the iron content from 11.1 mg/100 g to a range of 12.13–16.17 mg/100 g. The highest iron content (16.17 mg/100 g) was found in the blend BR5 (43% sorghum, 27% rice, and 30% teff), while the lowest iron content (12.13 mg/100 g) was found in the blend BR1 (50% sorghum, 27% rice, and 23% teff).
The iron mineral content in teff flour significantly influences the iron content of injera. Pure teff flour injera serves as a control with an iron content of 24.50 mg/100 g, indicating that teff flour is richer in iron compared to injera made from other cereal blends36,50. Specifically, injera made from 100% teff flour has a significantly higher iron content (25.13 mg/100 g to 34.50 mg/100 g, p < 0.05) than injera made from other cereal flour blends, due to the naturally high iron content of teff grain50,72. Moreover, the iron content of blended injera is improved compared to injera made from 100% sorghum flour, which contains only 11.10 mg/100 g of iron.
In this study, the predicted (Equation model 25) and the mixture contour plot Fig. 6 shows that the iron content of composite flour blending injera optimization is influenced by sorghum flour > teff flour > rice flour. According to18, and72 reports the total iron contents of composite flour (teff, rice, maize, fenugreek) injera vary from (12.25–34.22 mg/100 g). The iron content in formulated injera showed high significance differently (p < 0.05) both in linear and quadratic models’ interaction of sorghum*teff flour and rice*teff flour but the non-significant difference (p < 0.05) in sorghum*rice flour interaction (Table 6). Because it might be the iron content of sorghum and rice flour is non significantly different and not rich availability of iron content (Table 7).

Contour plot of iron (A) and calcium content component (B) response.
The Calcium content of formulated injera was found in a range of 1.07–4.06 mg/100 g, 100% sorghum flour injera (1.07 mg/100 g), and 100% teff flour (3.14 mg/100 g), respectively. The highest calcium content (4.06 mg/100 g) was found in BR1(50% sorghum, 27% rice, and 23% teff) whereas, the lowest calcium content (1.07 mg/100 g) was found in BR7 (45.34% sorghum, 25.83% rice, and 28.83% teff) within constant 3% supplement of flaxseed flour for each blended injera products. The calcium content of formulated injera varied and lower from previous studies, it might be due to variations in composition amount, composition type, and any factors that contributed to calcium content.
On the other hand, the lower amount of calcium might be due to divalent cations, such as Ca, binding with anti-nutritional factors, which could explain the reduced availability of these minerals. Various researchers have reported that the calcium content in composite flour injera ranges from 17.97 to 187.25 mg/100g11,32,72,73. In this study, the mean value of blended injera products did not show a significant difference, but the calcium content was optimized. As the amount of rice increased, followed by teff and sorghum flour, the calcium content also increased. This suggests that the contribution of flaxseed flour to calcium content remained constant across all blended experimental trials (Fig. 6). The calcium content was found to be significantly different (p < 0.05) in the linear and quadratic model interactions of sorghum-rice flour and rice-teff flour. However, there was no significant difference (p > 0.05) in the interaction between sorghum and teff (Table 6).
The zinc contents of the formulated injera were found in a range of 2.16–3.94 mg/100 g, 100% sorghum flour injera (2.16 mg/100 g), and 100% teff flour injera (3.49 mg/100 g) respectively. The injera made from BR1 (containing 50% sorghum, 27% rice, and 23% teff) had the highest zinc content at 3.94 mg per 100 g, while BR4 (comprising 46.5% sorghum, 27% rice, and 26.5% teff) contained the lowest at 2.16 mg per 100 g. The result showed that Zn concentration was also optimized or increased by blending different grains (Table 6). According to13,59,72 studied composite flour injera made from different cereals at different composition levels zinc content varied from (1.44 to 4.35 mg/100 g), and the present study result agreement with the researchers.

Contour plot of zinc (A) and magnesium content (B) interaction response.
The mixture contour plot (Fig. 7) and prediction model Eq. 27 shows that sorghum and teff flour composition increases its Zn content also but as rice composition increases Zn content value decreases.
The magnesium content of formulated injera ranged from 5.47 to 6.73 mg/100 g. Specifically, 100% sorghum flour injera contained 5.31 mg/100 g, while 100% teff flour injera, used as a control, had 6.81 mg/100 g, as shown in Table 7. The highest magnesium content (6.73 mg/100 g) was found in the BR1 formulation (50% sorghum, 27% rice, and 23% teff), whereas the lowest (5.47 mg/100 g) was in the BR8 formulation (48.83% sorghum, 22.34% rice, and 28.83% teff). According to73, composite flour injera made from teff and other functional food ingredients had magnesium content ranging from 6.4 to 14.05 mg/100 g, which aligns with the results of the present study. The magnesium content showed no significant difference (p < 0.05) in the interaction of rice and teff flour in both linear and quadratic models, but there was a significant difference (p < 0.05) in the interaction of sorghum and rice flour, and sorghum and teff flour in the quadratic model (Table 7). The interaction composition effect of Mg is predicted as:
The equation (Eq. 28) implies that as the mixture counter plot shown the composition of rice and sorghum flour in the blending increases the magnesium mineral concentration in the product. The supplemented flaxseed flour also increased the Mg concentration in the formulated injera. The manganese content of formulated injera was found to range from 2.92 to 7.24 mg/100 g. For comparison, sorghum flour injera (used as a control) contained 2.50 mg/100 g of manganese, while teff flour injera (another control) contained 6.76 mg/100 g (Table 7). There has been limited research on the manganese mineral content in composite flour injera products. The mixture contour plot (Fig. 8) and the prediction model (Eq. 29) indicated that increasing the proportions of sorghum and teff in the composition led to a higher manganese content. Although rice flour is also an important source of manganese, its role in enhancing manganese availability was not as significant53,74.

Contour plot of manganese (A) and potassium component (B) response.
The potassium content of formulated injera ranged from 38.88 to 43.15 mg/100 g. Specifically, injera made from 100% sorghum flour had 38.67 mg/100 g, and injera made from 100% teff flour had 40.33 mg/100 g (Table 7). The highest potassium content (43.15 mg/100 g) was found in the BR10 blend (50% sorghum, 23.5% rice, and 26.5% teff), while the lowest (38.88 mg/100 g) was found in the BR1 blend (50% sorghum, 27% rice, and 23% teff). According to75, rice is a common source of potassium. However, the mixture contour plot showed that increasing rice composition led to a linear decrease in potassium content in the formulated injera. There are limited studies on the potassium content in composite flour injera made from cereal grains. The mixture contour plot and prediction model indicated that the potassium content is primarily affected by the sorghum composition in the blend (Fig. 8). A significant difference (p < 0.05) was observed in the linear and quadratic model interactions of rice and teff flour, whereas the quadratic model interactions of sorghum with rice and sorghum with teff flour showed no significant difference (Table 6).
Microbial load analysis of injera at different storage periods
The effects of blending ratios and flaxseed supplementation on the microbial quality of injera samples over storage durations of 0, 2, 4, and 6 days after baking are presented in Table 8. On day 0, no yeast or mold was detected. By the second day of storage, yeast and mold colonies were present in the 100% sorghum and teff flour injera used as controls, while the ten experimental trials of blended injera from sorghum, rice, and teff composite flours were supplemented with 3% flaxseed flour. The highest yeast and mold counts (2.55 cfu/g) and the lowest (2.48 cfu/g) were observed in the day 2 storage duration for injera with whole flaxseed flour supplementation. In the 100% sorghum and teff flour injera, yeast and mold counts were 2.61 cfu/g and 2.63 cfu/g, respectively.
On the fourth day of storage, the highest yeast and mold colony count was 3.63 cfu/g, and the lowest was 3.55 cfu/g. For 100% sorghum and teff flour injera, the counts were 3.59 cfu/g and 3.68 cfu/g, respectively. By the sixth day of storage, the highest yeast and mold colony count was 4.71 cfu/g, and the lowest was 4.59 cfu/g for all blended injera. The 100% sorghum and teff flour injera had yeast and mold colony counts of 4.48 cfu/g and 4.57 cfu/g, respectively. There was no significant (p < 0.05) difference in yeast and mold colony counts across different storage periods. However, by the sixth day, the yeast and mold colony count in sorghum flour injera had decreased compared to the 100% teff flour injera and blended injera products (composite flour with flaxseed flour supplement). This reduction is attributed to the loss of moisture content, which minimizes favorable conditions for microbial growth.
According to the study by76, flaxseed demonstrated significant antifungal properties, which contributed to the observed reduction in yeast mold and total bacterial microbial load. This might be due to the relatively low concentration of teff in the blends. In contrast, the microbial load in injera made from sorghum and teff flour was higher than in the flaxseed blends. The yeast-mold colony count was significantly affected by both the blending ratio (BR) and the storage period (SP) (p < 0.05). Reference72 reported microbial yeast-mold colony counts ranging from 1.93 to 4.02 CFU/g and total bacterial colony counts from 2.63 to 4.02 CFU/g in teff and fenugreek composite flour injera over different storage times. The current study’s findings align with72’s results. Incorporating flaxseed flour into injera led to a decrease in microbial counts, as both yeast mold and total bacterial counts were highest in the control samples of injera, corroborating the findings of22. Figure 9 displays the blending ratios of injera products from 12 experimental trials alongside air-dried injera, prepared for further analysis.

The 12 experimental trial blending ratio injera products (The resulting product represented (1) Control 1, (2) Control 2, (3) BR1, (4) BR2, (5) BR3, (6) BR4, (7) BR5, (8) BR6, (9) BR7, 10.BR8, 11.BR9, and 12. BR10.
Total bacterial growth was observed in some blending injera sample products during day 0 enumeration, likely due to material contamination, as the baked injera had undergone thermal processing. On the 2nd day of storage, the highest colony count was 2.52 cfu/g, and the lowest was 2.43 cfu/g. Similarly, the microbial quality of injera made from 100% sorghum flour (2.48 cfu/g) and 100% teff flour (2.59 cfu/g) showed slightly higher total bacterial loads. By the 4th day of storage, the highest total bacterial growth observed was 3.60 cfu/g, and the lowest was 3.53 cfu/g. The control samples of sorghum flour and teff flour injera had bacterial colony counts of 3.59 cfu/g and 3.64 cfu/g, respectively. On the 6th day, the highest and lowest total bacterial loads observed were 4.63 cfu/g and 4.56 cfu/g, respectively. The control bacterial colony counts for sorghum and teff flour injera were 2.49 cfu/g and 4.59 cfu/g, respectively. This increase in bacterial load is attributed to the staling effect in sorghum flour injera, caused by moisture transfer from crumb to crust and intrinsic firming of the cell wall material, which is associated with starch recrystallization during storage 77. The growth of total bacterial colonies was evident by the 6th day of storage.
Optimization of overall acceptable quality injera
Acceptability of the overall optimal formulation value to develop injera having high qualities about its proximate, mineral, and combination of their response values. The nutritional quality of injera covered all the main important parameters, those of its proximate and mineral concentration due to its better quality for consumers. BR2 formulation was labeled to be optimized which was in the ratio of 50% (sorghum), 20% (rice), and 30% (teff), the optimized blended ratio based on macro-nutritional (proximate), micro-nutritional (mineral) with the desirability of 0.9474. Table 9 displays the results of the overall optimized response parameters.
Optimization of the proximate composition of injera for protein, fiber, carbohydrate, and energy increases progressively as the composition of sorghum in the component increases with constant flaxseed flour supplemented for each blending. The white region in (Fig. 10) shows that an optimum proximate content, optimum mineral content, of the formula of sorghum, teff, and rice supplemented with flaxseed flour results in desirable attributes.

Overlaid mixture contour plot of overall optimization.
The optimum responses of fiber, protein, carbohydrate, energy, iron, zinc, and calcium contents were 3.02%, 9.30%, 83.16%, 393.24 kcal/100 g, 13.99 mg/100 g, 3.78 mg/100 g, and 4.06 mg/100 g, respectively. The total mineral content of injera progressively increases due to the blending ratio as compared to controls. Optimization suggested that injera made with 50% sorghum, 20% rice, and 30% teff achieved the best solution for this combination of variables with a desirability of 0.9474.
Conclusion
A nutritionally enhanced injera was produced by blending sorghum, rice, and teff flours with a small amount of flaxseed flour. The study analyzed the proximate, functional, and mineral composition of the flours, anti-nutritional factors, and microbial load to improve injera’s nutritional quality compared to a control made from 100% sorghum flour. The optimal blend, consisting of 50% sorghum, 20% rice, 30% teff, and 3% flaxseed flour, resulted in injera with 3.02% fiber, 9.30% protein, 83.16% carbohydrates, 393.24 kcal/100 g energy, and notable levels of iron (13.99 mg/100 g), calcium (4.06 mg/100 g), and zinc (3.78 mg/100 g). This blend was identified as the most nutritionally beneficial.
The highest crude fat content (3.20%) was found in injera made with a 50% sorghum, 20% rice, and 30% teff blend (BR2). The highest crude fiber content (4.50%) was observed in injera made from BR4 (46.5% sorghum, 27% rice, 26.5% teff) and BR5 (43% sorghum, 27% rice, 30% teff). The highest crude protein (9.31%) and carbohydrate (83.67%) contents were also in BR2. Regarding anti-nutritional factors, the highest phytate content (177.93 mg/100 g) was found in BR7 (45.34% sorghum, 25.83% rice, 28.83% teff), total phenols (5.39 mg/100 g) in BR2, total flavonoids (388.2 mg/100 g) in BR6 (47.67% sorghum, 24.67% rice, 27.66% teff), and condensed tannins (0.17 mg/100 g) in BR8 (48.83% sorghum, 22.34% rice, 28.83% teff). The mineral content improved with the blend of sorghum, rice, and teff, suggesting the potential of underutilized grains and seeds to enhance the nutritional value of injera. We recommend applying this approach to other traditional and modern food products, such as bread, porridges, and snack bars, incorporating diverse grain and seed flours. This could help address nutritional deficiencies and improve the dietary profiles of populations that rely on staple foods.
Data availability
The data used to support the findings of this study are included in the article.
References
-
Abewa, A. et al. Effect of different cereal blends on the quality of Injera a staple food in the highlands of Ethiopia. Momona Ethiop. J. Sci. 9 (2), 232. https://doi.org/10.4314/mejs.v9i2.7 (2020).
Google Scholar
-
Awulachew, M. T. Optimization and modeling of Teff, Sorghum and Fenugreek Flour Mixing Ratios for Better Quality Characteristics of injera by using D-Optimal mixture design optimization and modeling of Teff, Sorghum and Fenugreek Flour Mixing Ratios for Better Quality C. https://doi.org/10.20944/preprints202308.1709.v1 (2023).
-
Mihrete, Y. The mineral content and sensory properties of injera made from the Faba Bean, Sorghum and Tef Flour blend. Int. J. Nutr. 4 (2), 1–13. https://doi.org/10.14302/issn.2379-7835.ijn-19-2629 (2019).
Google Scholar
-
Neela, S. & Fanta, S. W. Injera (an ethnic, traditional staple food of Ethiopia): a review on traditional practice to scientific developments. J. Ethn. Foods. 7 (1), 32 (2020).
Google Scholar
-
Do Nascimento, K. D. O., Paes, S., de Oliveira, I. R., Reis, I. P. & Augusta, I. M. Teff: suitability for different food applications and as a raw material of gluten-free, a literature review. J. Food Nutr. Res. 6 (2), 74–81 (2018).
Google Scholar
-
Tadele, E. & Hibistu, T. Empirical review on the use dynamics and economics of teff in Ethiopia. Agric. Food Secur. 10, 1–13 (2021).
Google Scholar
-
Fikadu, A. A., Wedu, T. D. & Derseh, E. A. Review on Economics of Teff in Ethiopia. Open. Acc. Biostat Bioinform. 2 (3), 1–8. https://doi.org/10.31031/OABB.2018.02.000539 (2019).
Google Scholar
-
Kefale, B. Evaluation of injera prepared from composite flour of teff and barley variety. Food Sci. Qual. Manag. 97, 1–4. https://doi.org/10.7176/fsqm/97-01 (2020).
Google Scholar
-
Fekadu, T. Nutrient Enrichment of Injera to Improve Food and Nutrition Security in Ethiopia (2023).
-
Waniska, R. D., Rooney, L. W., McDonough, C. M. & Sorghum Utilization. In Encyclopedia of Food Grains: Second Edition. https://doi.org/10.1016/B978-0-12-394437-5.00128-5 (2015).
-
G BY M The Effect of blending ratio of tef [Eragrostis Tef (Zucc) Trotter], Sorghum (Sorghum bicolor (L.) Moench) and Faba Bean (Vicia faba) and Fermentation Time on Chemical composition of Injera. J. Nutr. Food Sci. 07 (02), 1–7. https://doi.org/10.4172/2155-9600.1000583 (2017).
-
Yetneberk, S., De Kock, H. L., Rooney, L. W. & Taylor, J. R. N. Effects of Sorghum Cultivar on Injera Quality. Cereal Chem. 81 (3), 314–321. https://doi.org/10.1094/CCHEM.2004.81.3.314 (2004).
Google Scholar
-
Legesse, S., Worku, S. & Bultosa, G. Effect of rice variety and blending proportion on the proximate compositions, minerals and phytic acid contents of bread from rice-teff blend [version 1; peer review: 2 approved]. FResearch 4, 1–24. https://doi.org/10.12688/f1000research.6201.1 (2015).
Google Scholar
-
Chandra, S. Assessment of functional properties of different flours. Afr. J. Agric. Res. 8 (38), 4849–4852. https://doi.org/10.5897/AJAR2013.6905 (2013).
Google Scholar
-
Chandio, A. A. & Yuansheng, J. Determinants of adoption of improved rice varieties in northern Sindh, Pakistan. Rice Sci. https://doi.org/10.1016/j.rsci.2017.10.003 (2018).
Google Scholar
-
de Oliveira do Nascimento, K., do Nascimento Dias Paes, S., Reis de Oliveira, I., Pereira Reis, I. & Maria Augusta, I. Teff: suitability for different food applications and as a raw material of gluten-free, a literature review. J. Food Nutr. Res. 6 (2), 74–81. https://doi.org/10.12691/jfnr-6-2-2 (2018).
Google Scholar
-
Solomon, B., Advisor, A. & Mengesha, M. Design of Lift and Its Control Using FPGA for Machine Tower of Assela Malt Factory (2020).
-
Cherie, Z., Ziegler, G. R., Fekadu Gemede, H. & Zewdu Woldegiorgis, A. Optimization and modeling of teff-maize-rice based formulation by simplex lattice mixture design for the preparation of brighter and acceptable injera. Cogent Food Agric. 4 (1), 381. https://doi.org/10.1080/23311932.2018.1443381 (2018).
Google Scholar
-
Upadhyay, A., Karn, S. K. & Rice, B. Brown Rice: Nutritional Composition and Health Benefits, vol. 10, 48–54 (2018).
-
Saleh, A. S. M., Wang, P., Wang, N., Yang, L. & Xiao, Z. Brown rice versus white rice: nutritional quality, potential health benefits, development of food products, and preservation technologies. Compr. Rev. Food Sci. Food Saf. 18. https://doi.org/10.1111/1541-4337.12449 (2019).
-
Mercier, S. et al. Flaxseed-enriched cereal-based products: a review of the impact of processing conditions. Compr. Rev. Food Sci. Food Saf. 13 (4), 400–412. https://doi.org/10.1111/1541-4337.12075 (2014).
Google Scholar
-
Girma, T., Bultosa, G. & Bussa, N. Effect of grain tef [Eragrostis tef (Zucc.) Trotter] flour substitution with flaxseed on quality and functionality of injera. Int. J. Food Sci. Technol. https://doi.org/10.1111/j.1365-2621.2012.03194.x (2013).
Google Scholar
-
Mercier, S. et al. Flaxseed-enriched cereal‐based products: a review of the impact of processing conditions. Compr. Rev. Food Sci. Food Saf. 13 (4), 400–412 (2014).
Google Scholar
-
Anberbir, S. M. et al. Nutrient composition and health benefits. Cereal Chem. 4 (4), 370–376. https://doi.org/10.1002/star.200200191 (2018).
Google Scholar
-
Awulachew, M. T. et al. Applications of composite flour in development of food products. Int. Food Res. J. 21 (6). https://doi.org/10.20944/preprints202308.1709.v1 (2014).
-
Feyera, M. Proximate, anti-nutrients and sensorial acceptability of some cereal and legume based composite biscuits. Food Sci. Qual. Manag. 98, 18–25 (2020).
-
Syeunda, C. O. Protein, Anti-nutrient and Sensory Qualities of Complementary Food Made from Malted Finger Millet (Eleusine coracana l.) and Cowpea (Vigna unguiculata l.) Composite Flour (2019).
-
Satheesh, N. & Fanta, S. W. Review on structural, nutritional and anti-nutritional composition of Teff (Eragrostis tef) in comparison with Quinoa (Chenopodium quinoa Willd). Cogent Food Agric. 4 (1), 1546942 (2018).
Google Scholar
-
Woldemariam, F., Mohammed, A., Fikre Teferra, T. & Gebremedhin, H. Optimization of amaranths–teff–barley flour blending ratios for better nutritional and sensory acceptability of injera. Cogent Food Agric. 5 (1), 1565079. https://doi.org/10.1080/23311932.2019.1565079 (2019).
Google Scholar
-
Bultosa, G. Physicochemical characteristics of grain and flour in 13 tef [Eragrostis tef (Zucc.) Trotter] grain varieties. J. Appl. Sci. Res. (2007).
-
Ghebrehiwot, H. M., Shimelis, H. A., Kirkman, K. P., Laing, M. D. & Mabhaudhi, T. Nutritional and sensory evaluation of injera prepared from tef and Eragrostis curvula (Schrad.) Nees. Flours with sorghum blends. Front. Plant. Sci. 7, 1–8. https://doi.org/10.3389/fpls.2016.01059 (2016).
Google Scholar
-
Yoseph, L. A., Shimelis, A. E., Workineh, A., Marina, V. & Felicidad, R. The effect of mechanical kneading and absit preparation on tef injera quality. Afr. J. Food Sci. 12 (10), 246–253. https://doi.org/10.5897/ajfs2018.1722 (2018).
Google Scholar
-
Yetneberk, S., Rooney, L. W. & Taylor, J. R. N. Improving the quality of sorghum injera by decortication and compositing with tef. J. Sci. Food Agric. https://doi.org/10.1002/jsfa.2103 (2005).
Google Scholar
-
Berhane, G., Paulos, Z., Tafere, K. & Tamru, S. Foodgrain consumption and calorie intake patterns in Ethiopia. In IFPRI Ethiop Strateg Support Progr II (ESSP II) Work Pap 1–17 (2011).
-
Ashagrie, Z. & Abate, D. Improvement of injera shelf life through the use of. Afr. J. Food Agric. Nutr. Dev. 12 (5), 6409–6423 (2012).
Google Scholar
-
Bultosa, G. & Taylor, J. R. N. Encyclopedia of Grain Science https://doi.org/10.1016/b0-12-765490-9/00172-5 (2004).
Google Scholar
-
AOAC. Official Method of the Association of Official Analytical Chemists (Association of Official Analytical Chemists, 2000).
-
WHO, FAO. Protein and Amino Acid Requirements in Human Nutrition Report of a Joint FAO/WHO/UNU Expert Consultation (WHO Technical Report Series 935) (2007).
-
FAO. Calculation of the energy content of foods—energy conversion factors. In Food Energy—Methods Anal. Convers. Factors Rep. Tech. Work 18–56 (2003).
-
Nguyen, T. T. T. et al. Effect of fermentation by amylolytic lactic acid bacteria, in process combinations, on characteristics of rice/soybean slurries: a new method for preparing high energy density complementary foods for young children. Food Chem. https://doi.org/10.1016/j.foodchem.2005.09.080 (2007).
Google Scholar
-
Latta, M. & Eskin, M. A simple and rapid colorimetric method for phytate determination. J. Agric. Food Chem. 28 (6), 1313–1315. https://doi.org/10.1021/jf60232a049 (1980).
Google Scholar
-
Vaintraub, I. A. & Lapteva, N. A. Colorimetric determination of phytate in unpurified extracts of seeds and the products of their processing. Anal. Biochem. https://doi.org/10.1016/0003-2697(88)90382-X (1988).
Google Scholar
-
Dykes, L. Tannin analysis in sorghum grains. Methods Mol. Biol. 1931, 109–120. https://doi.org/10.1007/978-1-4939-9039-9_8 (2019).
Google Scholar
-
Georgé, S., Brat, P., Alter, P. & Amiot, M. J. Rapid determination of polyphenols and vitamin C in plant-derived products. J. Agric. Food Chem. https://doi.org/10.1021/jf048396b (2005).
Google Scholar
-
Othman, A., Mukhtar, N. J., Ismail, N. S. & Chang, S. K. Phenolics, flavonoids content and antioxidant activities of 4 Malaysian herbal plants. Int. Food Res. J. 21 (2), 759 (2014).
Google Scholar
-
Yetneberk, S. Sorghum injera Quality Improvement Through Processing and Development of Cultivar Selection Criteria 112–128 (2004).
-
Wendy, D. A. Influence of Processing Parameters on Eye Size and by Pennsylvania State Univ Grad Sch (2014).
-
Gemeda, F. T., Guta, D. D., Wakjira, F. S. & Gebresenbet, G. Physicochemical characterization of effluents from industries in Sabata town of Ethiopia. Heliyon 6 (8), e04624 (2020).
Google Scholar
-
Pohjanheimo, T. A., Hakala, M. A., Tahvonen, R. L., Salminen, S. J. & Kallio, H. P. Flaxseed in breadmaking: effects on sensory quality, aging, and composition of bakery products. J. Food Sci. https://doi.org/10.1111/j.1750-3841.2006.00005.x (2006).
Google Scholar
-
Baye, K. & Synopsis Teff: nutrient composition and health benefits. In Ethiop. Strateg Support Progr 2013–2014 (2014).
-
Makokha, A. O., Oniang’o, R. K., Njoroge, S. M. & Kamar, O. K. Effect of traditional fermentation and malting on phytic acid and mineral availability from sorghum (Sorghum bicolor) and finger millet (Eleusine coracana) grain varieties grown in Kenya. Food Nutr. Bull. https://doi.org/10.1177/15648265020233s147 (2002).
Google Scholar
-
Devi, N. L. et al. Development of protein-rich sorghum-based expanded snacks using extrusion technology. Int. J. Food Prop. https://doi.org/10.1080/10942912.2011.551865 (2013).
Google Scholar
-
Peña-Rosas, J. P. et al. Fortification of rice with vitamins and minerals for addressing micronutrient malnutrition. Cochrane Database Syst. Rev. https://doi.org/10.1002/14651858.CD009902.pub2 (2019).
Google Scholar
-
Foster-Powell, K., Holt, S. H. A. & Brand-Miller, J. C. International table of gylcemic index and glycemic load values: 2002. Am. J. Clin. Nutr. https://doi.org/10.1093/ajcn/76.1.5 (2002).
Google Scholar
-
Ashenafi, M. & Review Article A review on the Microbiology of Indigenous Fermented foods and beverages of Ethiopia. Ethiop. J. Biol. Sci. https://doi.org/10.4314/ejbs.v5i2.39036 (2008).
Google Scholar
-
Schmidt, C. C., Vasic, V. & Stein, A. Doa10 is a membrane protein retrotranslocase in Er-associated protein degradation. Elife 9, 1–31. https://doi.org/10.7554/eLife.56945 (2020).
Google Scholar
-
Beruk Berhanu Desalegn; Fasil Tarekegn Desta. Effect of blending ratio on Proximate Composition, Physico-Chemical Property, and sensory acceptability of Injera produced from Red Tef Effect of blending ratio on Proximate Composition, Physico-Chemical Property, and sensory acceptability of Injera P. Food Sci. Qual. Mangement. 68, 6–10 (2017).
-
Derero, A., Tesfaye, G. & Woldemariam, Z. Variation in seed traits and seedling vigour of Cordia Africana Lam. Provenances in Ethiopia. J. Res. 28 (5), 925–933 (2017).
Google Scholar
-
Woldemariam, F. et al. Cogent Food & Agriculture Optimization of amaranths—teff—barley flour blending ratios for better nutritional and sensory acceptability of injera optimization of amaranths—teff—barley flour blending ratios for better nutritional and sensory accepta. Cogent Food Agric. 5 (1), 79. https://doi.org/10.1080/23311932.2019.1565079 (2019).
Google Scholar
-
Dykes, L. Sorghum phytochemicals and their potential impact on human health. Methods Mol. Biol. https://doi.org/10.1007/978-1-4939-9039-9_9 (2019).
Google Scholar
-
Saura-Calixto, F. Dietary fiber as a carrier of dietary antioxidants: an essential physiological function. J. Agric. Food Chem. 59 (1), 43–49. https://doi.org/10.1021/jf1036596 (2011).
Google Scholar
-
Mohammed, N. A., Ahmed, I. A. M. & Babiker, E. E. Nutritional evaluation of sorghum flour (Sorghum bicolor L. Moench) during processing of injera. World Acad. Sci. Eng. Technol. 51, 72–76 (2011).
-
Dykes, L. & Rooney, L. W. Sorghum and millet phenols and antioxidants. J. Cereal Sci. https://doi.org/10.1016/j.jcs.2006.06.007 (2006).
Google Scholar
-
Moench, L. et al. Nutritional evaluation of sorghum flour (Sorghum). Eng. Technol. 2011, 58–62 (2014).
-
Baye, K. Nutrient composition and health benefits. In Econ tef, Explor Ethiop biggest cash Crop Int. Food Policy Res. Inst. (IFPRI) Wasingt DC 371–396 (2018).
-
Shumoy, H., Gabaza, M., Vandevelde, J. & Raes, K. Impact of fermentation on in vitro bioaccessibility of phenolic compounds of tef injera. Lwt 99, 313–318 (2019).
Google Scholar
-
Awika, J. M. & Rooney, L. W. Sorghum phytochemicals and their potential impact on human health. Phytochemistry. https://doi.org/10.1016/j.phytochem.2004.04.001 (2004).
Google Scholar
-
Leykun, T. Evaluation of the mineral content, phyto-chemicals profile and microbial quality of tef injera supplemented by fenugreek flour. J. Food Sci. Technol. https://doi.org/10.1007/s13197-020-04283-y (2020).
Google Scholar
-
Morris, D. Description and composition of flax. Flax Heal Nutr. Prim. 1, 1 (2007).
Google Scholar
-
Girard Audrey, L. A4 – awika, Joseph M. ALAG. Sorghum polyphenols and other bioactive components as functional and health promoting food ingredients. J. Cereal Sci. 84, 112–124. https://doi.org/10.1016/j.jcs.2018.10.009 (2018).
Google Scholar
-
Perera, I., Seneweera, S. & Hirotsu, N. Manipulating Phytic Acid Content Rice Grain toward Improving Micronutrient Bioavailab. https://doi.org/10.1186/s12284-018-0200-y (2018).
-
Leykun, T., Admasu, S. & Abera, S. Evaluation of the mineral content, phyto-chemicals profile and microbial quality of tef injera supplemented by fenugreek flour. J. Food Sci. Technol. 57 (7), 2480–2489. https://doi.org/10.1007/s13197-020-04283-y (2020).
Google Scholar
-
Godebo, D. D., Dessalegn, E. & Niguse, G. Nutritional composition, microbial load and sensory properties of fenugreek (Trigonella foenum-graecum L.) flour substituted injera. J. Food Process Technol. 10 (7), 799. https://doi.org/10.4172/2157-7110.1000799 (2019).
-
Babu P, Subhasree R, Bhakyaraj R, Vidhyalakshmi R. Brown rice-beyond the color reviving a lost health food-a review. Magnesium (2009).
-
Vandeputte, G. E. & Delcour, J. A. From sucrose to starch granule to starch physical behaviour: a focus on rice starch. Carbohydr. Polym. https://doi.org/10.1016/j.carbpol.2004.06.003 (2004).
Google Scholar
-
Xu, Y., Hall, I. I. I. C., Wolf-Hall, C. & Manthey, F. Fungistatic activity of flaxseed in potato dextrose agar and a fresh noodle system. Int. J. Food Microbiol. 121 (3), 262–267 (2008).
Google Scholar
-
Czuchajowska, Z. & Pomeranz, Y. Differential scanning calorimetry, water activity, and moisture contents in bread center and near-crust zones of bread during storage. Cereal Chem. 1, 1 (1989).
Acknowledgements
We would like to thank the Food, and Beverage Industry Research and Development Center, Addis Ababa Science and Technology University, Addis Ababa University, and Bahir Dar University for their technical assistance.
Author information
Authors and Affiliations
Contributions
Conceptualization: M.A., and E.K.; Methodology: S.T., and E.K.; Software: S.T., and T.A.; Validation: T.A.; Formal Analysis: T.A., and A.A.; Investigation: S.T.; Data Curation: M.W.; Writing—Original Draft Preparation: S.T., E.K., and M.A.; Writing—Review and Editing: A.T.; Visualization and Supervision: S.J., and D.T. All authors have reviewed and approved the final version of the manuscript for publication.
Corresponding author
Ethics declarations
Competing interests
The authors declare no competing interests.
Additional information
Publisher’s note
Springer Nature remains neutral with regard to jurisdictional claims in published maps and institutional affiliations.
Rights and permissions
Open Access This article is licensed under a Creative Commons Attribution-NonCommercial-NoDerivatives 4.0 International License, which permits any non-commercial use, sharing, distribution and reproduction in any medium or format, as long as you give appropriate credit to the original author(s) and the source, provide a link to the Creative Commons licence, and indicate if you modified the licensed material. You do not have permission under this licence to share adapted material derived from this article or parts of it. The images or other third party material in this article are included in the article’s Creative Commons licence, unless indicated otherwise in a credit line to the material. If material is not included in the article’s Creative Commons licence and your intended use is not permitted by statutory regulation or exceeds the permitted use, you will need to obtain permission directly from the copyright holder. To view a copy of this licence, visit http://creativecommons.org/licenses/by-nc-nd/4.0/.
Reprints and permissions
About this article
Cite this article
Amtataw, M., Kassahun, E., Tibebu, S. et al. Nutritional and anti-nutritional evaluation of injera made from Sorghum, Rice, Teff, and Flaxseed flours using D-optimal mixture design.
Sci Rep 15, 3959 (2025). https://doi.org/10.1038/s41598-025-88407-4
-
Received: 06 September 2024
-
Accepted: 28 January 2025
-
Published: 01 February 2025
-
DOI: https://doi.org/10.1038/s41598-025-88407-4
Keywords
- D-optimal
Injera
- Nutritional profile
- Blending