Participant characteristics
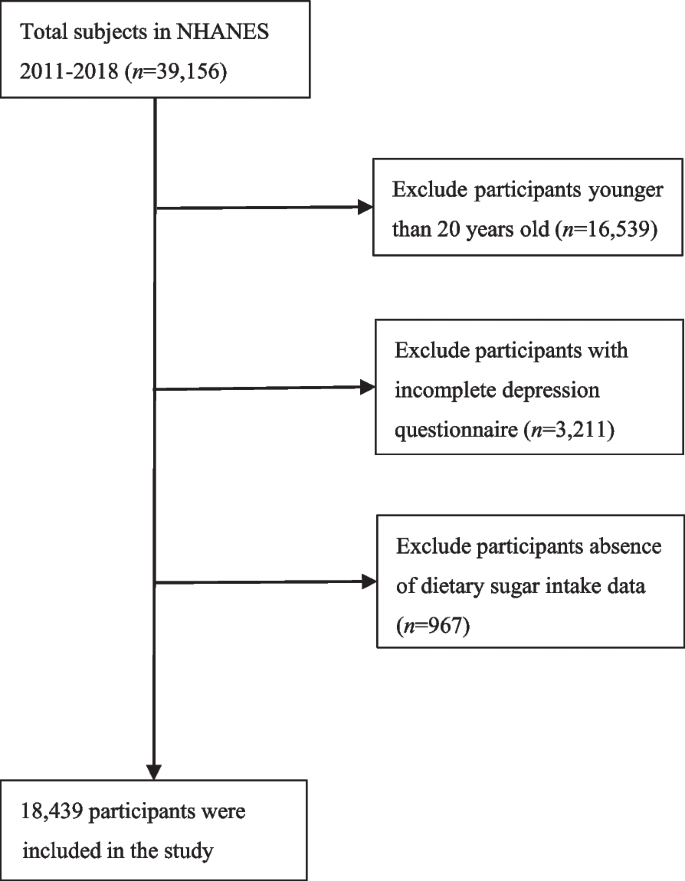
This study included 18,439 participants (Fig. 1).

Flowchart for inclusion of study participants
Table 1 presents the quartiles of participants according to their dietary sugar intake. There were statistically significant differences in age, sex, educational level, race/ethnicity, marital status, PIR, smoking status, alcohol status, HTN, DM, CVD, energy intake, and physical activity among the different dietary sugar intake groups (P < 0.05). No significant differences occurred in BMI (P > 0.05). Covariates with P < 0.05 in univariate analysis were included for further analysis.
Participants in the lowest dietary sugar intake in quartile (Q1, < 57.47g/d) were generally older, of female gender, highly educated, non-Hispanic white, living with a partner, rather wealthy, smoked less, drank more, had no HTN, DM, or CVD, had a lower energy intake, and were less active. Conversely, participants with the highest dietary sugar intake in Q4 (≥ 141.76g/d) were likely to be younger, of male gender, highly educated, non-Hispanic white, married or cohabitating, had a lower income, consumed more alcohol, never smoked, had no HTN, DM, or CVD, a higher energy intake and did not engage in physical activity.
A comparison of the characteristics between the participants included and excluded from the analysis is presented in Table S1 in the Supplementary Material (except for participants who were excluded because of their age). The missing data are listed in Table S2.
Association between dietary sugar intake and depression
In the comprehensively adjusted model, a linear relationship was observed between dietary sugar intake and depression (Fig. 2).

Association between dietary sugar intake and depression in US adults (n = 18,439). The black vertical line on the horizontal axis represents the dietary sugar intake distribution, the red line represents the best fit, and the difference between the dashed lines represents the 95% confidence interval. The data were adjusted for age, sex, race/ethnicity, PIR, educational level, marital status, HTN, DM, CVD, drinking status, smoking status, physical activity level, and energy intake
Table 2 presents the results of the multiple regression analysis. In the crude model, dietary sugar intake was positively correlated with depression (odds ratio [OR] = 1.17, 95% confidence interval [CI]:1.10–1.24, P < 0.001). After adjusting for confounders, a significant relationship was observed between dietary sugar intake and depression in Models 1–3. In Model 3, adjustment for all covariates revealed that the incidence of depression increased by 28% for every 100 g/d increase in dietary sugar intake (OR = 1.28, 95% CI = 1.17–1.40, P < 0.001).
After adjusting for age, sex, race/ethnicity, PIR, educational level, marital status, HTN, DM, CVD, drinking status, smoking status, physical activity level, and energy intake compared with participants in the first quartile (dietary sugar intake 57.47 g/d), the second group (≥ 57.47 to < 93.42 g/d, OR = 0.87, 95% CI = 0.73–1.03, P = 0.096), the third group (≥ 93.42 to < 141.76 g/d, OR = 1.01, 95% CI = 0.85–1.20, P = 0.945), and the fourth group (≥ 141.76 g/d, OR = 1.33, 95% CI = 1.10–1.61, P = 0.003) had an increased prevalence of depression (P for trend was significant in all the models).
Additionally, we performed subgroup and threshold effect analyses. Subgroup analyses according to age, sex, race/ethnicity, PIR, educational level, marital status, HTN, DM, CVD, drinking status, smoking status, physical activity, and energy intake revealed results similar to those of the main analysis (Fig. 3).

Forest plot of subgroup analysis of the effect of dietary sugar intake on depression (N = 18,439) Abbreviations: OR (Odds Ratio); PIR (poverty-income ratio); HTN (hypertension); DM (diabetes mellitus); CVD (cardiovascular disease)
No significant interactions were observed between dietary sugar intake and any of the variables. Table 3 presents the results of the threshold effect, indicating that dietary sugar intake was linearly associated with depression (log-likelihood ratio (LLR) = 0.051).