Abstract
The planet faces a triple crisis from climate change, biodiversity loss, and pollution. Like any country, the UK needs to attract the best available talent to become thought leaders to overcome these global challenges. Several Science, Technology, Engineering and Maths subjects in the UK face challenges with attracting ethnic minority students. As part of a wider project on diversity in UK environmental/marine science, we analysed university applications amongst 180 environmental and 88 marine science degrees in the UK between 2019–2021. We found them to be the least diverse degree subjects for ethnic minority students and Asian students were less likely to be accepted than white students on environmental science degrees. A survey of UK marine science course leaders highlights the belief that these issues impact the pipeline of diversity from higher education institutions to marine/environmental science careers. In this paper, we discuss the impacts of these findings and develop a roadmap to change.
Introduction
We are facing a triple planetary crisis through climate change, biodiversity loss, and pollution1,2,3. Through the ‘one health’ approach sustainable living and healthy ecosystems are essential to both human health and wellbeing and requires using transdisciplinary approaches4. We require the best talent attracted to environmental subjects if we are to tackle these serious global challenges.
While there have been a number of reports looking at the equality, diversity, and inclusiveness in the sciences5,6,7, very few have looked specifically at those relating to marine and environmental sciences. A student led charity Students Organising for Sustainability (SOS) UK presented a report entitled ‘Racial Diversity in the Environmental Professions’ which highlights that ‘Environment Professionals’ are one of the least racially diverse professions in the UK, with just 4.81% identifying as Black, Asian or from other minority ethnic groups, compared to 12.64% across all UK professions8. This echoed earlier studies by the Policy Exchange9 that found that out of 202 professions studied, ‘environment professionals’ are the second least diverse profession in the UK with the least diverse being ‘farmers’. These data highlight that there are either issues in the recruitment pipeline to these subject areas within higher education and/or that these graduates face barriers to employment. Within Science, Technology, Engineering and Mathematics (STEM), there has been a push for increased diversity6. However, new data, such as a report on the lack of ethnic minority Chemistry Professors in the United Kingdom, highlights that there is still work to be done10. Increasing diversity in academia is not just a matter of fairness but also improves science11. For example, several studies have found that laboratories with greater numbers of nationalities or ethnicities have had greater outputs or publication quality metrics12,13,14.
Marine Science research through fundamental and applied research into climate change, fisheries and energy is an area of STEM that is key for a sustainable future15. International comparative data on the lack of minority groups entering marine and environmental sciences is limited. The Journal of Geoscience Education published a special issues in 2007 and a follow-up in 2019, highlighting US federal and private funding agencies attempt to address the lack of diversity and inclusion in the geosciences. These special issues illustrate previous and current national initiatives to improve diversity and inclusion in the geosciences, which include ocean sciences16. In the US, Bernard and Cooperdock17 have reported a lack of diversity within the doctorate community in the US for geosciences (including ocean sciences) over the last 4 decades. The group Black in Marine Sciences (BIMS) was formed in 2020 to celebrate Black marine scientists, spread environmental awareness and inspire the next generation of scientific thought leaders. Furthermore, several initiatives have been set up to try and address the issues more broadly. For example, the Woods Hole Partnership Education Program was set up in 2009 specifically to address and provide internship programs for underrepresented minorities marine institute16. The Challenger Society for Marine Science has been running a number of initiatives Diversity in Marine Science (DiMS) since 2016 and has hosted several online seminars to highlight proactive initiatives. Unfortunately, there has not been any spotlight on ethnicity in UK Marine Science. Our team believed that UK marine sciences lacked diversity in recruiting home-based ethnic minority groups. Furthermore, informal discussions with key organisations indicated that this might impact employment into the marine/environmental science sector. In an attempt to gain a scale of the problem we conducted an analysis of graduate recruitment covering 3 years (2019–2021) using UCAS/HESA data. This analysis determined the gender and numbers of applications vs accepted positions by ethnic groups at all UK higher education institutions offering marine and environmental sciences. We determined where applicants were applying from and their corresponding POLAR4 quintile classifications to determine young person participation in higher education. We established a database of marine science course/module leaders: they were emailed a survey to determine their perceptions of the problem, whether they felt this impacted on careers in marine sciences and if they felt universities could be doing more to attract ethnic minority students. We also asked course leaders their opinions on the drivers for limited take-up of marine and environmental sciences by ethnic minority students.
Results
Between 2019 and 2021 there were 17735 unique applications from home students (n = 14,070) and international students (n = 3665) to UCAS to study marine and environmental sciences subjects in UK universities, of which just over half (50.4%) were accepted. Over half of these applications were for courses in marine sciences (n = 9555) with acceptance rates around 50–60% of which 8050 were UK home students. No differences in acceptance rates between white and any ethnic minority groups were observed in marine sciences. In the marine and environmental sciences degrees combined we identified that Asian students were significantly less likely to be accepted (45% acceptance: χ2 = 15.2309; p < 0.001) onto degree courses compared to all other ethnic groups (50–60% acceptance; Supplementary Tables 2 & 3).
There were more unique applications from students identifying as females (n = 9930) compared to males (n = 7805) for marine and environmental science degrees between 2019 and 2021 of which 4980 and 3955 were accepted, respectively. This gives near identical acceptance rates (50.7% and 50.2%) for males and females. Similarly, for marine sciences only, there were more applications identifying as female (n = 5025) compared to male (n = 4540) which resulted in 2460 acceptances for male and 2855 for female applicants. Those applicants identifying as female had a marginally greater acceptance rate (56.7%) compared to males (54.1%).
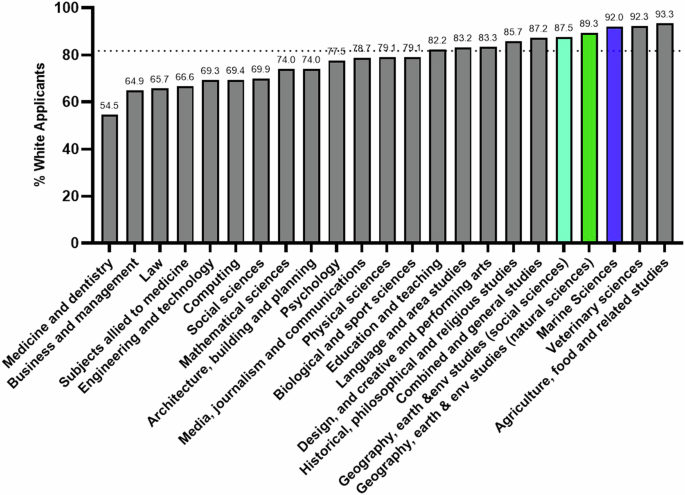
The numbers of applications from ethnic minority groups were one of the lowest of any STEM or non-STEM degree making up just 8% of the marine science applications (Fig. 1) which is not representative of the ethnic minority population of England and Wales (18%). The course with the most ethnic minority students is medicine in the UK with 54.5% of the students identifying as white, and the least diverse are Veterinary Sciences (92.3% white) and Agriculture, Food and Related studies (93.3% white).

Dotted line represents mean value for England and Wales.
UCAS combines Geography, Earth and Environmental Sciences for its statistics but split these two groups into social and natural science-oriented degrees. These degrees do better in terms of ethnic diversity than marine sciences with 87.5% and 89.3% applications from students classifying themselves as white, respectively. Applying both Shannon and Simpson’s diversity indices to the ethnic minority data results in marine sciences degrees being ranked the least diverse (Fig. 2).

Diversity indices are represented by red (Shannon) and black (Simpsons) bars.
An analysis of individual marine science (n = 88) and environmental sciences courses (n = 180) found that 56% and 67% of them were 100% white, respectively. However, this number should be taken with care due to the data protection controls in place from UCAS, which means that courses with 1–3 students would have been classed as zero and so could have biased these results negatively.
Mapping applications of students by the colleges/schools they studied at prior to choosing marine and environmental sciences at university reveals unique clusters of interest (Fig. 3; Suppl Fig. 1). These data provide more insight into the true lack of diversity in the applications from ethnic minority groups as areas where no applications are sent are not included in the dataset and thus represent true zeros. These are represented by grey on the maps. Those areas which receive 1–3 applications are under data protection controls and are included in the lowest banding of the colour scale. Figure 3b, c demonstrate the patterns in the applications from students identifying as from Asian and Black ethnic groups, relative to Asian and Black population within those applicant areas. Mapping the diversity of white and grouped ethnic minority students recruited geographically by their universities revealed that there are clusters of ethnic minority students around cities of greater ethnic minority diversity (e.g., London) (Fig. 4). However, HE institutions offering marine sciences were likely to be coastal in areas of lower ethnic diversity (Supplementary Fig. 2).

Left, centre and right panels represent White, Asian and Black applicants with colours ranging from no (grey), low (yellow) through to red (higher) proportions of applicants per 1000.

Data represented by pie charts in which the size of the pie reflects of the aggregate size of the student cohort on marine and/or environmental courses split between white students (yellow) and ethnic minority students (red).
Examination of the POLAR4 classifications for applicants reveals that the largest proportion of those identifying as white, Asian and mixed ethnicity are within quantile number 5, which are areas considered the most advantaged in terms of higher education engagement (Table 1). Conversely, the greatest proportion of those identifying as black come from areas classified as POLAR4 quintile no.4.
We had 45 respondents to our marine science course and module leaders survey. Of those that responded, 23 identified themselves as male and 22 as female. Forty of these respondents (89%) identified themselves as white, and 5 (11%) as non-white (mixed, Indian or ‘other’). Forty-three responded to the question about their current or former role in higher education, in which 21 (49%) identified themselves as current or former course leaders of marine sciences degrees and 22 (51%) identified as being current or former module leaders. The largest response was from academics in the southeast of England (27%), but we also received responses from Wales, Scotland, Northern Ireland, South West England, London, and North East England.
Our survey of course/module leaders determined that 86% agreed there is a problem recruiting ethnic minority students, with the overwhelming majority stating that they felt that this issue with recruitment subsequently impacted diversity in marine/environmental science careers (Fig. 5). Course leaders (83%) felt that universities could be doing more to attract ethnic minority students with 60% responding that it was also their role to support that process. An overwhelming majority (91%) of course/module leaders felt that natural history programming has an important role to play in recruitment within the marine sciences and 71% believed that role models from ethnic minority backgrounds were currently underrepresented.
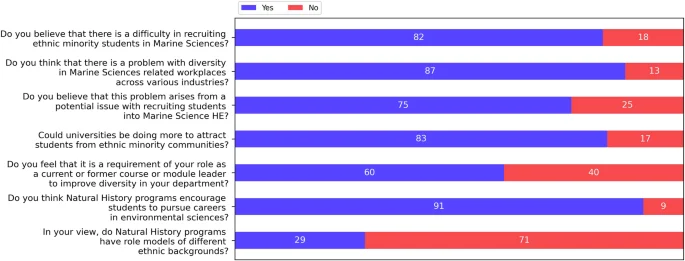
Proportions (%) of those which answered yes or no are represented by blue and red bars, respectively.
Discussion
This study has highlighted that environmental, and specifically marine sciences, are some of the least ethnically diverse degrees in the United Kingdom. Many courses have no ethnic minority representation, although this is difficult to prove conclusively due to data protection controls. This means that we are not providing opportunities and potentially not attracting the best talent to address national and global challenges in marine and environmental sciences. Environmental Sciences professions of the some of the least ethnically diverse in the UK8,9,18,19. This lack of diversity that we spotlight in Higher Education inevitably causes issues in the career pipeline for recruiters, and explains the low diversity observed in the environment jobs across public and private sectors.
The population of England and Wales is 81.7% white with 96% identifying as white in Scotland and 96.6% in Northern Ireland20. Marine Sciences degrees are largely made up of Marine Biology students, however the scope of marine sciences can cover biology, chemistry and physics, all of which require high standards of mathematics, language and computational skills. Biological sciences degrees overall have the proportion of ethnic minority students similar to that of the national population. Veterinary and Agricultural studies (92–93% white) have typically been labelled the least diverse degrees in the UK, however when marine science degrees are disentangled from those within Biological and Environmental Sciences, it highlights that these degrees are made up of 92% white students. Ethnicity studies have applied diversity indices (e.g., Index of Pluralism) to highlight the lack of diversity in environmental careers8. These diversity indices are similar to those applied and well-known in ecology. When applied to the overall ethnic diversity data and thus result in marine science degrees ranked the least diverse degrees.
Focusing specifically on the marine sciences, our survey of marine science course and module leaders within the UK Higher Education sector highlighted that they are aware of the problem in recruitment, and the implication that this has for diversity within the careers sector. Over 80% of course/module leaders feel that universities could be doing more to attract ethnic minority students. Interestingly, only 60% of these course/module leaders felt that it was their role to help drive better diversity within their departments. Free text comments highlighted that approximately a third of course leaders were unsure or did not know why recruitment was so bad for this subject area, with others speculating that it could be down to perceived job prospects and/or salaries, socioeconomics, lack of role models both in the media and within academia, and a lack of targeted marketing and information in schools (Supplementary Table 4). Interestingly, the greatest proportion of applicants for both environmental and marine sciences of all ethnic groups (White, Asian and Mixed) apart from those identifying as Black, come from areas around the UK with the greatest POLAR4 5th quintile, and thus are the most advantaged in terms of people entering higher education. This indicates that much more needs to be done to promote marine and environmental sciences not only to those from ethnic minority groups, but to all ethnic groups from less affluent areas. This is particularly the case for applicants who have been identified as living in areas that require an increase in widening participation in higher education.
When asked what could be done to tackle the low take-up of marine science courses, course/module leaders suggested that there is a need for better information at an early age on career opportunities for marine scientists (Supplementary Table 5). They speculated that this information needs to be disseminated not only to school children but also to their parents/carers and careers advisers. An early report into ethnicity within the UK observed that ethnic minority students were proportionally more likely to take part in HE18. However, it was noted that while a range of factors impact HE entry, the perceived value and potential benefits of higher qualifications are more significant positive ‘drivers’ for minority ethnic students than for White counterparts18. This is especially the case for most British Asian student groups21. This report further highlighted that this difference in the perception of the value of degrees amongst different ethnicities also combines with greater parental and family influence, with some families taking a significant role not only in encouraging HE participation but also in choices of what and where to study in HE. These factors may well play into the lack of take up of environmental and marine science degrees as salaries for those working in environmental related jobs (particularly in conservation) are traditionally poor21,22.
Some course leaders highlighted the potential of geographical influence, with greater ethnic diversity found within inner city locations where students are not in close physical proximity to the marine environment, which can provide inspiration and desire to apply to marine science courses. Marine Science HE providers are also more likely to be in coastal locations which are typically areas of low ethnic diversity compared to larger cities within the UK (Supplementary Fig 1). Studies in the UK have demonstrated that increased fees and cost of living for university students mean that students are staying closer to home23. Furthermore, ethnic minority students are less likely compared to white students to travel further from their parental homes for a variety of reasons23. For example, studies of ethnic minority school leavers have highlighted the importance of staying in areas of high ethnic diversity where they are perceived to be more welcome and less likely to receive racial discrimination23. Therefore, low take up of marine sciences might be exacerbated by HE providers of these courses typically being in coastal areas with low ethnic diversity. Faith and some religious beliefs have been identified as factors which prevent some students from taking student loans23, and these beliefs may also play into a need to stay close to parental homes.
Course/module leaders highlighted that they felt natural history programming has an important role to play in attracting students to these professions, but also felt that natural history programs lacked role models from ethnic backgrounds. Reports into ethnic minorities presenting on the BBC were found to be proportionally are not too dissimilar from the overall population although a detailed analysis of natural history programming was not conducted24. The impact of role models both as teachers and through the media can have profound effects on encouraging ethnic minority groups25,26. Like many STEM subjects, the ethnicity of the educators in Marine Science is likely to reflect the low diversity of graduates entering the HE pipeline plus any barriers to permanent positions in HE. Increasing diversity in academia not only benefits HE institutions27, but also has wide-reaching societal advantages15,28,29. For example, diverse teams have been proven to be better at decision making28. It is now well established that EDI helps benefit industry by boosting creativity and innovation30. Despite these quantifiable benefits, there is still a lack of initiative to take concrete action.
As proven by research over the past decade, the issue of diversity and inclusion in STEM cannot be solved without addressing it at the root cause31. Parents have to be educated on the possible career paths that an education in the Sciences can offer their children31. Children from the age of 10 start identifying as “non-STEM”32. In some cases, this identification appears to come from teachers’ lack of confidence in teaching a science subject. Therefore, there could be a need to promote environmental and marine sciences within early years teaching. The difficulty for the marine sector lies in communicating the role of marine scientists when their roles can be so diverse within government agencies, non-government organisations, and academia through to the private sector. Marine scientists can be communicators, educators, laboratory and field scientists, regulators, media specialists, technologists and engineers through to policy and sustainability experts. Therefore, selling a specific role becomes tricky when the focus might be on the clear vocational path. Universities have to ensure that young undergraduate students have role models whom they can approach for advice33,34. All of which can be applied to marine sciences.
Several recent studies have set out frameworks to improve and advance wider aspects of social equity and justice in marine/ocean sciences35,36,37,38,39. For example, Bennet et al.35 presented a framework for advancing social equality in and through marine conservation. In doing so, they have proposed various organisational roles in advancing social equity in marine conservation. Their review highlights four interventions to equity in marine conservation (recognitional, procedural, distributional and contextual equity). Similarly, de Vos et al.36 in their review of equity and justice in ocean sciences highlight a need to (1) reshape education, perceptions, attitudes and working environments; (2) rebalance partnerships and collaborations; (3) remove barriers to equitable science and publication; (4) strengthening both human and infrastructure capacity plus (5) better networking and public engagement. With our focus primarily on addressing the low numbers of marine science graduate applications. We propose a brief action plan, which we hope may help to address some of the issues highlighted in this work.
-
1.
Include natural sciences which incorporate environmental and marine sciences into the national curriculum at primary school level in the UK.
-
2.
Increase careers information at the school level, particularly in areas of the UK with students who are underrepresented in Marine Science.
-
3.
Increase access to Marine Science HE education with the help of grants, scholarships, and apprenticeships.
-
4.
Educate the general public on the careers that are available to Marine Scientists.
-
5.
Emphasise that the jobs available could result in financial security, although more work needs to be done to prevent exploitative practices with voluntary work with can exacerbate social inequality36,39.
-
6.
Ensure that there are diverse role models present at the university level.
-
7.
Advocate for increased diversity in natural history programmes.
-
8.
Incorporate marine sciences into our STEM and widening participation programs with universities.
-
9.
Review university online and printed course materials to assess their language and visual presentation for diversity, equality and inclusiveness
-
10.
Encourage our universities to provide EDI training specific for marketing and recruitment.
-
11.
Explore the use of university incentive schemes to increase ethnic minority representation
Conclusion
In this paper, we highlight that marine science degrees, and to a lesser extent, environmental sciences degrees are some of the least ethnically diverse degrees in the UK. Currently, it is difficult to put these results for marine and environmental in a global perspective with so few countries having conducted similar reviews. However, proactive approaches to addressing wider equality, diversity and inclusion do exist35,36,37. Our results align with the lack of diversity observed in the environmental sector, and they may indicate a potential issue in meeting ethnic diversity targets within organisations (as reported by refs. 6,8). The full story behind this low recruitment is likely multifactorial and more complex than our dataset allows us to investigate. An important finding of this study is the lower acceptance rate of Asian students into environmental science degrees when compared to other ethnicities. This worrying observations calls for further investigation. The patterns of diversity were to a certain extent reflective of the diversity of the areas from which students went to school/college. University staff teaching these courses appeared to be aware of the issues and felt their universities could be doing more to attract ethnic minority students. We have developed an action plan which we hope might redress some of the issues highlighted from this research.
Methods
Applicant data was obtained for all marine and environmental science courses in the UK between the years 2019–2021 from the UK College and Academic Admissions service (UCAS) using the search terms ‘Environmental’ and ‘Science’ or ‘Marine’ and ‘Biology’ or ‘Ocean’ and ‘Science’ or ‘Oceanography’. The data requested contained applications and their success by university, course, application area postcode, gender, ethnicity, and Participation of Local Areas (POLAR4) quintile classifications. UCAS allows applicants to self-report ethnicity which is recorded at a summary and more detailed level. The higher (summary) level grouping of ethnic origin as declared by the applicant are: White, Black, Asian, Mixed, Other or Unknown. The Low level (detailed) grouping of ethnic origin as declared by the applicant are: White, Black – Caribbean, Black – African, Black – Other Black background, Asian – Indian, Asian – Pakistani, Asian – Bangladeshi, Asian – Chinese, Asian – Other Asian background, Mixed – White and Black Caribbean, Mixed – White and Black African, Mixed – White and Asian, Mixed – Other mixed background, Other or Unknown. POLAR4 quintile groups classify small areas by postcode across the UK into five groups according to their level of youth participation in Higher Education. Each of these 5 groups represents around 20% of young people and is ranked from Quintile 1 (areas with the lowest young participation rates, considered as the most disadvantaged) to Quintile 5 (highest young participation rates, considered most advantaged). Data collected in the UK under the national census and by the Higher Education Standards Authority is based on self-disclosed ethnicity and not race. There are overlaps in the terminology between race and ethnicity however, the terminology is used differently between countries. For this manuscript, we use the UK Law Society definitions (https://www.lawsociety.org.uk/topics/ethnic-minority-lawyers/a-guide-to-race-and-ethnicity-terminology-and-language) where ethnicity as broader than race “has usually been used to refer to long shared cultural experiences, religious practices, traditions, ancestry, language, dialect or national origins”.
UCAS uses data protection measures so that individuals cannot be identified through low numbers. Therefore, those with 1–3 applications are recorded as zero and 4–5 applications are recorded as 5, meaning that courses with very low numbers of ethnic minority students are inflated downwards. Due to the nature of the dataset, this means that overall data is more accurate and less likely to be biased than when data is split up into university or individual degree courses. Therefore, areas of the UK or particular courses with no applications have no data recorded.
Data mapping
To map the total number applicants of each ethnic group relative to total of the group’s population for each Parliamentary constituency, the number of applicants of each ethnic group, as a 3-yr (2019–2021) average, in each Parliamentary Constituency was paired with the corresponding ethnic group population and then joined to the UK Parliamentary Constituency polygons for GB and NI40,41. The tabular data was joined to the spatial data and mapped using ArcGIS Pro v 3.1. Prior to combining with the other datasets, the UCAS files had been processed into a table structure matching the Census 2011 and OS/OSNI data, using a Python script run in Esri’s Jupyter Notebook environment.
To map the total number of applicants to marine science and/or environment courses, the total number of applicants to each course at each university was paired to the corresponding point location (see Supplementary Table 1) modified from Higher Education (HE) and Further Education (FE) locations42. The tabular data was joined to the spatial data and mapped using ArcGIS Pro v 3.1. Prior to combining with the other datasets, the UCAS files had been processed into a table structure matching the UK higher education authority location data, using a Python script run in Esri’s Jupyter notebook environment.
Data analysis
Chi-square analysis (Microsoft Excel) was used to calculate the success rates of applicants for marine and environmental courses, and to see whether significant differences in acceptance rates existed between ethnic minority groups and white applicants. There is considerable debate over the best indices to use in social science regarding ethnic and cultural diversity data43. Many of these indices originate from fragmentation index, which stems from early diversity indices used in ecology44,45. Data on the diversity of applicants on particular courses was calculated using Shannon and Simpsons indices46 whereby species is substituted of ethnic grouping. These two indices differ in that the Shannon index gives more weighting to the richness component and rare cover types, whilst the Simpson index lays greater weighting on the evenness component47.
Shannon index H’ is the species diversity index, where p is the proportion of individuals of each species [ethnic group] in a community of individuals (i.e., n/N)
Simpson’s Index (D) measures the probability that two individuals randomly selected from a sample will belong to the same species (or some category other than species). There are two versions of the formula for calculating D.
Course leader survey
A database of course/module leaders was compiled, and these course/module leaders were surveyed in order to identify their perceptions of low diversity within the marine sciences. Respondents were asked to identify their sex, gender, and geographical location within the UK and to then answer 7 yes/no questions on ethnicity in higher education, the impact of role models, and what got them interested in marine sciences. Respondents were given the opportunity to elaborate on some answers with free text sections on why (if they had previously answered yes) they thought recruitment was low for ethnic minority students; and what (if anything) they would like their HE institutions to do to improve the recruitment; and what (if any) training they had been offered in Equality, Diversity and Inclusiveness (EDI). Free text comments were collated using NVivo Software (v20) into common categories for quantification.
Reporting summary
Further information on research design is available in the Nature Portfolio Reporting Summary linked to this article.
Data availability
Data supporting this study are openly available from UK College and Academic Admissions Service (UCAS; www.ucas.com) on request under the Freedom of Information (FOI) Act and from the Office of National Statistics (ONS, https://www.ons.gov.uk). Ethic minority classifications from the Higher Education Standards Authority (HESA) can be found at https://www.hesa.ac.uk/collection/student/datafutures/a/student_ethnic.
The datasets are generated by the responses to the survey to course/module leaders is available on request from contact author. Maps throughout this paper were created using ArcGIS Pro software by Esri. Copyright © Esri. All rights reserved.
References
-
Steffen, W. et al. Planetary boundaries: guiding human development on a changing planet. Science 347, 1259855 (2015).
Google Scholar
-
Almroth, B. C. et al. Understanding and addressing the planetary crisis of chemicals and plastics. One Earth 5, 1070–1074 (2022).
Google Scholar
-
Hellweg, S., Benetto, E., Huijbregts, M. A., Verones, F. & Wood, R. Life-cycle assessment to guide solutions for the triple planetary crisis. Nat. Rev. Earth Environ. 4, 471–486 (2023).
-
Lerner, H. & Berg, C. The concept of health in One Health and some practical implications for research and education: what is One Health? Infect. Ecol. Epidemiol. 5, 25300 (2015).
-
Royal Society. A state of nation report 2008: Science and mathematics education, 14–19. London: Royal Society (2008).
-
Joice, W. & Tetlow, A. Baselines for improving STEM participation: Ethnicity STEM data for students and academic staff in higher education 2007/08 to 2018/19. R. Soc. https://royalsociety.org/topics-policy/publications/2021/trends-ethnic-minorities-stem/ (2020).
-
Gibney, E. How UK science is failing Black researchers-in nine stark charts. Nature 612, 390–395 (2022).
Google Scholar
-
SOS. Racial diversity in environment professions: 2022. Students Organising for Sustainability United Kingdom. Pp 41. https://www.sos-uk.org/research/racial-diversity-in-environment-professions (2022).
-
Norrie The two sides of diversity: Which are the most ethnically diverse occupations? The Policy Exchange. Pp 25. https://policyexchange.org.uk/publication/the-two-sides-of-diversity/ (2017).
-
RSC Missing Elements: Racial and ethnic inequalities in the chemical sciences. Royal Society of Chemistry. Pp 59. https://www.rsc.org/policy-evidence-campaigns/inclusion-diversity/surveys-reports-campaigns/racial-and-ethnic-inequalities-in-the-chemical-sciences/ (2022).
-
Kamerlin, S. C. When we increase diversity in academia, we all win. EMBO Reports, 21. https://doi.org/10.15252/embr.202051994 (2020).
-
Adams, J. The forth age of research. Nature 497, 557–560 (2013).
Google Scholar
-
Freeman, R. B. & Huang, W. Collaboration: strength in diversity. Nature 513, 305–305 (2014).
Google Scholar
-
Visbeck, M. (2018, February 15). Ocean science research is key for A sustainable future. Nature News. Retrieved September 30, 2022, from https://www.nature.com/articles/s41467-018-03158-3.
-
Gates, A. E., McNeal, K., Riggs, E., Sullivan, S. & Dalbotten, D. New developments in diversity and inclusiveness in geosciences. J. Geosci. Educ. 67, 285–286 (2019).
Google Scholar
-
Scott Price, O. et al. Same program different delivery: adapting the woods hole partnership education program for a virtual era. Limnol. Oceanogr. Bull. 29, 117–124 (2020).
Google Scholar
-
Bernard, R. E. & Cooperdock, E. H. No progress on diversity in 40 years. Nat. Geosci. 11, 292–295 (2018).
Google Scholar
-
Connor, H., Tyers, C., Modood, T. & Hillage, J. Why the difference? A closer look at higher education minority ethnic students and graduates. Inst. Employment Stud. Res. Rep. 552, 1–192 (2004).
-
IES A challenging environment: Experiences of ethnic minority environmental professionals. Institute of Environmental Sciences report pp 44. https://www.the-ies.org/resources/challenging-environment (2021).
-
Office for National Statistics. 2021 UK census. https://www.ons.gov.uk/census (2021).
-
CIEEM (2022). Ecology and Environmental Management Employment and Salary Survey 2022. The Chartered Institute of Ecology and Environmental Management. pp 20.
-
Osiecka, A. N., Quer, S., Wróbel, A. and Osiecka-Brzeska, K., 2021. Unpaid work in marine science: a snapshot of the early-career job market. Frontiers in Marine Science, p.1143.
-
Donnelly, M. and Gamsu, S., 2018. HOME AND AWAY: social, ethnic and spatial inequalities in student mobility. https://www.suttontrust.com/wp-content/uploads/2019/12/Home_and_away_FINAL.pdf.
-
Cumberbatch, G., Bailey, A., Lyne, V., Gauntlett, S. On-screen diversity monitoring: BBC One and BBC Two 2018. https://www.ofcom.org.uk/__data/assets/pdf_file/0019/124255/bbc1-bbc2-diversity-monitoring.pdf (2018).
-
Egalite, A. J. & Kisida, B. The effects of teacher match on students’ academic perceptions and attitudes. Educ. Eval. Policy Anal. 40, 59–81 (2018).
Google Scholar
-
Hamlen, K. R. & Imbesi, K. J. Role models in the media: a content analysis of preschool television programs in the US. J. Children Media 14, 302–323 (2020).
Google Scholar
-
Powell, K. These labs are remarkably diverse — here’s why they’re winning at science. Nature 558, 19–22 (2020).
Google Scholar
-
WSU Online MBA. (2021, January 14). 10 benefits of diversity in the workplace. Retrieved September 30, 2022, from https://onlinemba.wsu.edu/blog/10-benefits-of-diversity-in-the-workplace.
-
Hunt, D.V., Layton, D., & Prince, S. (2021, March 12). Why diversity matters. McKinsey & Company. Retrieved September 30, 2022, from https://www.mckinsey.com/capabilities/people-and-organizational-performance/our-insights/why-diversity-matters.
-
Stahl, A. (2021, December 21). 3 benefits of diversity in the workplace. Forbes. Retrieved September 30, 2022, from https://www.forbes.com/sites/ashleystahl/2021/12/17/3-benefits-of-diversity-in-the-workplace/?sh=4f41f1b322ed.
-
Moore, C., Davies, N., & Vergou, A. (2022, January 25). Science education. Wellcome Trust. Retrieved September 30, 2022, from https://wellcome.org/what-we-do/our-work/improving-science-education.
-
Macdonald, A. “Not for people like me?” Under-represented groups in science, technology and engineering. Wise Campaign (2014).
-
Wong, B., Elmorally, R. & Copsey-Blake, M. fair and square’: What do students think about the ethnicity degree awarding gap? J. Further Higher Educ. 45, 1147–1161 (2021).
Google Scholar
-
Wong, B., Elmorally, R., Copsey-Blake, M., Highwood, E. & Singarayer, J. Is race still relevant? student perceptions and experiences of racism in Higher Education. Cambridge J. Educ. 51, 359–375 (2020).
Google Scholar
-
Bennett, N. J. et al. Advancing social equity in and through marine conservation. Front. Mar. Sci. 8, 711538 (2021).
Google Scholar
-
de Vos, A. et al. Towards equity and justice in ocean sciences. npj Ocean Sustain. 2, 25 (2023).
Google Scholar
-
Bennett, N. J. Mainstreaming equity and justice in the ocean. Front. Mar. Sci. 9, 873572 (2022).
Google Scholar
-
Alexander, K. A. et al. Equity of our future oceans: practices and outcomes in marine science research. Rev. Fish Biol. Fish. 32, 297–311 (2022).
Google Scholar
-
Osiecka, A. N., Quer, S., Wróbel, A. & Osiecka-Brzeska, K. Unpaid work in marine science: a snapshot of the early-career job market. Front. Mar. Sci. 8, 690163 (2021).
Google Scholar
-
OS (2022) OS Boundary – Line [SHAPE geospatial data], Scale: 1:1000, Updated: May 2022, Ordnance Survey, Using EDINA Digimap Ordnance Survey Service, https://digimap.edina.ac.uk, Downloaded: 2022-06-23.
-
OSNI (2018) OSNI Largescale Boundaries [SHAPE geospatial data], Scale 1:10000, Updated: 30 April 2018, Ordnance Survey Northern Ireland, Using: EDINA Digimap Ordnance Survey Service, https://digimap.edina.ac.uk, Downloaded: 2022-06-23.
-
Pope, A. UK Universities and Colleges, [Dataset]. University of Edinburgh. https://doi.org/10.7488/ds/1804 (2017).
-
Németh, Á., Sümeghy, D., Trócsányi, A. & Pirisi, G. Competing diversity indices and attitudes toward cultural pluralism in Europe. Equal. Divers. Inclusion: Int. J. 41, 1029–1046 (2022).
-
Shannon, C. E. A mathematical theory of communication. Bell Syst. Tech. J. 27, 379–423 (1948).
Google Scholar
-
Simpson, E. H. Measurement of diversity. Nature 163, 688 (1949).
Google Scholar
-
Roswell, M., Dushoff, J. & Winfree, R. A conceptual guide to measuring species diversity. Oikos 130, 321–338 (2021).
Google Scholar
-
Nagendra, H. Opposite trends in response for the Shannon and Simpson indices of landscape diversity. Appl. Geogr. 22, 175–186 (2002).
Google Scholar
Acknowledgements
This work was supported by the Natural Environment Research Council (NERC) programme entitled “Diversity, equity and inclusion research in environmental science” awarded to ATF & SR. The project was called REDRESS: Improving diversity and inclusiveness in the UK marine sciences which had ethical approval from the University of Portsmouth (Ethics – SHFEC 2022 – 033 FORD). The authors acknowledge the use of UK College and Academic Admissions Service (UCAS) and the Office of National Statistics (ONS) data. We thank the anonymous reviewers for their constructive comments which have improved the manuscript.
Author information
Authors and Affiliations
Contributions
A.F. was responsible for the following: study conception and design, data collection, analysis and interpretation of results, and manuscript preparation. A.S., S.R., and N.B.J. were responsible for data collection, analysis and interpretation of results, and manuscript preparation.
Corresponding author
Ethics declarations
Competing interests
All authors declare no competing interests.
Peer review
Peer review information
Communications Earth & Environment thanks the anonymous reviewers for their contribution to the peer review of this work. Primary Handling Editors: Martina Grecequet, Heike Langenberg. A peer review file is available.
Additional information
Publisher’s note Springer Nature remains neutral with regard to jurisdictional claims in published maps and institutional affiliations.
Supplementary information
Transparent Peer Review file
Supplementary Information
Reporting Summary
Rights and permissions
Open Access This article is licensed under a Creative Commons Attribution-NonCommercial-NoDerivatives 4.0 International License, which permits any non-commercial use, sharing, distribution and reproduction in any medium or format, as long as you give appropriate credit to the original author(s) and the source, provide a link to the Creative Commons licence, and indicate if you modified the licensed material. You do not have permission under this licence to share adapted material derived from this article or parts of it. The images or other third party material in this article are included in the article’s Creative Commons licence, unless indicated otherwise in a credit line to the material. If material is not included in the article’s Creative Commons licence and your intended use is not permitted by statutory regulation or exceeds the permitted use, you will need to obtain permission directly from the copyright holder. To view a copy of this licence, visit http://creativecommons.org/licenses/by-nc-nd/4.0/.
Reprints and permissions
About this article
Cite this article
Ford, A.T., Shankar, A., Reynolds, S. et al. Low ethnic diversity among university applicants in marine and environmental science in the United Kingdom.
Commun Earth Environ 5, 425 (2024). https://doi.org/10.1038/s43247-024-01579-1
-
Received: 06 October 2023
-
Accepted: 23 July 2024
-
Published: 12 August 2024
-
DOI: https://doi.org/10.1038/s43247-024-01579-1
Comments
By submitting a comment you agree to abide by our Terms and Community Guidelines. If you find something abusive or that does not comply with our terms or guidelines please flag it as inappropriate.