Abstract
Vitamin B12 is an essential nutritional co-factor for the folate and methionine cycles, which together constitute one-carbon metabolism. Here, we show that dietary uptake of vitamin B12 modulates cell fate decisions controlled by the conserved RAS/MAPK signaling pathway in C. elegans. A bacterial diet rich in vitamin B12 increases vulval induction, germ cell apoptosis and oocyte differentiation. These effects are mediated by different one-carbon metabolites in a tissue-specific manner. Vitamin B12 enhances via the choline/phosphatidylcholine metabolism vulval induction by down-regulating fat biosynthesis genes and increasing H3K4 tri-methylation, which results in increased expression of RAS/MAPK target genes. Furthermore, the nucleoside metabolism and H3K4 tri-methylation positively regulate germ cell apoptosis and oocyte production. Using mammalian cells carrying different activated KRAS and BRAF alleles, we show that the effects of methionine on RAS/MAPK-regulated phenotype are conserved in mammals. Our findings suggest that the vitamin B12-dependent one-carbon metabolism is a limiting factor for diverse RAS/MAPK-induced cellular responses.
Introduction
The cell metabolism regulates physiological processes and cancer cell growth by controlling catabolic and anabolic reactions and transcriptional activity1. Diet influences metabolism directly and, as a result, cells must constantly adapt to variations in diet. One example is vitamin B12 (cobalamin), an essential micronutrient that requires dietary intake. Vitamin B12 is an important metabolic co-factor in two metabolic pathways, the mitochondrial propionate breakdown pathway and one-carbon metabolism formed by the methionine and folate cycles (Fig. 1a). In the canonical propionate breakdown pathway, vitamin B12 acts as a co-factor for methyl malonyl-CoA mutase (MUT, MMCM-1 in C. elegans)2,3,4, and in the methionine cycle, it serves as a co-factor for methionine synthase (MS, METR-1 in C. elegans) (Fig. 1a)2,3,4.
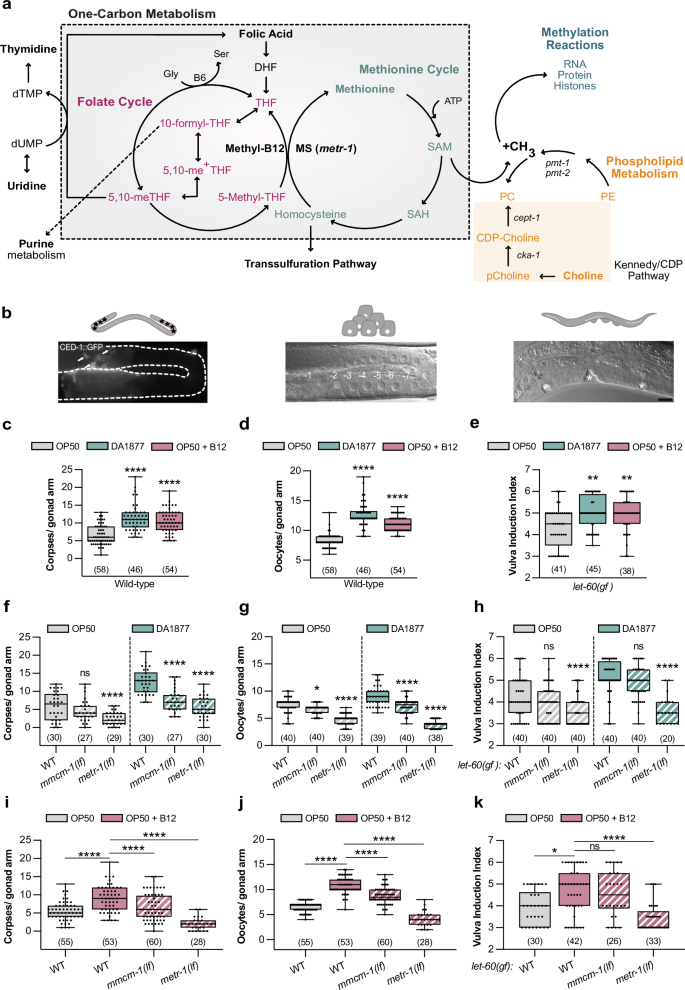
a Schematic representation of one-carbon metabolism. b Illustrations of the observed phenotypes: germ cell apoptosis (corpses), oocyte differentiation, or vulval induction. Scale bar: 10 µm. Number of corpses (c) or oocytes (d) in wild-type animals. e Vulval induction index of let-60(gf) animals. c–e Animals were fed with E. coli OP50 (gray), Comamonas DA1877 (blue), or E. coli OP50 supplemented with 64 nM B12 (pink). Number of corpses (f), oocytes (g) and vulval induction index (h) for indicated genotypes fed either with E. coli OP50 (gray) or Comamonas DA1877 (blue). Number of corpses (i), oocytes (j) and vulval induction index (k) for indicated genotypes fed with E. coli OP50 and supplemented with 64 nM B12. Dots (in c, d, f, g, i, j) represent individual corpses/oocytes or animals (in e, h, k) from two independent biological replicates; number of animals in brackets. Boxplots show 25-75 percentiles and median; whiskers represent min and max values. **P < 0.005, ***P < 0.0005, ****P < 0.0001 using one-way ANOVA followed by Dunnett’s multiple comparison tests in c, d, i and j, two-way ANOVA followed by a Tukey’s multiple comparison test in f, g and h and a Kruskal-Wallis test for non-parametric data followed by a Dunn’s multiple comparison test in e and k. Source data are provided as a Source Data file.
One-carbon metabolism transfers single carbon units necessary for nucleotide biosynthesis through the folate cycle and produces S-adenosyl-methionine (SAM), the main methyl donor in cells. In the methionine cycle, homocysteine is methylated by MS to form methionine, which is then converted into SAM5,6. SAM is required for phosphatidylcholine (PC) synthesis (Fig. 1a)5. PC is a polyunsaturated fatty acid that can be produced via the Kennedy/CDP-choline pathway using choline as a precursor or by the sequential methylation pathway, which depends on SAM-methyl groups (Fig. 1a)7,8. In addition, SAM provides the methyl donors necessary for DNA, RNA, histone and protein methylation. Histone methylation, especially histone H3 tri-methylation at lysine 4 (H3K4me3), which is associated with active transcription at the promoter region, is particularly sensitive to SAM levels9,10.
In this study, we have used the nematode C. elegans to investigate the nutritional impact of a bacterial diet on development. E. coli OP50 is the commonly used bacterial diet, which is low in vitamin B12. Comamonas aquatica DA1877, on the other hand, is a vitamin B12-rich diet3. A Comamonas DA1877 diet affects different aspects of C. elegans behavior by modulating gene expression, reproduction, and longevity11,12. Vitamin B12 metabolism also regulates H3K4 methylation10, affecting C. elegans fertility and lipid accumulation, which is linked to longevity13,14.
Here, we focused on how the vitamin B12-dependent one-carbon metabolism modulates cell fate decisions mediated by the conserved RAS/Mitogen-activated protein kinase (RAS/MAPK) pathway. The RAS/MAPK pathway is highly conserved between C. elegans and mammals, and it is a prevalent oncogenic signaling pathway in humans, being hyper-activated in around one-third of all tumors. Gain-of-function (gf) mutations in RAS genes (mostly in KRAS) occur in 30% of all cancers, and mutations in BRAF (mostly the V600E substitution) are found in 8% of all human cancers15,16. Gain-of-function mutations in let-60, the single C. elegans ras ortholog, hyperactivate RAS/MAPK signaling and cause enhanced germ cell death, oocyte over-production, and excess vulval induction17,18,19.
During larval development, the growth factor LIN-3 (an EGF-like ligand) is secreted by the gonadal anchor cell (AC). LIN-3 activates RAS/MAPK signaling via the LET-23 EGF receptor in the vulval precursor cells (VPCs) to induce their differentiation20,21. P6.p, the VPC closest to the AC, receives the highest concentration of LIN-3 and adopts the primary (1°) vulval cell fate, while P5.p and P7.p receive less LIN-3 signal and adopt the secondary (2°) cell fate in response to a lateral LIN-12 Notch signal. These three induced VPCs then start to proliferate and differentiate into 22 vulval cells forming the vulva20,21.
During adulthood, RAS/MAPK regulates germ cell progression and death in the gonads. Hermaphrodites have two symmetric, U-shaped tubular gonad arms that are connected to a common uterus. In the distal region of each gonad arm, mitotic stem cells constantly proliferate to supply new germ cells. Germ cells in the late pachytene region, near the gonad loop, activate the RAS/MAPK pathway, which is required for the pachytene to diplotene transition, cell membrane integrity, chromosomal synapsis, apoptosis, and oocyte differentiation17,18,22,23. Around half of the germ cells enter the proximal gonad arm and begin to differentiate into oocytes, while the remaining germ cells undergo apoptosis. Germ cell apoptosis is a physiological and stochastic process that eliminates half of all germ cells to maintain gonad homeostasis24,25. Dying germ cells activate the core apoptotic machinery triggering the CED-3 caspase24,25 and are engulfed by the sheath cells of the somatic gonad26.
By examining three RAS/MAPK-mediated phenotypes, vulval development, germ cell death, and oocyte differentiation, we show that the activity of the vitamin B12-dependent one-carbon metabolism is a limiting factor for RAS/MAPK-induced cell fates. Switching animals to a vitamin B12-rich Comamonas DA1877 diet enhances all phenotypes caused by hyperactive RAS/MAPK signaling via the methionine synthetase METR-1. One-carbon metabolism affects the different RAS/MAPK-mediated cell fate decisions through distinct, tissue-specific mechanisms. The folate cycle promotes germ cell differentiation and death through nucleotide biosynthesis, while the methionine cycle affects vulval induction by repressing fatty acid synthesis. In addition, the methionine cycle regulates the PC metabolism and globally increases H3K4me3 levels. Finally, using mammalian cells carrying different activating KRAS alleles, we show that the methionine-dependency of RAS/MAPK-induced phenotypes is conserved.
Results
Dietary vitamin B12 enhances germ cell and vulval development
To investigate how the vitamin B12 metabolism affects RAS/MAPK-controlled cell fate decisions, we fed animals with the Comamonas DA1877 diet, rich in vitamin B12, and quantified germ cell death, oocyte and VPC differentiation (Fig. 1b). Using a CED-1::GFP reporter to label engulfed apoptotic cells27, we found that wild-type worms fed with the Comamonas DA1877 diet or E. coli OP50 supplemented with vitamin B12 had a 2 to 3-fold increase in apoptotic germ cells (Fig. 1c). Although animals fed with the Comamonas DA1877 diet have a smaller brood size11, a B12-rich diet increases the number of oocytes in the proximal arm of one-day-old adults (Fig. 1d).
Since Comamonas DA1877-fed worms reach adulthood on average 12 h earlier (Supplementary Fig. 1a)11, we tested whether these effects were due to changes in developmental timing. Sixty-two hours after L1 arrest, Comamonas DA1877-fed animals were approximately at the same developmental stage as animals fed on E. coli OP50 for 72 h. However, Comamonas DA1877-fed worms had more apoptotic corpses and oocytes than E. coli OP50-fed animals at the matching developmental stages (i.e., 62 h vs. 72 h and 72 h vs. 82 h, Supplementary Fig. 1b, c), suggesting that the Comamonas DA1877 effects are independent of developmental time.
Germ cell apoptosis can either be physiological or a response to DNA damage24,28. To distinguish between these two possibilities, we used cep-1 loss-of-function (lf) mutants, which do not induce DNA damage-induced apoptosis27. The effect of the Comamonas DA1877 diet on germ cell death was still present in cep-1(lf) mutants (Supplementary Fig. 1d). We also examined pch-2(lf) mutants29 to exclude that the enhanced germ cell apoptosis in Comamonas DA1877-fed animals was due to defects in synaptonemal complex assembly (Supplementary Fig. 1e). In both mutant backgrounds fed with the Comamonas DA1877 diet, the levels of germ cell death were only slightly decreased compared to the wild-type, suggesting that the Comamonas DA1877 diet predominantly induces physiological germ cell death and causes only low levels of genotoxic stress. In contrast, a ced-3(lf) mutation completely suppressed the effect of the Comamonas DA1877 diet, indicating that the canonical apoptotic caspase pathway is activated by the diet (Supplementary Fig. 1f).
To study the effect of the Comamonas DA1877 diet on VPC induction during vulval development, we used a let-60 ras gain-of-function mutation (let-60(n1046), abbreviated let-60(gf)), as a sensitized genetic background. let-60(gf) animals grown on E. coli OP50 contained on average 4.3 ± 0.9 (SD) induced VPCs per animal (vulval induction index). let-60(gf) larvae fed with Comamonas DA1877 or supplemented with vitamin B12 showed an increase in vulval induction to 5.0 ± 0.7 and 5.0 ± 0.8, respectively (Fig. 1e). Wild-type larvae always had three induced VPCs irrespective of the bacterial diet.
To test if the effect of the Comamonas DA1877 diet was caused by bacterially produced B12, we used the B12 synthesis-deficient Comamonas DA1877 mutants ∆cbiA/cobB and ∆cbiB3. Germ cell apoptosis in animals fed with Comamonas DA1877 ∆cbiA/cobB or ∆cbiB mutants was comparable to E. coli OP50-fed animals, indicating that the increase in dietary B12 is the main cause for the enhanced apoptosis (Supplementary Fig. 1g). To determine, which metabolic pathway (i.e., the propionate breakdown or one-carbon metabolism) mediates the effects of the Comamonas DA1877 diet or B12 supplementation, we examined metr-1(lf) and mmcm-1(lf) mutants. Both mutations suppressed the effect of the Comamonas DA1877 diet and vitamin B12 on germ cell apoptosis and oocyte differentiation, though the suppression by mmcm-1(lf) was weaker (Fig. 1f, g, i, j). Only metr-1(lf) mutants showed a reduction in VPC induction in animals fed with the Comamonas DA1877 diet or supplemented with vitamin B12 (Fig. 1h, k). To determine if the effects of vitamin B12 on germ cell differentiation are cell-autonomous, we expressed metr-1 and mmcm-1 in the soma using extra-chromosomal arrays, which are silenced in the germline. The somatic expression of metr-1 rescued the reduced vulval induction in let-60(gf) double mutants (Supplementary Fig. 1h), but the somatic expression of metr-1 or mmcm-1 did not affect germ cell death on the Comamonas DA1877 diet (Supplementary Fig. 1i).
Furthermore, we examined duct cell specification during larval development as a fourth phenotype controlled by RAS/MAPK signaling19. Eighty-one percent of let-60(gf) animals fed with E. coli OP50 showed a duplication of the duct cell, whereas 98% of the animals fed with the Comamonas DA1877 diet had two duct cells (Supplementary Fig. 1j, j’).
In conclusion, the vitamin B12-dependent one-carbon metabolism is a major factor in enhancing multiple RAS/MAPK-induced cell fates on the Comamonas DA1877 diet.
Vitamin B12-rich diet accelerates germ cell differentiation
Given that the Comamonas DA1877 diet affected both germ cell death and oocyte differentiation, we tried to decouple the two phenotypes. Using apoptosis-deficient ced-3(lf) mutants, we found that the increase in oocyte number in Comamonas DA1877-fed worms was independent of apoptosis (Fig. 2a). However, we were not able to determine if the reverse was also true.
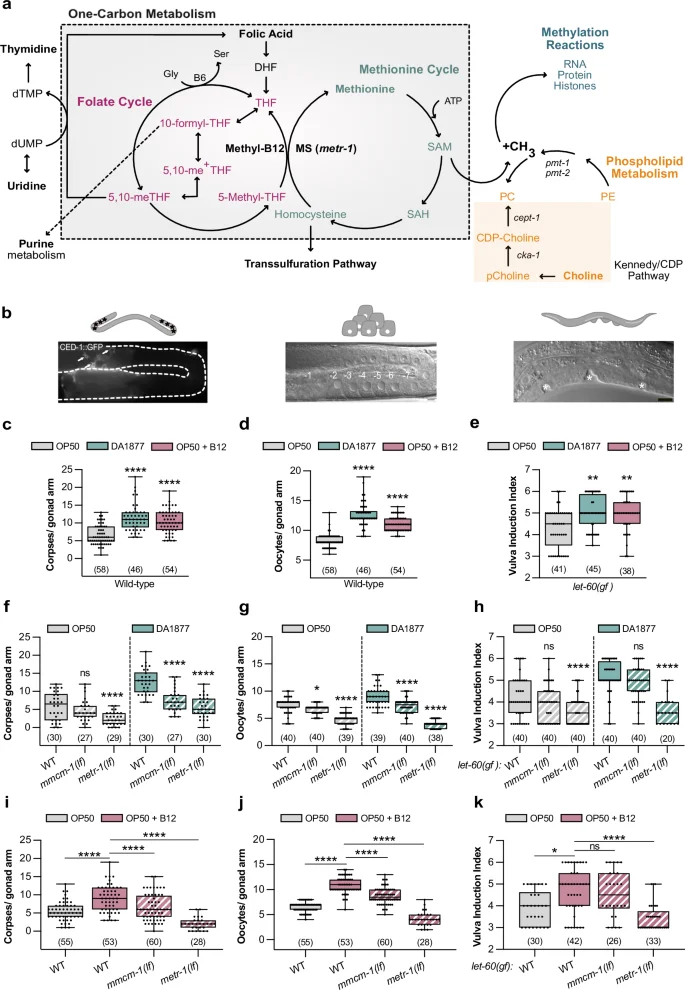
a Oocyte number for indicated genotypes. Dots represent individual oocytes. b Mitotic index for indicated genotypes. Dots represent individual animals. c Fluorescence images showing the pachytene-to-diplotene (P-D) transition (yellow dashed lines) for indicated genotypes; germ cell nuclei are marked with H2B::GFP. Gonads are outlined by white dashed lines. Scale bar: 10 µm. d Number of cells inside an area starting from the P-D and ending 15 cell-rows distally of indicated genotypes; P-D was determined based on the nuclear marker shown in c; in let-60(gf) animals the loop region was used as the starting point. e Length of 15-cell rows for indicated genotypes. f Distance from the P-D to the loop region for indicated genotypes. d–f dots represent individual animals. g Speed of germ cell progression through the pachytene region for indicated genotypes; for individual tracking see Supplementary Fig. 2. Dots represent the speed of individual cells. h Ovulation time for indicated genotypes. Dots represent individual oocytes. Bars represent mean ± SD. a–h Animals were fed with E. coli OP50 (gray) or Comamonas DA1877 (blue). Number of animals in brackets. Boxplots show 25-75 percentiles and median; whiskers represent min and max values. ****P < 0.0001 using two-way ANOVA followed by uncorrected Fisher’s LSD multiple comparison test in a, one-way ANOVA followed by Dunnett’s multiple comparison tests in b, d–h. Source data are provided as a Source Data file.
The mitotic proliferation of germline stem cells in the distal gonad region depends on RAS/MAPK signaling in the soma30. We, therefore, tested if the Comamonas DA1877 diet up-regulates germ cell proliferation, which would increase germ cell number and potentially apoptosis. The mitotic index (i.e., the fraction of M-phase germ cells in the mitotic region) in adult animals was not changed by the DA1877 diet, by somatic hyper-activation of RAS/MAPK, or by loss of metr-1 (Fig. 2b). However, Comamonas DA1877-fed worms contained a longer mitotic zone with more mitotic cells and an increased absolute number of cells in M-phase (Supplementary Fig. 2a), which is consistent with the overall increase in gonad size observed in Comamonas DA1877-fed animals. By contrast, let-60(gf) and metr-1(lf) mutants contained a shorter mitotic zone (Supplementary Fig. 2a). This suggests that the Comamonas DA1877 diet may affect the germline by expanding the pool of mitotic cells earlier during larval development without increasing the mitotic rate during adulthood. Thus, accelerated germ cell proliferation is unlikely to be responsible for the Comamonas DA1877-induced increase in apoptotic corpse and oocyte numbers.
We next focused on the pachytene region, where RAS/MAPK activation regulates both germ cell apoptosis and pachytene exit17,18,24. We used an H2B::GFP marker to label the germ cell nuclei and determine the border between the pachytene and diplotene zones (P-D) (Fig. 2c). We counted the average number of pachytene cells over 15-cell rows distal to the P-D border. Comamonas DA1877-fed animals contained more pachytene germ cells (Fig. 2d), consistent with an enlarged gonad. To hyper-activate RAS/MAPK signaling in the germline, we examined temperature-sensitive let-60(ga89) mutants, abbreviated let-60(gf ts), grown for 4 h at 25 °C31. The let-60(gf ts) and metr-1(lf) mutations did not significantly alter germ cell number (Fig. 2d). Comamonas DA1877-fed worm and let-60(gf ts) mutants also showed an increased density of pachytene cells (i.e., shorter 15-cell rows), but cell density was not changed in metr-1(lf) mutants (Fig. 2e). Thus, neither cell number nor density seems to correlate with germ cell apoptosis or oocyte differentiation. However, Comamonas DA1877-fed worms showed a distal shift of the P-D border before the loop, whereas let-60(gf ts) mutants showed a proximal shift after the loop (Fig. 2c, f).
The distal shift of the P-D border in Comamonas DA1877-fed worms might be due to a change in germline length, a shift of the borders between the different meiotic zones or altered dynamics of the germ cells progressing through the gonads. Immunohistochemical staining of dissected gonads with markers for the different meiotic zones indicated that the boundary between the transition zone and early pachytene was shifted distally in Comamonas DA1877-fed animals (when corrected for different gonad length), but the proximal border of the late pachytene zone was not changed (Supplementary Fig. 2b). By contrast, the nuclear morphology visualized with the H2B::GFP marker pointed to a distal shift of the P-D border (Fig. 2c, f). In agreement with previous results22, let-60(gf ts) worms had a shorter mid-pachytene zone and no change in the proximal border of the late pachytene zone, despite the proximal shift of the P-D border determined with the H2B::GFP marker (Supplementary Fig. 2b and Fig. 2c, f). This suggests that the different meiotic zones determined by molecular markers do not always match the meiotic stage of individual germ cells scored by their nuclear morphology.
We, therefore, hypothesized that the changes in germ cell death and differentiation caused by the Comamonas DA1877 diet or the let-60(gf ts) mutation might be caused by an altered speed at which individual germ cells move through the different meiotic zones. We therefore tracked individual germ cell nuclei progressing from pachytene to diplotene by live imaging31. Germ cells progressed faster through the pachytene region in Comamonas DA1877-fed animals and let-60(gf ts) mutants (Fig. 2g and Supplementary Fig. 3a, b for the individual trackings). Moreover, Comamonas DA1877-fed worms ovulated more frequently (Fig. 2h and Supplementary Fig. 3c for the individual animals), indicating that the higher oocyte number is not due to reduced ovulation.
In summary, the Comamonas DA1877 diet or hyper-activation of the RAS/MAPK pathway resulted in a faster progression of germ cells through pachytene, which could explain the increased number of oocytes in the proximal gonads. Whether the accelerated progression through pachytene might also increase the rate of germ cell apoptosis remains unclear. It seems likely that the combination of the changes in gonad morphology and dynamics caused by the Comamonas DA1877 diet accounts for the increase in germ cell death.
One-carbon metabolism enhances MAPK target gene expression
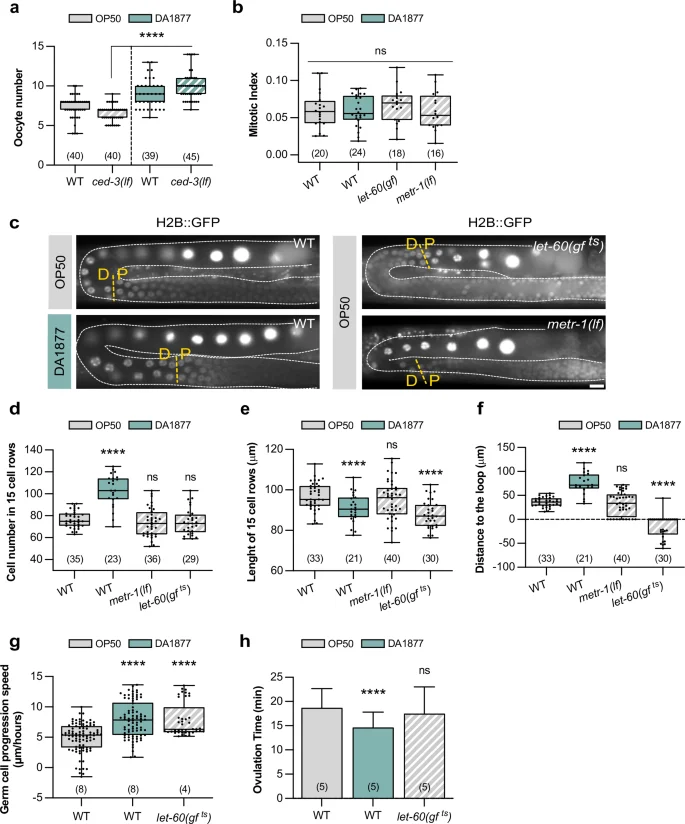
To characterize the interactions between one-carbon metabolism and RAS/MAPK signaling, we combined the metr-1(lf) and let-60(gf) mutations. metr-1(lf) rescued the let-60(gf ts)-dependent increase in germ cell apoptosis and oocyte number in animals fed with E. coli OP50, even in germline-specific metr-1(lf) mutants (Fig. 3a, b and Supplementary Fig. 4a, b). Furthermore, the gonads in let-60(gf ts) animals grown for 18 h at 25 °C shrank, resulting in a reduced rachis diameter18,29, which was suppressed by metr-1(lf) (Fig. 3c). Also, the increased VPC differentiation in let-60(gf) mutants fed with E. coli OP50 was suppressed by metr-1(lf) (Fig. 1h and 3d). Together, these results show that inhibiting the methionine cycle reduces the penetrance of phenotypes caused by RAS/MAPK hyper-activation in different tissues. On the other hand, the Comamonas DA1877 diet enhanced the effects of let-60(gf ts) on germ cell apoptosis and oocyte differentiation (Fig. 3e, f). To further examine the influence of the Comamonas DA1877 diet on RAS/MAPK signaling, we used the temperature-sensitive mpk-1(ga111 ts) allele32, rescued in the soma with an extra-chromosomal mpk-1(+) array to inhibit RAS/MAPK specifically in the germline29. The reduced germ cell apoptosis and oocyte number in germline-specific mpk-1(lf ts) mutants were partially suppressed by the Comamonas DA1877 diet (Fig. 3g, h). This suggested that the RAS/MAPK pathway and the methionine cycle have synergistic effects, or that the methionine cycle performs a limiting function downstream of the RAS/MAPK pathway.
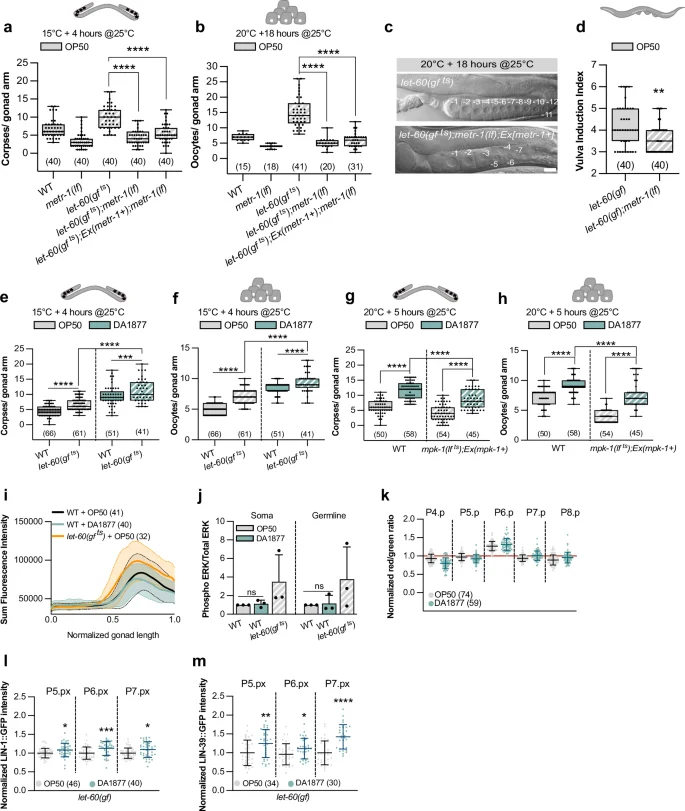
a, b Corpse and oocyte numbers for indicated genotypes grown at 15 °C and transferred to 25 °C 4 h before quantification, or grown at 20 °C and transferred to 25 °C 18 h. c DIC images of gonads of indicated genotypes grown at 20 °C and transferred to 25 °C 18 h before quantification. Numbers indicate mature oocytes. Scale bar: 10 µm. d Vulval induction index for indicated genotypes. a–d Animals were fed with E. coli OP50. e, f Corpse and oocyte numbers for indicated genotypes grown at 15 °C and transferred to 25 °C 4 h before quantification. g, h Corpse and oocyte numbers for indicated genotypes grown at 20 °C and transferred to 25 °C 5 h before quantification. e–h Animals were fed with E. coli OP50 (gray) or Comamonas DA1877 (blue). i dpERK intensity profiles in gonads of wild-type fed with E. coli OP50 (gray) or Comamonas DA1877 (blue), and let-60(gf ts) fed with E. coli OP50 (orange). x-axis represents normalized gonad length. Average intensities ± SD (shaded) are shown. Data from three independent biological replicates. j Western blot quantification of the somatic and germline isoform of dpERK for indicated genotypes. Bars represent mean ± SD normalized to the control (wild-type E. coli OP50) from three independent biological and technical replicates. See Supplementary Fig. 4 for the individual WB. k ERK-nKTR biosensor quantification. Dots represent individual animals from 2 independent biological replicates. Data show median ± min and max. l–m Normalized intensity of LIN-1::GFP or LIN-39::GFP at the Pn.px stage in 1° and 2° VPCs of let-60(gf) animals. Data were normalized to the control (E. coli OP50). Dots represent individual animals from two independent biological replicates. j–m Animals were fed with E. coli OP50 (gray) or Comamonas DA1877 (blue). Number of animals is in brackets. In a–h, j, l, m, boxplots show 25–75 percentiles and median; whiskers represent min and max values. *P < 0.05, **P < 0.005, ***P < 0.0005, ****P < 0.0001 using one-way ANOVA followed by Dunnett’s multiple comparison tests in a and b, a Kruskal-Wallis test for non-parametric data in d, two-way ANOVA followed by a uncorrected Fisher’s LSD multiple comparison tests in e–h and j and unpaired, two-tailed t-tests in l and m. Source data are provided as a Source Data file.
Next, we examined whether the methionine cycle directly regulates RAS/MAPK pathway activity. Neither immunostaining of dissected gonads nor Western blot analysis of total animal extracts with a di-phospho-ERK-specific antibody showed an increase in MAPK phosphorylation in animals fed with the Comamonas DA1877 diet (Fig. 3i, j and Supplementary Fig. 4c for the Western blots used for quantification). Accordingly, metr-1(lf) did not cause a decrease in MAPK phosphorylation (Supplementary Fig. 4d, e). Also, using an ERK biosensor to quantify RAS/MAPK pathway activity in the VPCs33 we observed no significant difference in activity between worms fed with the E. coli OP50 or Comamonas DA1877 diet (Fig. 3k). Together, these results indicate that the Comamonas DA1877 diet does not increase RAS/MAPK pathway activity but rather the cellular responses to MAPK activation.
We thus tested whether the Comamonas DA1877 diet changes the expression of RAS/MAPK signaling target genes during vulval development. We used endogenous GFP reporters for lin-1, which encodes an ETS-family transcription factor phosphorylated by MPK-1, and lin-39, which encodes a hox gene regulated by LIN-134. The Comamonas DA1877 diet increased LIN-1::GFP and LIN-39::GFP expression in the proximal VPCs of let-60(gf) larvae (Fig. 3l, m), but it had no significant effect in wild-type worms (Supplementary Fig. 4f, g).
Thus, the interaction between the methionine cycle and the RAS/MAPK pathway most likely occurs at the level of the target genes. Furthermore, the methionine cycle appears to limit vulval induction only in the context of a hyper-activated RAS/MAPK pathway.
Tissue-specific effects of one-carbon metabolites
Since loss of metr-1 function suppressed the effects of the Comamonas DA1877 diet (Fig. 1f, g, i, j), we supplemented the growth medium with different one-carbon metabolites to test if they would mimic the dietary effects on RAS/MAPK-induced cell fates. Specifically, we tested folinic acid, a derivative of folic acid that is converted into the different THF metabolites to enhance the folate cycle, as well as L-methionine and choline to enhance the methionine cycle and phospholipid metabolism, respectively (Fig. 1a).
Wild-type animals fed with E. coli OP50 and exposed to one of the three metabolites had more apoptotic corpses and oocytes (Fig. 4a, b). Moreover, each of the three metabolites was sufficient to bypass the inhibitory effects of metr-1(lf) on germ cell differentiation (Fig. 4a, b). Only choline significantly enhanced VPC induction in let-60(gf) single mutants, but methionine and choline both reversed the effect of metr-1(lf) on vulval induction (Fig. 4c). In contrast, folinic acid did not affect vulval induction (Fig. 4c).
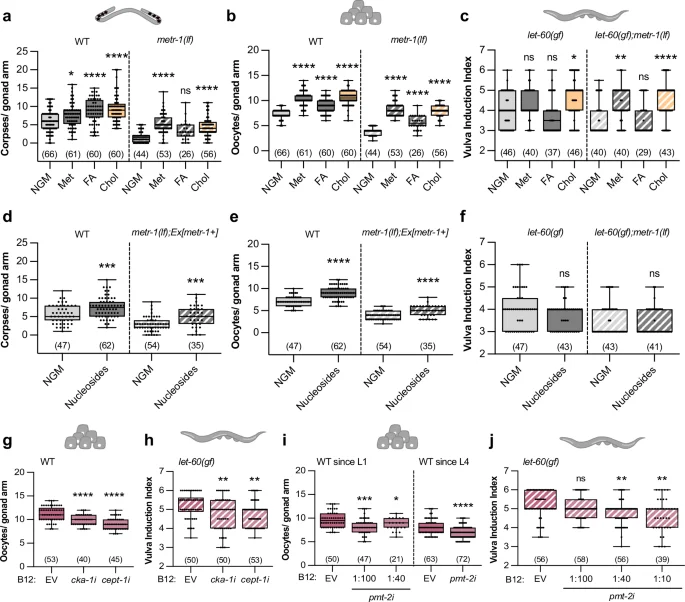
Number of corpses (a, d), oocytes (b, e), and vulval induction index (c, f) for indicated genotypes fed with E. coli OP50 and supplemented with the following metabolites; Met – 5 mM methionine; FA – 100 µM folinic acid; Chol – 40 mM choline; 1 mM nucleosides. Oocyte number of wild-type animals (g, i) and vulval induction index of let-60(gf) animals (h, j) fed with indicated RNAi clones or control (EV – empty vector). NGM was supplemented with 64 nM of B12; animals were exposed to RNAi from L1 except where indicated (L4). a–j Dots represent individual corpses/oocytes or animals from two independent biological replicates. Boxplots show 25–75 percentiles and median; whiskers represent min and max values. Number of animals in brackets. *P < 0.05, **P < 0.005, ***P < 0.0005, ****P < 0.0001 using two-way ANOVA followed by a Tukey’s multiple comparison test in a–c, two-way ANOVA followed by uncorrected Fisher’s LSD multiple comparison test in d, e, and f, one-way ANOVA followed by Dunnett’s multiple comparison test in g and i (WT since L1), an unpaired, two-tailed t-test in i (since L4) and a Kruskal-Wallis test for non-parametric data followed by a Dunn’s multiple comparison test in h and j. Source data are provided as a Source Data file.
Since the folate cycle is involved in nucleotide production, we tested two bacterial strains that produce more nucleotides, E. coli E. coli OP50 cytR– and E. coli HT11535. In the wild-type background, both strains enhanced germ cell apoptosis and oocyte differentiation (Supplementary Fig. 5a, b). Since metr-1(lf) worms showed an abnormal gonad development when grown on these two bacterial strains, we examined somatically rescued metr-1(lf) mutants, which showed an increase in apoptotic corpse and oocyte numbers when fed with E. coli cytR– or E. coli HT115 (Supplementary Fig. 5a, b), suggesting that nucleotide levels affect both processes. Vulval induction, on the other hand, was not enhanced by the two nucleotide-rich bacterial strains (Supplementary Fig. 5c). Furthermore, supplementing the growth medium with nucleosides caused an increase in apoptotic corpses and oocyte numbers in both wild-type animals and somatically rescued metr-1(lf) mutants (Fig. 4d, e), but did not affect vulval induction (Fig. 4f).
Analogous to the Comamonas DA1877 diet, supplementing choline or nucleosides partially suppressed the effects of germline-specific loss of mpk-1 on germ cell apoptosis and oocyte development (Supplementary Fig. 5d, e), indicating that these metabolites enhance RAS/MAPK signaling. Taken together, folate and methionine cycle metabolites affect germ cell differentiation and death, whereas vulval induction is only sensitive to methionine cycle metabolites.
Phosphatidylcholine (PC) biosynthesis depends on choline and methyl groups provided by the methionine cycle to methylate phosphatidylethanolamine (PE) (Fig. 1a). Since choline supplementation had a strong effect on all processes examined (Fig. 4a–c), we hypothesize that PC levels might regulate germ cell and VPC differentiation. PC produced via the SAM-dependent pathway requires the pmt-1 and pmt-2 methyltransferases, while the choline-dependent pathway involves cka-1 and cept-1 activity8,36 (Fig. 1a). We therefore used RNAi to test if the two PC synthesis pathways are necessary for the vitamin B12 effect on RAS/MAPK-controlled cell fates. Down-regulation of either cka-1 or cept-1 suppressed the vitamin B12-dependent increase in oocyte number and vulval induction (Fig. 4g, h). Due to the loss of the CED-1::GFP reporter signal in RNAi-treated animals, we could not score germ cell apoptosis. Since pmt-2 RNAi induced larval arrest, we treated larvae with pmt-2 RNAi bacteria diluted with empty vector (EV) starting at the L1 stage or exposed L4 larvae to undiluted pmt-2 RNAi bacteria. In both treatments, pmt-2 RNAi caused a reduction in oocyte number of wild-type animals supplemented with vitamin B12 (Fig. 4i). pmt-2 RNAi also reduced vulval induction in let-60(gf) animals supplemented with vitamin B12 (Fig. 4j).
Together, these findings indicate that PC biosynthesis mediates the effects of vitamin B12 supplementation on oocyte and VPC differentiation, suggesting that the effects of choline are mediated by PC.
The lipid metabolism represses vulval differentiation
Since one-carbon metabolism positively regulates germline and vulval development, and the Comamonas DA1877 diet alters gene expression11,37,38, we hypothesized that the Comamonas DA1877 diet enhances germ cell and VPC differentiation by changing the expression of genes that modulate the cellular responses to RAS/MAPK signaling. RNAseq analysis of adult wild-type and let-60(gf ts) animals fed with the E. coli OP50 or Comamonas DA1877 diet identified in total 389 significantly down-regulated and 394 significantly up-regulated genes in Comamonas DA1877-fed animals (Fig. 5a, b and Supplementary Data 1). The Comamonas DA1877 diet caused similar changes in the transcriptome of wild-type and let-60(gf ts) worms (Fig. 5b). Specifically, vitamin B12-, methionine cycle- and PC biosynthesis-related genes (nhr-114, pmp-5, metr-1, sams-1, pmt-1 and pmt-2) were down-regulated in Comamonas DA1877-fed worms (Fig. 5a, b and Supplementary Fig. 6a), suggesting a negative feedback response to increased levels of dietary vitamin B1211,37,38. Furthermore, we did not detect significant changes in the expression levels of RAS/MAPK pathway genes (Supplementary Fig. 6a). Pathway network analysis showed that the Comamonas DA1877 diet regulates several genes involved in innate immune response and fatty acid biosynthesis (fat-5, fat-6 and fat-7) (Supplementary Fig. 6b). Previous work has shown that diet-induced changes in gene expression can differ between young and gravid adult worms11. We, therefore, tested if the Comamonas DA1877 diet might influence gene expression in an age-dependent manner. We performed transcriptomic analysis of wild-type and let-60(gf) larvae at the mid-L3 stage, the stage when vulval induction occurs. The larval transcriptome showed smaller but similar changes in gene expression as observed in adults, as SAM, PC, and fatty acid metabolism were also among the most strongly affected pathways in L3 larvae (Supplementary Fig. 7a–c and Supplementary Data 2). We did not observe significant changes in lin-1 and lin-39 expression (Supplementary Fig. 7c), possibly because bulk RNAseq may not be sensitive enough to detect tissue-specific changes.
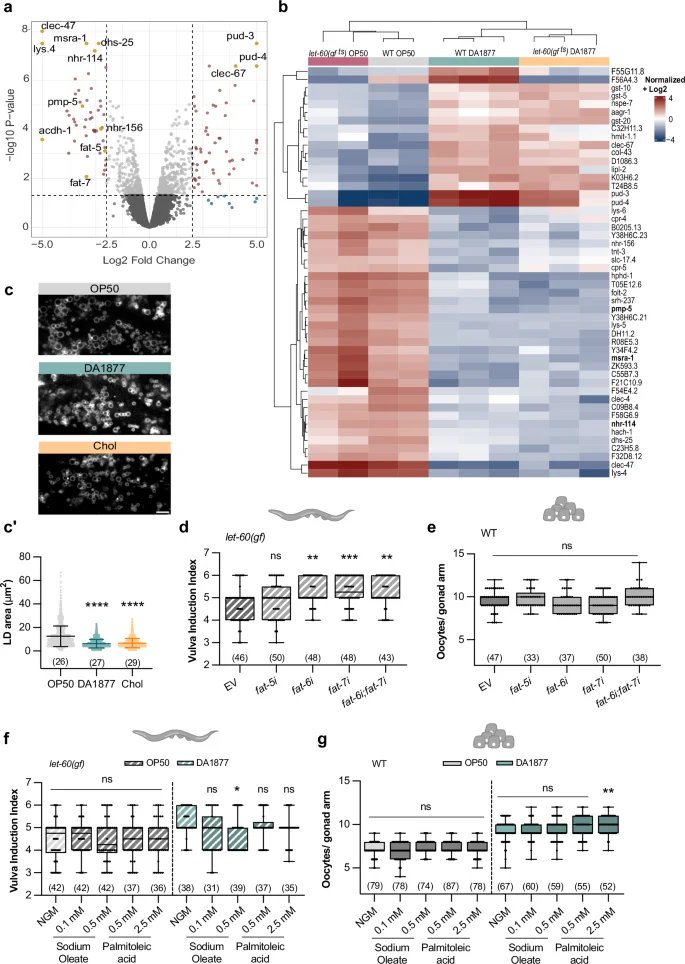
a Differentially expressed genes in adult wild-type animals fed with E. coli OP50 or Comamonas DA1877. Genes with a p-value 2.5 are highlighted. p-values were calculated as described in the methods. b Top 50 differentially expressed genes for the indicated conditions. c Fluorescence images of dsh-3::gfp marking intestinal lipid droplets (LD) in animals fed with E. coli OP50 (gray), Comamonas DA1877 (blue), or E. coli OP50 supplemented with 40 mM choline (yellow). Scale bar: 10 µm. c’ Area of intestinal LD; dots represent individual droplet areas of 100 droplets per animal, from two independent biological replicates. Bars represent mean with SD. vulval induction index of let-60(gf) (d) or oocyte number of wild-type animals (e) fed with indicated RNAi clones and control (EV – empty vector). f Vulval induction index of let-60(gf) and g, oocyte number of wild-type animals fed with E. coli OP50 (gray) or Comamonas DA1877 (blue), supplemented with indicated fatty acids. d–g dots represent individual gonads (e, g) or animals (d, f) from two independent biological replicates. Boxplots show 25–75 percentiles and median; whiskers represent min and max values. Number of animals in brackets. **P < 0.005, ***P < 0.0005, ****P < 0.0001 using one-way ANOVA followed by Dunnett’s multiple comparison test in c’ and e, two-way ANOVA followed by a Tukey’s multiple comparison test in f and g and a Kruskal-Wallis test for non-parametric data followed by a Dunn’s multiple comparison test in d, h, i. Source data are provided as a Source Data file.
Previous work established a connection between vitamin B12, the methionine cycle and fat metabolism39. Given that genes controlling the lipid metabolism (i.e., the lipid ∆9-desaturases fat-5, fat-6 and fat-7) were among the most strongly down-regulated genes, we explored the effect of the Comamonas DA1877 diet on the lipid metabolism and its consequences on RAS/MAPK-induced cell fates. Quantification of lipid droplet size using the dhs-3::gfp reporter40 indicated that the intestines of Comamonas DA1877-fed animals contained smaller lipid droplets than E. coli OP50-fed animals (Fig. 5c, c’). Choline supplementation had a similar effect (Fig. 5c, c’), suggesting the Comamonas DA1877 diet’s effect on lipid droplet size is choline-dependent. The fat genes are involved in different fatty acid desaturation and elongation pathways. fat-5 is responsible for palmitoleic acid (C16:1n7) production, whereas fat-6 and fat-7 are responsible for oleic acid (C18:1n9)41. We tested if fat-5, fat-6 or fat-7 RNAi affected vulval induction and oocyte differentiation. Single or double knock-down of fat-6 and fat-7 increased vulval induction in let-60(gf) animals, but fat-5 knock-down had no significant effect (Fig. 5d). Oocyte development was not affected by fat-5, fat-6 or fat-7 RNAi (Fig. 5e). Finally, we supplemented palmitoleic acid and sodium oleate to animals fed with E. coli OP50 or Comamonas DA1877. Supplementing sodium oleate to let-60(gf) animals fed with the Comamonas DA1877 diet reduced vulval induction to the levels observed in E. coli OP50-fed animals (Fig. 5f). However, oocyte differentiation was not changed by fatty acid supplementation, irrespective of the diet (Fig. 5g).
In summary, the down-regulation of unsaturated fatty acid biosynthesis by the Comamonas DA1877 diet, especially oleic acid, positively regulated vulval induction, but it did not affect germ cell differentiation.
A vitamin B12-rich diet increases histone H3K4 methylation
Since the methionine cycle is the main methyl donor in cells, we investigated whether changes in histone methylation might regulate germ cell and VPC differentiation. We focused on histone H3K4me3 because this type of histone modification is sensitive to diet, particularly a high-fat diet39, as well as changes in methionine cycle activity10,14,42. Western blot analysis showed higher global H3K4me3 levels in worms fed with Comamonas DA1877 or supplemented with choline and slightly reduced levels in metr-1(lf) mutants fed with E. coli OP50 (Fig. 6a and Supplementary Fig. 8a for the Western blots used for quantification). Since the Comamonas DA1877 diet down-regulated fat biosynthesis (Fig. 5c), we tested if inhibiting fat genes affected histone methylation. H3K4me3 levels did not increase after fat-6 or fat-7 single or double RNAi, indicating that the oleic acid metabolism does not regulate H3K4me3 levels (Fig. 6b and Supplementary Fig. 8b for the Western blots used for quantification).
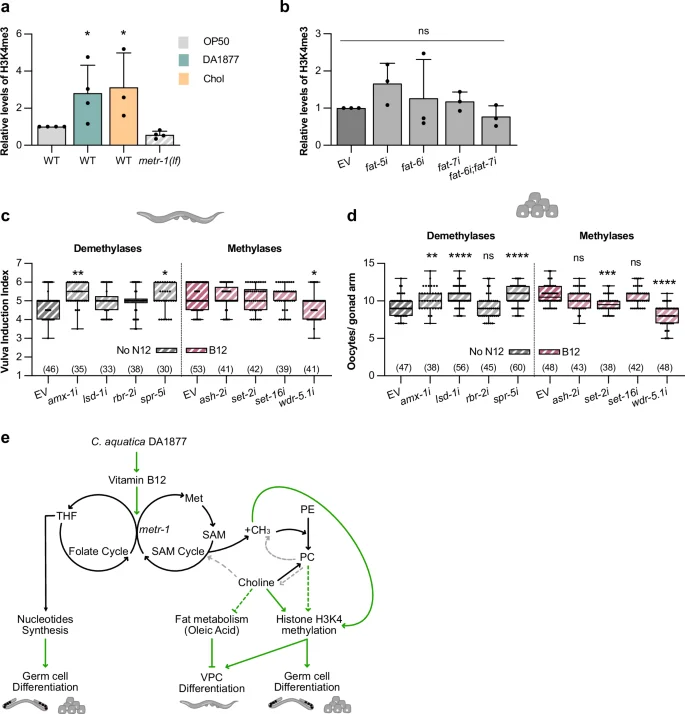
a Western blot quantification of tri-methylated H3K4 for indicated genotypes fed with E. coli OP50 (gray), Comamonas DA1877 (blue), or E. coli OP50 supplemented with 40 mM choline (yellow); levels of tri-methylated H3K4 were normalized to total H3 levels. Bars represent mean ± SD, normalized to the control (wild-type E. coli OP50), from four independent biological and technical replicates; see Supplementary Fig. 8a for individual Western blots. b Western blot quantification of tri-methylated H3K4 in wild-type animals fed with indicated RNAi clones; levels of tri-methylated H3K4 were normalized to total H3 levels. Bars represent mean ± SD, normalized to the control (wild-type EV), from three independent biological and technical replicates; see Supplementary Fig. 8b for individual Western blots. Vulval induction of let-60(gf) animals (c) and oocyte number of wild-type animals (d) fed with indicated RNAi clones or control (EV – empty vector); non-supplemented NGM (gray) or supplemented with 64 nM B12 (pink). Dots represent individual animals (c) or oocytes (d) from two independent biological replicates. Boxplots show 25–75 percentiles and median; whiskers represent min and max values. Number of animals in brackets. e Model depicting the tissue-specific effects of one-carbon metabolism on nucleosides synthesis, fat metabolism and histone methylation and its effects on germ cell and VPCs differentiation; green arrows are interactions supported by this work; dashed arrows are hypothesized from literature (gray) or conclusions made in this work (green). *P < 0.05, **P < 0.005, ***P < 0.0005, ****P < 0.0001 using a Kruskal-Wallis test for non-parametric data followed by a Dunn’s multiple comparison test in a–c and one-way ANOVA followed by Dunnett’s multiple comparison test in d. Source data are provided as a Source Data file.
To test if the increase in H3K4me3 levels caused by the Comamonas DA1877 diet contributed to vulval induction and germ cell differentiation, we inhibited by RNAi the four H3K4 demethylases amx-1, lsd-1, rbr-2 and spr-5 (which might mimic the Comamonas DA1877 diet in E. coli OP50-fed animals) and the four H3K4 methylases ash-2, set-2, set-16 and wdr-5.1 (which might suppress the vitamin B12 effect). RNAi of the demethylases amx-1 and spr-5 increased, and RNAi of the methylase wdr-5.1 decreased vulval induction in let-60(gf) animals supplemented with vitamin B12 (Fig. 6c). The effect of wdr-5.1 RNAi appeared to be specific to enhanced one-carbon metabolism, since wdr-5.1 RNAi caused no reduction in vulval induction without vitamin B12 supplementation (Supplementary Fig. S8c). Oocyte differentiation was also increased by amx-1, lsd-1 and spr-5 RNAi and decreased by set-2 and wdr-5.1 RNAi (Fig. 6d). Both, set-2 and wdr-5.1 are important for oocyte development, since knock-down of both genes reduced oocyte numbers without vitamin B12 supplementation (Supplementary Fig. S8d).
Finally, we tested if changes in H3K4 methylation might alter RAS/MAPK target gene expression by quantifying LIN-1::GFP levels after RNAi knock-down of amx-1, spr-5 and wdr-5.1 (Supplementary Fig. S8e, f). We observed no significant changes in LIN-1::GFP expression, suggesting that altering H3K4 methylation alone is not sufficient to change RAS/MAPK target gene expression.
We conclude that a vitamin B12-rich diet causes a global increase in H3K4me3 levels, which together with one-carbon metabolites contribute to enhanced vulval induction and oocyte differentiation.
Methionine-dependency of KRAS-transformed mammalian cells
To investigate if the role of the methionine cycle in regulating RAS/MAPK-induced cell fates is conserved in mammals, we cultured human cancer cell lines carrying activating mutations in KRAS in growth medium without methionine We first performed collective cell migration assays with A549 lung cancer cells that carry a KRAS G12S mutation, to test if methionine restriction (MR) interfered with cell migration. To exclude possible effects of reduced cell proliferation, we performed these assays with cells arrested in the G1 phase by double thymidine blockade43. A549 cells grown in MR (without methionine but supplemented with its precursor homocysteine) migrated at a lower speed than cells without MR (Fig. 7a–a”). The addition of the MEK inhibitors MEK162 and LGX818 without MR reversibly blocked cell migration, indicating that RAS/MAPK signaling is necessary for the migration of A549 cells, and removal of the MEK inhibitors 8 h after starting the assay allowed the cells to resume migration (Fig. 7a–a”), indicating that the reduced migration was not caused by increased cell death.
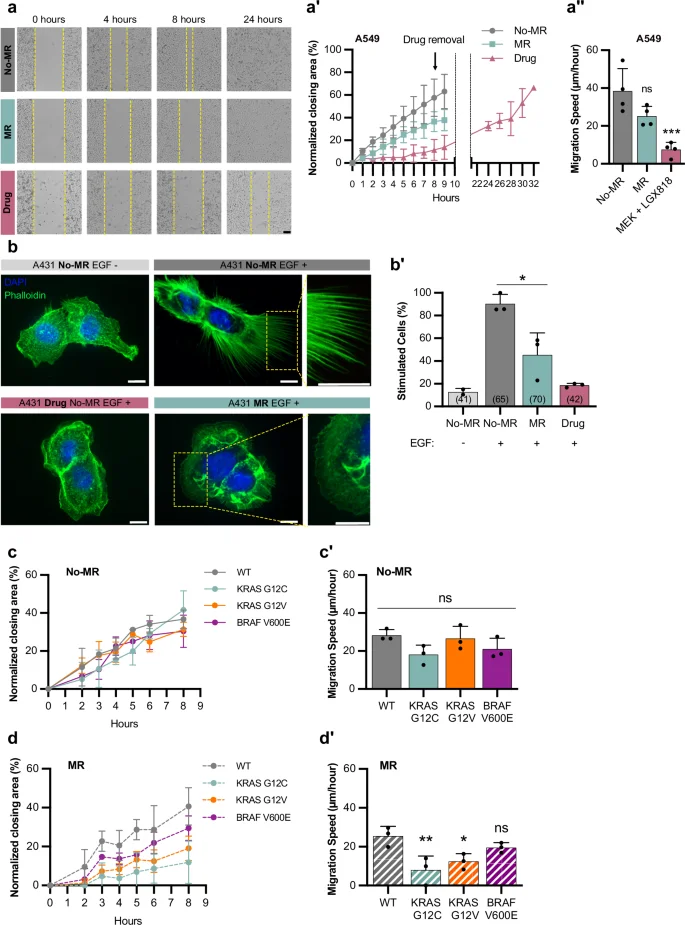
a Collective migration of A459 cells grown with MR (0 µM Met; 400 µM Hcy) (blue), without MR (200 µM Met; 400 µM Hcy) (gray), or treated with 1 µM MEK162 and 1 µM LGX818 MEK inhibitors (pink); yellow dashed lines represent the migrating front over time. a’ Normalized percentage of the area closed over time. Symbols indicate mean ± SD from four independent biological replicates. a”, Migration speed was calculated as the slope of graphs shown in a’. Bars represent the mean ± SD. b Staining of A431 cells with DAPI (blue) and phalloidin (green), with and without EGF stimulation or MR. Scale bar: 10 µm. For additional examples and the scoring criteria, see Fig. S9. b’ Percentage of stimulated cells with filopodia under indicated conditions. Bars represent mean ± SD from three independent biological replicates; total number of cells scored in brackets. c-d’ Quantification of collective migration in MEFs expressing different KRAS and BRAF mutations grown without c and with MR d. c, d Normalized percentage of area closed over time. Data represents mean ± SD from three independent biological replicates. c’, d’ Migration speed was calculated as the slope of graphs shown in c and d, respectively. Bars represent the mean ± SD. *P < 0.05, **P < 0.005, ***P < 0.0005 using one-way ANOVA followed by Dunnett’s multiple comparison test in a”, c’ and d’. Source data are provided as a Source Data file.
We next used A431 epidermoid carcinoma cells, which overexpress the EGFR and strongly respond to EGF stimulation by forming filopodia in a MAPK-dependent manner43. Since filopodia formation is difficult to assess quantitatively, we categorized cellular morphologies into three classes; 0 for cells without filopodia, 1 for cells with small filopodia covering part of the cortex, and 2 for cells with long filopodia covering most of the cortex (Supplementary Fig. 9a). Class 1 and 2 cells were scored as stimulated and class 0 cells as unstimulated. Without EGF stimulation, most cells did not form filopodia, while 90% of the cells stimulated with EGF in the presence of methionine formed filopodia (Fig. 7b, b’ and Supplementary Fig. 9b). By contrast, 55% of cells with MR and stimulated with EGF did not form filopodia (Fig. 7b, b’ and Supplementary Fig. 9b), indicating that methionine is required for A431 cells to fully respond to EGF stimulation. Treatment with the MEK inhibitors in the presence of methionine strongly reduced EGF-induced filopodia formation (Fig. 7b, b’).
Since human cancer cell lines such as A459 carry many additional mutations besides the KRAS mutations, we used primary mouse embryonic fibroblasts (MEFs), in which the three RAS genes had been deleted and replaced with vectors expressing wild-type, G12C, G12V KRAS, or V600E BRAF in the same genetic background43. Without MR, the KRAS mutant MEFs showed the same migration speed as KRAS wild-type control cells, suggesting that hyper-activation of the RAS/MAPK pathway alone is not sufficient to accelerate collective cell migration (Fig. 7c, c’). However, KRAS G12V and G12V cells migrated significantly slower with MR, whereas KRAS wild-type MEFs migrated at the same speed with or without MR (Fig. 7d, d’), suggesting that methionine levels are limiting in the context of hyper-active RAS/MAPK signaling. V600E BRAF mutant MEFs showed a similar effect, though the reduction in migration caused by MR was smaller.
Taken together, these results suggested that the methionine-dependency of RAS/MAPK-induced phenotypes may be conserved in mammalian cells.
Discussion
Diet has a major impact on the cellular metabolism. Therefore, cells must adapt their metabolism to the available nutrition to ensure survival in changing environments. Here, we focused on the vitamin B12-dependent one-carbon metabolism and its effects on cell fate decisions controlled by the oncogenic RAS/MAPK signaling pathway (Fig. 6e). A bacterial diet rich in vitamin B12 (Comamonas DA1877) or direct vitamin B12 supplementation enhanced germ cell apoptosis, oocyte differentiation and VPC induction, which are all controlled by the RAS/MAPK pathway. However, it should be noted that our data do not exclude potential vitamin B12-independent effects that may be caused by feeding a Comamonas DA1877 diet.
Different one-carbon metabolites have tissue-specific effects, as the folate cycle only affected germline development, while methionine cycle metabolites enhanced all RAS/MAPK-induced phenotypes. Choline and phosphatidylcholine (PC) are key mediators of vitamin B12-dependent effects by regulating histone H3K4me3 methylation and repressing fatty acid biosynthesis (Fig. 6e). We thus propose that methionine cycle activity is a limiting factor for different phenotypes caused by RAS/MAPK hyper-activation, by modulating the expression of downstream RAS/MAPK target genes. Finally, we show that methionine cycle activity is also a limiting factor in mammalian cells carrying activating mutations in KRAS, pointing to a conserved role of one-carbon metabolism in regulating cell RAS/MAPK-induced cell fates.
Folinic acid and nucleoside supplementation positively regulated germ cell death and oocyte differentiation, but not vulval induction. Since the purine and pyrimidine metabolisms are important for cell proliferation the E. coli HT115 or Comamonas DA1877 diets may promote germline proliferation by increasing folate levels35. Accordingly, Comamonas DA1877-fed animals contained more M-phase cells. However, the Comamonas DA1877 diet did not accelerate cell cycle progression because the number of germ cells in M-phase relative to the total number of mitotic cells remained constant in a vitamin B12-rich diet. However, the vitamin B12-rich diet accelerated germ cell transition through pachytene into diakinesis.
The increase in oocyte numbers is not linked to enhanced germ cell apoptosis since the apoptosis-deficient ced-3(lf) caspase mutants still showed the increase in oocyte number caused by the Comamonas DA1877 diet. While the mechanism by which nucleosides enhance germ cell apoptosis is not clear, we hypothesize that increasing nucleoside levels could promote oocyte differentiation by enhancing maternal mRNA production44. Oocyte differentiation is controlled by a meiotic checkpoint established by the HORMA complex. RAS/MAPK signaling regulates this checkpoint by controlling HTP-1 phosphorylation22. It is therefore possible that the B12 metabolism enhances HTP-1 phosphorylation and thereby increases the rate of oogenesis.
The effects of the vitamin B12-rich diet are associated with increased choline and PC levels. PC biosynthesis has previously been implicated in RAS/MAPK signaling in the survival of the uv1 cells under excitotoxic cell death45. Hyper-activation of the RAS/MAPK pathway by LET-23 EGFR leads to uv1 cell survival, which requires PC biosynthesis. Choline supplementation not only increased vulval induction but also enhanced physiological germ cell death and oocyte differentiation. Low choline or PC levels have previously been associated with stress- or radiation-induced apoptosis, which is mediated by ceramide signaling46,47. In this context, our results point to a distinct regulatory mechanism of physiological germ cell apoptosis controlled by the choline metabolism. Given that PC is one of the most abundant phospholipids in cell membranes and that RAS/MAPK signaling is required for membrane integrity during oogenesis23, choline could also promote oocyte production by facilitating membrane production. This is consistent with our observation that germ cells in animals fed with the Comamonas DA1877 diet exited pachytene faster, which may reflect a higher availability of membrane components.
A vitamin B12-rich diet resulted in the global downregulation of the fat genes that are necessary for the biosynthesis of monounsaturated fatty acids (MUFAs). The fat genes are regulated by different transcription factors such as SBP-1, NHR-49, NHR-80, and MDT-15. Interestingly, the methionine cycle and choline metabolism were previously reported to affect lipogenesis controlled by SBP-1 (a homolog of the mammalian sterol regulatory element-binding protein, SREBP)10,36,48. Moreover, in human cancer cells, RAS/MAPK signaling can regulate SREBP activity49. These interactions are consistent with our data indicating that a vitamin B12-rich diet increases PC levels and reduces the size of lipid droplets in the intestine, probably by down-regulating fat-5, fat-6, and fat-7 expression. The relationship between PC and fat metabolism is not exclusive to C. elegans, as PC supplementation suppresses obesity-related phenotypes in mice fed with a high-fat diet50, and a choline-deficient diet enhances liver fat levels in rats51. The fatty acid metabolism influences C. elegans at the organismic level by regulating survival, developmental time, reproduction, ferroptosis, and modulating drug effects52,53. However, our data indicate that fatty acid levels also affect developmental cell fate decisions specifically, as only oleic acid inhibited VPC differentiation. Since fatty acids can act as signaling molecules41, we hypothesize that oleic acid may regulate vulval induction via a specific signaling pathway. Especially, oleic acid was reported to activate stress-induced signaling pathways in mammalian immune cells54.
A Vitamin B12-rich diet or choline supplementation increased global histone H3K4me3 levels, consistent with previous reports in worms and mammals indicating that the methionine cycle promotes H3K4 methylation9,55. Choline can be oxidized to betaine, functioning as a methyl donor to regenerate SAM56. However, the C. elegans genome does not encode an ortholog of choline oxidase57, and choline supplementation does not bypass the reduction in H3K4me3 levels in intestinal cells caused by sams-1 knock-down10. Since phosphatidylethanolamine (PE) is a major consumer of methyl groups6, SAM and thereby also H3K4me3 levels may increase if PC production is shifted to the Kennedy/CDP-choline pathway (Fig. 1a). Thus, choline supplementation may promote histone methylation indirectly by reducing the competition for available methyl donors between histones and PE-dependent PC biosynthesis. Alternatively, choline could act directly as a methyl donor for H3K4 methylation.
The H3K4 methyltransferases SET-16 and WDR-5.1 were previously reported to regulate VPC differentiation58. Here, we show that only WDR-5.1 is required to mediate the effects of dietary vitamin B12, while the demethylases the AMX-1 and SPR-5 appear to counteract WDR-5.1. Enhancing methionine cycle activity may modulate chromatin accessibility of RAS/MAPK target genes by increasing H3K4me3 methylation of these loci by WDR-5.1, and thereby enhancing the transcriptional responses to MAPK activation.
In summary, we propose that the methionine cycle is a limiting factor for RAS/MAPK-induced cell fate decisions in several tissues of C. elegans.
The importance of RAS/MAPK signaling during oncogenic transformation is well documented, stimulating tumor cell proliferation, migration, and invasion15,16. Also, the methionine-dependency of cancer cells has been known since 195959,60. The exact reason why cancer cells depend on methionine is not completely understood. One possible explanation is that cancer cells have a reduced ability to use endogenous methionine for SAM synthesis due to a reallocation of homocysteine to the trans-sulfuration pathway61. It is also possible that cancer cells have an increased demand for methionine and SAM due to more methylation reactions or to a SAM-dependent methylation check-point that regulates cell cycle progression through interactions with MCM, Cdc6, or Cdk261. Moreover, MR globally decreases histone methylation, particularly H3K4me3 levels, which could attenuate the expression of RAS/MAPK target genes9,62. The relationship between one-carbon metabolism and cancer is also used for cancer therapy, as multiple chemotherapeutic drugs such as 5-fluorouracil (5-FU) or methotrexate inhibit one-carbon metabolism5.
Here, we show that different RAS/MAPK-regulated cellular processes depend on methionine. Using MEFs expressing different KRAS mutations as their only source of RAS activity, we observed remarkable differences in their sensitivity to MR. In the presence of methionine, KRAS mutant MEFs were indistinguishable from wild-type MEFs, but with MR only MEFs carrying activating KRAS mutations exhibited reduced cell migration. These findings support the idea of an increased dependency of RAS-transformed cancer cells on methionine cycle metabolites and mirror our findings with C. elegans let-60 ras(gf) mutants, which indicated that reducing methionine cycle activity limits the strength of the different phenotypes caused by RAS/MAPK hyper-activation. MR in cancer cells may attenuate RAS/MAPK signaling through one or several of the mechanisms we identified in the C. elegans model, i.e. by decreasing H3K4me3 methylation, increasing oleic acid biosynthesis or reducing nucleoside production. Taken together, these findings suggest that the mechanisms regulating this key carcinogenic signaling pathway by one-carbon metabolism may be conserved between worms and mammals.
Methods
C. elegans culture and bacterial strains used
C. elegans strains were maintained at 20 °C on standard nematode growth medium (NGM) plates seeded with Escherichia coli OP50. C. elegans N2 (Bristol) strain was used as wild-type63. Before an experiment, worms were synchronized by bleaching gravid adults and letting the embryos hatch without food. Comamonas aquatica DA1877, E. coli OP50, E. coli HT115, and E. coli cytR– were obtained from CGC. C. aquatica DA1877 ciA–/conB– and C. aquatica DA1877 cbiB–3 were obtained from the Walhout lab. All bacterial strains were grown overnight at 37 °C in liquid culture containing streptomycin (100 µg/ml) for Comamonas DA1877, kanamycin (50 µg/ml) for cytR– and streptomycin (100 µg/ml) and gentamycin (20 µg/ml) for both Comamonas DA1877 mutants. Supplementary Data 3 contains a list of all C. elegans strains used in this study.
Microscopy
Live C. elegans were mounted either on 3% agarose pads or in custom-made microfluidic devices for high-throughput and long-term imaging31,64. Nomarski (DIC) and epifluorescence images were acquired on one of three microscope systems: a DMRA2 (Leica) microscope equipped with a sCMOS camera (Prime BSI, Photometrics), a multicolor fluorescence light source (Spectra, Lumencor) and a piezo objective drive (MIPOS 100 SG, Piezosystems Jena); a DMRA (Leica) microscope equipped with two sCMOS cameras (C11440-42U30 Hamamatsu), an image splitter (TwinCam, Cairn Research), a multicolor fluorescence light source (Spectra, Lumencor) and a piezo objective drive (MIPOS 100 SG, Piezosystems Jena); or an inverted Ti-U (Nikon) equipped with a sCMOS camera (Prime 95B, Photometrics), a multicolor fluorescence light source (LedHub, Omicron Laserage Laserprodukt GmbH) and a piezo objective drive (Nano-F100, Mad City Labs). Images were acquired using a 20x air objective (HC PL APO 20x/0.80, Leica), a 40x oil objective (HCX PL APO 40x/1.32, Leica; CFI Plan Fluor 40X Oil, Nikon) or a 63x oil objective (HCX PL APO 63x/1.32-0.60, Leica). Confocal images were acquired on a spinning disk confocal (SDC) system consisting of a BX61 (Olympus) microscope equipped with an X-light V2 spinning disc unit, an EMCCD camera (iXon Ultra 888, Andor), two high-power LEDs (UHP-T-460-DI and UHP-T-560-DI, Prizmatix) for GFP and RFP excitation, a mercury vapor lamp (X-Cite exacter, Excelitas Technologies Corp) for DAPI, CFP and YFP excitation and a piezo objective drive (MIPOS 100 SG, Piezosystems Jena). Images were acquired using a 40x oil objective (UplanFL N 40x/1.30, Olympus) or a 60x oil objective (UPlanAPO 60x/1.40, Olympus).
Germ cell apoptosis and oocyte numbers
Unless stated otherwise, all experiments were performed in one-day-old adult animals (72 h post L1 starvation) grown at 20 °C. To score germ cell apoptosis in temperature-sensitive let-60(ga89) (gf ts) animals, all worms were initially grown at 15 °C and transferred to 25 °C for 4 h before corpse scoring. Germ cell apoptosis was scored using the bcIs39[Plim-7::ced-1::gfp] reporter27 and quantified in one gonad arm by counting CED-1::GFP positive cells. To count oocytes with the let-60(ga89) (gf ts) allele, worms were initially grown at 20 °C and transferred to 25 °C for 18 h before counting oocyte numbers. Oocytes were scored in DIC images or using the SYN-4::GFP membrane marker, counting the number of completely cellularized oocytes in the proximal gonad arm.
Vulval induction
All vulval induction experiments were conducted in the let-60(n1046gf) background. Vulval induction was scored in L4 animals (46-48 h post-L1) using DIC images65. The vulval induction index, the average number of induced VPCs per animal, was calculated by assigning a score of 1 to a VPC that had undergone three rounds of cell divisions, and a score of 0.5 when only one of the two VPC descendants had differentiated.
Metabolites, nucleoside and fatty acid supplementation
Vitamin B12, metabolites, and nucleosides were added to freshly prepared NGM plates. Vitamin B12 (#V2876, Sigma-Aldrich) was dissolved in water at 1 mM stock concentration and added at a final concentration of 64 nM unless indicated otherwise. All of the metabolites were directly added to the NGM plates at the following final concentrations: 40 mM for choline (#401757, Sigma-Aldrich), 5 mM for L-methionine (#1.05707, Sigma-Aldrich), and 100 µM for folinic acid (#F7878, Sigma-Aldrich). Uridine (#U3003-50G, Sigma-Aldrich), thymidine #T9250-25G, Sigma-Aldrich), guanosine (#G6264-25G, Sigma-Aldrich), and cytidine (#C4654-5G, Sigma-Aldrich) were also added directly at a final concentration of 1 mM each. Sodium oleate (#O3880, Merk) was likewise added directly at a final concentration of 0.1 and 0.5 mM, and palmitoleic acid (#P9417-100, Merk) at a final concentration of 0.5 and 2.5 mM. For fatty acid supplementation, 1 µM tergitol (NP40S) (#MFCD01779855, Merk) was included in the final mix for solubilization.
Long-term image acquisition
Long-term imaging experiments were performed as described by Berger et al.31. Briefly, E. coli OP50 or Comamonas DA1877 bacteria were grown overnight at 37 °C in LB medium. Bacterial cultures were then washed three times with S-Basal buffer and concentrated to 1 ml. For E. coli OP50, the bacterial culture was re-suspended in 650 µl of Optiprep (#D1556, Sigma-Aldrich) and 332 µl of S-Basal supplemented with 1% Pluronic F127 (#D1556, Sigma-Aldrich) and for Comamonas DA1877 in 600 µl of Optiprep and 380 µl of S-Basal supplemented with 1% Pluronic F127. The bacterial suspension was filtered using a 10 µm strainer (pluriStrainer Mini 10 um, PluriSelect). Worms were washed three times with S-Basal before loading on the chip. Animals were loaded as described, and immobilized by the microfluidic device channel and two on-chip hydraulic valves31. Epifluorescence images were acquired using a 40x oil objective, at an interval of 10 min for germ cell tracking, and 5 min to measure ovulation rates. Wild-type animals were imaged at 20 °C, and let-60(ga89) animals at 25 °C, with animals shifted from 20 °C to 25 °C two hours before the start of the experiment. The temperature was controlled (±0.5 °C) by either the room’s air conditioning system or a microscope cage incubator (H201-T-UNIT-BL-CRYO and H201-ENCLOSURE-CRYO, Okolab).
Germ cell tracking
Worm movement during long-term imaging acquisition was corrected using a custom-built MATLAB script. Briefly, sample drift in the z-direction was compensated for each time point assuming linear sample drift within the device channel. Image registration was initially performed on the channel outlining the germ cell membrane, with the derived transformation applied to all other channels. Sample shift in between time points was compensated by visually identifying the gonad’s loop region and cropping the original image to a final size of 750×250 pixels from the loop. For each time point, a maximum intensity z-projection of 5-10 slices was created.
Germ cell migration was tracked over 2 h, manually identifying the position of individual germ cells in each projection. Germ cells were tracked using the SYN-4::GFP membrane marker alone for let-60(ga89)(gf ts) or combined with the mCherry::H2B marker for the wild-type. Since germ cells migrate collectively, at least 10 individual cells distributed over the distal gonad arm were tracked per worm, and eight worms per genotype were analyzed.
RNA interference
RNAi plates were prepared by adding ampicillin (100 µg/ml) and IPTG (1 mM) to the NGM mixture. E. coli HT115 RNAi cultures were grown overnight at 37 °C with shaking in LB medium supplemented with ampicillin (100 µg/ml) and tetracycline (10 µg/ml). Before plating the bacteria on the RNAi plates, the overnight liquid culture was diluted 1:1 with fresh LB (supplemented with ampicillin, tetracycline and IPTG) and bacteria were allowed to grow for 3-5 h at 37 °C with shaking (except for the pmt-2 RNAi clone). 400 µl of bacterial culture were seeded on each plate, and plates were incubated at 37 °C overnight. RNAi clones were obtained from either the Ahringer RNAi library or the ORFeome RNAi library (both from Source BioScience). All RNAi clones were sequenced before the experiments.
ERK-nKTR biosensor quantification
MPK-1 activity in the VPCs was measured in mid-L2 larvae (1-cell-stage) using the ERK-nKTR biosensor described in de la Cova et al.33. Worms fed on E. coli OP50 were imaged 20-23 h post L1 and worms fed on Comamonas DA1877 were imaged 19-21 h post L1. The developmental stage was determined by measuring gonad length (35-75 µm in mid-L2). Epifluorescence images were acquired with a 0.25 µm z-step, using a 63x oil objective described as above.
Image analysis was performed using a custom-built MATLAB script. Acquired images were flat-field corrected, after which the in-focus slice was identified using the mCherry::H2B nuclear signal. The images were then z-projected (sum intensity) around the in-focus slice (two slices above and below) and individual VPCs were identified. The red/green fluorescence intensity ratio was calculated for each VPC except P3.p and normalized to the average intensity ratio of all VPCs for each animal.
Mitotic Index of germ cells
The mitotic zone of dissected gonads was identified by HIM-3 antibody staining (see Gonad dissection and immunostaining for sample preparation). Mitotic cells were counted using Fiji software66 based on nuclear DAPI staining. The number of pH3-positive M phase nuclei was divided by the total number of mitotic cells to calculate the mitotic index. Images were acquired using a confocal microscope with a 60x objective.
mRNA isolation and sequencing
For transcriptome analysis by RNAseq, animals were collected from plates seeded with either E. coli OP50 or Comamonas DA1877 bacteria. For adults, approximately 500 animals (wild-type or let-60(ga89) (gf ts)) were collected. For larval analysis, 1500 animals (wild-type or let-60(n1046gf)) were collected. Before sample collection, adult worms were transferred to 25 °C for 4 h. Three biological replicates were used per condition. Animals were washed off plates with M9 and snap-frozen in liquid nitrogen. Samples were stored at −80 °C until RNA extraction. Total mRNA extraction was performed for all samples at the same time with trizol, and samples were purified using a Rneasy Mini Kit (QIAGEN). Quality control (Agilent DNF-471 RNA kit), cDNA library preparation, and whole exome sequencing (Illumina Novaseq 6000 system) were performed by the transcriptomics service of the Functional Genomics Center Zurich (FGCZ). Between 15 and 30 million reads were obtained per sample. Bioinformatic and statistical analysis was performed using the FGCZ in-house bioinformatics pipeline SUSHI, using the open-source tools STAR for read alignment and EdgeR for differential gene expression analysis. p-values were calculated by paired two-tailed t-tests and corrected with the Benjamini- Hochberg method to control the false discovery rate (FDR).
Western blot analysis
One hundred worms were washed three times in ice-cold M9 and lysed in 50 µl 2x SDS PAGE buffer (containing 200 mM β-MCE) for 5 min at 95 °C. Genomic DNA was digested by adding 2 µl of Rnase-free Dnase (QIAGEN) for 5 min at room temperature followed by a 5-minute incubation at 95 °C. Samples were kept at 4 °C overnight or −20 °C for longer periods before loading. Before loading, samples were heated to 95 °C, and 15 µl were loaded onto 4-12% gradient polyacrylamide gels.
For MAPK, histone H3, and histone H3 tri methyl K4 quantification, the membrane was treated with transfer buffer containing 20% methanol and blocked with 5% Bovine Serum Albumin (BSA) (#10735086001, Merk) for anti-MAPK and 5% milk for anti-histone blots. Samples were incubated with anti-dephosphorylated ERK 1&2 (1:2000 dilution, #M8159, Sigma-Aldrich), anti-MAPK (1:10’000 dilution, #T6074, Sigma-Aldrich), anti-histone H3 (1:1000 dilution, #ab1791, Abcam), anti-histone H3 tri methyl K4 (1:1000 dilution, #ab8580, Abcam) and anti-alpha tubulin (1:10’000 dilution, #ab18251, Abcam) at 4 °C overnight. Secondary antibodies HRP conjugated anti-rabbit (1:2000 dilution, #111-035-144, Jackson Immuno Research) and HRP conjugated anti-mouse (1:2000 dilution, #115-035-146, Jackson Immuno Research) were incubated for 2 h at RT. The HRP was detected by incubating the membrane with a chemiluminescence assay SuperSignal West Dura Extended Durantion Substrate (#34075, Thermo Fisher Scientific) or SuperSignal West Pico PLUS Chemiluminescent Substrate (#34577, Thermo Fisher Scientific) for 4 min. For MAPK quantification, the membrane was then incubated with sodium azide (1:10) for 1 h to inactivate the HRP-conjugates, and re-stained for alpha Tubulin, followed by incubation with HRP-conjugated secondary antibodies, as well as the chemiluminescence assay.
Signal levels were quantified by measuring band intensities using a built-in tool in Fiji66. For MAPK quantification, both total MAPK and phospho-MAPK were normalized to the tubulin loading control. Phospho-MAPK levels were then normalized by total MAPK levels. Uncropped blots are shown in the Western blot raw data file in the Source Data.
Gonad dissection and immunostaining
Gonad dissection was performed in PBS containing 0.2 mM tetramisole. Dissected gonads were transferred to siliconized 2 ml Eppendorf tubes and fixed in 4% formaldehyde for 10-60 min. For HIM-3 and pH3 staining, gonads were washed three times with PBS-T (0.05% Tween 20) and permeabilized with 0.5% Triton for 12 min. All gonads were washed three times with 0.05% PBS-T and post-fixed for 5 min at −20 °C in 100% methanol. Dissected gonads were blocked for 2–4 h at room temperature in PGB buffer (PBS-T, 1% BSA, 0.2% gelatin) or 1% BSA. Primary antibodies were diluted in PGB buffer or BSA and incubated overnight at 4 °C, except for pH3 staining, which was incubated for 4 h at room temperature after primary incubation with HIM-3 overnight at 4 °C. Gonads were stained for anti-dephosphorylated ERK 1&2 (1:2000 dilution, #M8159, Sigma-Aldrich), anti-XND-1 (1:2000 dilution, Judith Yanowitz lab), anti-SUN-1 (pS8) (1:700 dilution, Verena Jantsch lab), anti-GLD-1 (1:100 dilution, Judith Kimble lab), anti-HIM-3 (1:500 dilution, Monique Zetka lab) and anti-phospho-histone H3 (Ser10) (1:400 dilution, #05-806, Merk). Secondary antibodies anti-rabbit alexa 568 (1:1000 dilution, #A-10042, Invitrogen), anti-guinea pig Alexa 594 (1:1000 dilution, #A-11076, Invitrogen), and anti-mouse Alexa 488 (1:1000 dilution, #A-11001, Invitrogen) were incubated for 2 h at room temperature. After secondary incubation, gonads were washed three times with PBS-T. To stain germ cell nuclei DAPI dihydrochloride was added (1:10’000) during the second wash for 10 min. Gonads were mounted in Mowiol (pH 8.3) (#20211125, DABCO) on a glass slide and polymerized overnight at 4 °C. Epifluorescence images were acquired using a 20x air objective as described above.
Before quantification, images were flat-field corrected using a custom-built MATLAB script. To correct for differences in gonad length, the length of the distal arm was normalized such that the distal tip cell (DTC) corresponded to 0 and the loop region to 1. Intensity profiles from the DTC to the loop were measured along each gonad in sum-intensity projections using Fiji66.
Quantification of reporter gene expression
LIN-1::GFP and LIN-39::GFP fluorescence intensity were scored in VPC descendants at the 2-cell Pnp.x stage (mid-L3). Wild-type worms fed with E. coli OP50 were imaged 29-30 h post L1; wild-type worms fed with Comamonas DA1877 were imaged 27-29 h post L1; let-60(n1046) (gf) worms fed with E. coli OP50 were imaged 32-33 h post-L1; and let-60(n1046) (gf) worms fed with Comamonas DA1877 were imaged 29 h post L1. Images were acquired on an epifluorescence microscope using a 63x oil-immersion lens, as described above. Before quantification, images were flat-field corrected using a custom-built MATLAB script. VPC nuclei were manually selected and the average fluorescence intensity was measured on an in-focus z-slice using built-in tools in Fiji66. Fluorescence intensities for each pair of VPC descendants were averaged. The data for each VPC was normalized to the average value obtained from E. coli OP50-fed animals (i.e., P5.p on Comamonas DA1877 or E. coli OP50 divided by the average of P5.p on E. coli OP50).
Quantification of lipid droplet size
Lipid droplet size was measured using the DHS-3::GFP reporter40. Twenty worms were analyzed per condition, and the area of 100 droplets was measured in the posterior section of the intestine of each worm. Images were acquired using a confocal microscope using a 100x oil-immersion lens as described above. The lipid droplet area was measured by manually selecting lipid droplets using Fiji66.
Generation of transgenic C. elegans
Somatic rescue of metr-1 was achieved by creating extrachromosomal arrays in the metr-1(lf) background. Microinjections were performed according to67. Purified PCR DNA was injected at a concentration of 20 ng/µl. Two co-injection markers were used: 2.5 ng/µl of pCFJ90 (Pmyo-2>mCherry)68 and 100 ng/µl of pBluescript-KS. Three independent lines were generated and characterized.
Mammalian cell culture
For cell culture experiments, we used the human lung carcinoma epithelial cell line A459, the epidermoid carcinoma A431 cell line (#85090402, Sigma-Aldrich) and four mouse embryonic fibroblast (MEFs) lines: KRAS 4B WT (#RPZ26216, National Cancer Institute), KRAS 4B G12C (#RPZ26186, National Cancer Institute), KRAS 4B G12V (#RPZ26425, National Cancer Institute) and BRAF V600E (#RPZ26275, National Cancer Institute). All cell lines were tested for mycoplasma and kept at 5% CO2, 98% relative humidity and 37 °C in a modified DMEM with high glucose and sodium pyruvate (#41966029, Thermo Fisher Scientific), containing 10% fetal calf serum (FCS) (#10500-064, Gibco).
For methionine restriction (MR) experiments, cells were kept in a modified DMEM medium with high glucose, no glutamine, no methionine, and no cysteine (#21013024, Thermo Fisher Scientific). For methionine-positive conditions (no-MR), the medium was supplemented with 200 mM L-Glutamine (#A29168-01, Thermo Fisher Scientific), 200 µM L-Methionine (#J61904.18, Thermo Fisher Scientific), 100 mM L-Cysteine dihydrochloride (#J62292.14, Thermo Fisher Scientific), 400 µM DL-Homocysteine thiolactone hydrochloride (#L09077.14, Thermo Fisher Scientific) and 100 mM sodium pyruvate (#11360070, Thermo Fisher Scientific). For methionine-restricted (MR) conditions, the medium was equally supplemented except for methionine.
Cell migration assays
G1-arrested A549 cells and MEFs were used for migration assays. Cells were seeded at 80’000 cells/ml density in DMEM medium with or without methionine. After 32 h, cells were exposed to thymidine (1:50) to arrest the cell cycle as described in ref. 43 (first thymidine block). 16 h after, the first thymidine block was released by replacing the medium. 8 h after, cells were transferred to ibidi 2-well silicon culture inserts at a density of 400’000 cells/ml and again exposed to a medium containing thymidine (second thymidine block). Cells remained in the silicon culture inserts for 16 h after which the inserts were removed and pictures were taken every hour for 8 h. For experiments with MEK inhibitors, cells were exposed to 1 µM MEK162 (binimetinib) (#606143.89-9, Selleckchem) and 1 µM LGX818 (ecorafenib) (#1269440-17-6, MedChemExress) during the first thymidine block. The relative migration was calculated as R[%] = (R0—Rn)/R0×100[%], where R0 represents the initial open area and Rn represents the remaining open area at each time point. Linear regression was used to determine migration rates shown in the bar graphs (Fig. 7a”).
EGF stimulation and immunostaining of A431 cells
The A431 cell line was used to analyze filopodia formation upon EGF stimulation. Cells were exposed to no-methionine restriction (no-MR, 200 µM methionine + 400 µM homocysteine) or MR (0 µM methionine + 400 µM homocysteine) 24 h before the experiment. Cells were then seeded on glass slides in 24-well plates at 114’000 cells/ml density in no-MR or MR conditions. After 24 h, cells were serum starved and treated with 1 µM MEK162 (binimetinib) and 1 µM LGX818 (ecorafenib). After another 16 h, cells were stimulated with 100 ng/ml of EGF for 10 min at 37 °C67, followed by 15 min fixation in 4% PFA at 37 °C. Cells were permeabilized for 5 min with 0.2% Triton X-100% and 0.5% BSA and then blocked for 1 h in 0.5% BSA and 0.2% gelatine. Fixed cells were stained with Phalloidin 568 for 40 min and 0.1 µg/ml DAPI for 5 min. Glass slides were mounted with ProLong Gold Antifade Mountant (Thermo Fisher Scientific).
Statistical analysis and reproducibility
No statistical method was used to predetermine the sample size. Animals were randomly selected for analysis, and no data were excluded from the analyses. The Investigators were not blinded to allocation during experiments and outcome assessment. Statistical analysis was performed using GraphPad Prism 10. When comparing two samples, an unpaired t-test was used. For multiple samples, data was analyzed by one-way ANOVA followed by Dunnett’s multiple comparison test, by two-way ANOVA followed by Tukey’s multiple comparison test for parametric data, by two-way ANOVA followed by an uncorrected Fisher’s LSD multiple comparison test for interactions between multiple conditions or a Kruskal-Wallis test for non-parametric data followed by a Dunn’s test for multiple comparisons. The specific tests used and the number of biological and technical replicates obtained are specified in the figure legends.
Reporting summary
Further information on research design is available in the Nature Portfolio Reporting Summary linked to this article.
Data availability
The transcriptomic data generated in this study have been deposited in the European Nucleotide Archive under accession number PRJEB67437. Source data are provided in this paper.
Code availability
Image processing scripts are available at Zenodo https://doi.org/10.5281/zenodo.13383462 (https://www.zenodo.org).
References
-
Bose, S., Allen, A. E. & Locasale, J. W. The molecular link from diet to cancer cell metabolism. Mol. Cell 78, 1034–1044 (2020).
Google Scholar
-
Green, R. et al. Vitamin B12 deficiency. Nat. Rev. Dis. Primers. 3, 17041 (2017).
-
Watson, E. et al. Interspecies systems biology uncovers metabolites affecting C. elegans gene expression and life history traits. CELL 156, 759–770 (2014).
Google Scholar
-
Watson, E. et al. Metabolic network rewiring of propionate flux compensates vitamin B12 deficiency in C. elegans. eLife 5, 1–21 (2016).
Google Scholar
-
Ducker, G. S. & Rabinowitz, J. D. One-carbon metabolism in health and disease. Cell Metab. 25, 27–42 (2017).
Google Scholar
-
Ye, C., Sutter, B. M., Wang, Y., Kuang, Z. & Tu, B. P. A metabolic function for phospholipid and histone methylation. Mol. Cell 66, 180–193.e8 (2017).
Google Scholar
-
Lochnit, G. & Geyer, R. Evidence for the presence of the Kennedy and Bremer-Greenberg pathways in Caenorhabditis elegans. Acta Biochim. Pol. 50, 1239–1243 (2003).
Google Scholar
-
Brendza, K. M. et al. Phosphoethanolamine N-methyltransferase (PMT-1) catalyses the first reaction of a new pathway for phosphocholine biosynthesis in Caenorhabditis elegans. Biochem. J. 404, 439–448 (2007).
Google Scholar
-
Mentch, S. J. et al. Histone methylation dynamics and gene regulation occur through the sensing of one-carbon metabolism. Cell Metab. 22, 861–873 (2015).
Google Scholar
-
Ding, W. et al. S-adenosylmethionine levels govern innate immunity through distinct methylation-dependent pathways. Cell Metab. 22, 633–645 (2015).
Google Scholar
-
MacNeil, L. T., Watson, E., Arda, H. E., Zhu, L. J. & Walhout, A. J. M. Diet-induced developmental acceleration independent of TOR and insulin in C. elegans. Cell 153, 240–252 (2013).
Google Scholar
-
Watson, E., MacNeil, L. T., Arda, H. E., Zhu, L. J. & Walhout, A. J. M. Integration of metabolic and gene regulatory networks modulates the C. elegans dietary response. Cell 153, 253–266 (2013).
Google Scholar
-
Greer, E. L. et al. Members of the H3K4 trimethylation complex regulate lifespan in a germline-dependent manner in C. elegans. Nature 466, 383–387 (2010).
Google Scholar
-
Ding, W. et al. Stress-responsive and metabolic gene regulation are altered in low S-adenosylmethionine. PLoS Genet. 14, 1–26 (2018).
Google Scholar
-
Guo, Y. et al. ERK/MAPK signalling pathway and tumorigenesis (Review). Experimental and Therapeutic Medicine 1997–2007 https://doi.org/10.3892/etm.2020.8454 (2020).
-
Schubbert, S., Shannon, K. & Bollag, G. Hyperactive Ras in developmental disorders and cancer. Nat. Rev. Cancer 7, 295–308 (2007).
Google Scholar
-
Church, D. L., Guan, K. L. & Lambie, E. J. Three genes of the MAP kinase cascade, mek-2, mpk-1/sur-1 and let-60 ras, are required for meiotic cell cycle progression in Caenorhabditis elegans. Development 121, 2525–2535 (1995).
Google Scholar
-
Lee, M. H. et al. Multiple functions and dynamic activation of MPK-1 extracellular signal-regulated kinase signaling in Caenorhabditis elegans germline development. Genetics 177, 2039–2062 (2007).
Google Scholar
-
Sternberg, P. W. & Han, M. Genetics of RAS signaling in C. elegans. Trends Genet. 9525, 466–472 (1998).
Google Scholar
-
Gupta, B. P., Hanna-Rose, W. & Sternberg, P. W. Morphogenesis of the vulva and the vulval-uterine connection*. Wormbook https://doi.org/10.1895/wormbook.1.152.1 (2012).
-
Schindler, A. J. & Sherwood, D. R. Morphogenesis of the Caenorhabditis elegans vulva. Wiley Interdiscip. Rev.: Dev. Biol. 2, 75–95 (2013).
Google Scholar
-
Das, D., Chen, S. Y. & Arur, S. ERK phosphorylates chromosomal axis component HORMA domain protein HTP-1 to regulate oocyte numbers. Sci. Adv. 6, eabc5580 (2020).
Google Scholar
-
Arur, S. et al. MPK-1 ERK controls membrane organization in C. elegans oogenesis via a sex-determination module. Dev. Cell 20, 677–688 (2011).
Google Scholar
-
Gumienny, T. L., Lambie, E., Hartwieg, E., Horvitz, H. R. & Hengartner, M. O. Genetic control of programmed cell death in the Caenorhabditis elegans hermaphrodite germline. Development 1022, 1011–1022 (1999).
Google Scholar
-
Wang, X. & Yang, C. Programmed cell death and clearance of cell corpses in Caenorhabditis elegans. Cell. Mol. Life Sci. 73, 2221–2236 (2016).
Google Scholar
-
Zhou, Z., Hartwieg, E. & Horvitz, H. R. CED-1 is a transmembrane receptor that mediates cell corpse engulfment in C. elegans. Cell 104, 43–56 (2001).
Google Scholar
-
Derry, W. B., Putzke, A. P. & Rothman, J. H. Caenorhabditis elegans p53: Role in apoptosis, meiosis, and stress resistance. Science 294, 591–595 (2001).
Google Scholar
-
Gartner, A., Milstein, S., Ahmed, S., Hodgkin, J. & Hengartner, M. O. A conserved checkpoint pathway mediates DNA damage–induced apoptosis and cell cycle arrest in C. elegans. Mol. Cell 5, 435–443 (2000).
Google Scholar
-
Kohlbrenner, T. et al. Actomyosin-mediated apical constriction promotes physiological germ cell death in C. elegans. bioRxiv https://doi.org/10.1101/2023.08.22.554140 (2023).
-
Robinson-Thiewes, S. et al. Non-autonomous regulation of germline stem cell proliferation by somatic MPK-1/MAPK activity in C. elegans. Cell Rep. 35, 109162 (2021).
Google Scholar
-
Berger, S. et al. Long-term: C. elegans immobilization enables high resolution developmental studies in vivo. Lab Chip 18, 1359–1368 (2018).
Google Scholar
-
Lackner, M. R. & Kim, S. K. Genetic analysis of the Caenorhabditis elegans MAP kinase gene mpk-1. Genetics 150, 103–117 (1998).
Google Scholar
-
de la Cova, C., Townley, R., Regot, S. & Greenwald, I. A real-time biosensor for ERK activity reveals signaling dynamics during C. elegans cell fate specification. Dev. Cell 42, 542–553.e4 (2017).
Google Scholar
-
Sundaram, M. V. Canonical RTK-Ras-ERK signaling and related alternative pathways *. Wormbook https://doi.org/10.1895/wormbook.1.80.2 (2013).
-
Chi, C. et al. Nucleotide levels regulate germline proliferation through modulating GLP-1/Notch signaling in C. elegans. Genes Dev. 30, 307–320 (2016).
Google Scholar
-
Walker, A. K. et al. A conserved SREBP-1/phosphatidylcholine feedback circuit regulates lipogenesis in metazoans. Cell 147, 840–852 (2011).
Google Scholar
-
Bulcha, J. T. et al. A persistence detector for metabolic network rewiring in an animal. Cell Rep. 26, 460–468.e4 (2019).
Google Scholar
-
Giese, G. E. et al. Caenorhabditis elegans methionine/s-adenosylmethionine cycle activity is sensed and adjusted by a nuclear hormone receptor. eLife 9, 1–25 (2020).
Google Scholar
-
Wan, Q. L. et al. Histone H3K4me3 modification is a transgenerational epigenetic signal for lipid metabolism in Caenorhabditis elegans. Nat. Commun. 13, 1–14 (2022).
Google Scholar
-
Zhang, P. et al. Proteomic study and marker protein identification of Caenorhabditis elegans lipid droplets. Mol. Cell. Proteom. 11, 317–328 (2012).
Google Scholar
-
Watts, J. L. & Ristow, M. Lipid and carbohydrate metabolism in Caenorhabditis elegans. Genetics 207, 413–446 (2017).
Google Scholar
-
Li, S. et al. Serine and SAM Responsive Complex SESAME regulates histone modification crosstalk by sensing cellular metabolism. Mol. Cell 60, 408–421 (2015).
Google Scholar
-
Drosten, M. et al. Genetic analysis of Ras signalling pathways in cell proliferation, migration and survival. EMBO J. 29, 1091–1104 (2010).
Google Scholar
-
Huelgas-Morales, G. & Greenstein, D. Control of oocyte meiotic maturation in C. elegans. Semin. Cell Dev. Biol. 84, 90–99 (2018).
Google Scholar
-
Crook, M., Upadhyay, A., Ido, L. J. & Hanna-Rose, W. Epidermal growth factor receptor cell survival signaling requires phosphatidylcholine biosynthesis. G3: Genes, Genomes, Genet. 6, 3533–3540 (2016).
Google Scholar
-
Cui, Z. & Houweling, M. Phosphatidylcholine and cell death. Biochim. et. Biophys. Acta – Mol. Cell Biol. Lipids 1585, 87–96 (2002).
Google Scholar
-
Yang, Y. et al. Ceramide mediates radiation-induced germ cell apoptosis via regulating mitochondria function and MAPK factors in Caenorhabditis elegans. Ecotoxicol. Environ. Saf. 208, 111579 (2021).
Google Scholar
-
Qin, S. et al. Early-life vitamin B12 orchestrates lipid peroxidation to ensure reproductive success via SBP-1/SREBP1 in Caenorhabditis elegans. Cell Rep. 40, 111381 (2022).
Google Scholar
-
Glunde, K., Bhujwalla, Z. M. & Ronen, S. M. Choline metabolism in malignant transformation. Nat. Rev. Cancer 11, 835–848 (2011).
Google Scholar
-
Lee, H. S. et al. Beneficial effects of phosphatidylcholine on high-fat diet-induced obesity, hyperlipidemia and fatty liver in mice. Life Sci. 118, 7–14 (2014).
Google Scholar
-
Deminice, R. et al. Creatine supplementation prevents fatty liver in rats fed choline-deficient diet: A burden of one-carbon and fatty acid metabolism. J. Nutr. Biochem. 26, 391–397 (2015).
Google Scholar
-
Perez, M. A. & Watts, J. L. Worms, fat, and death: Caenorhabditis elegans lipid metabo-lites regulate cell death. Metabolites 11, 1–18 (2021).
Google Scholar
-
Brock, T. J., Browse, J. & Watts, J. L. Fatty acid desaturation and the regulation of adiposity in Caenorhabditis elegans. Genetics 176, 865–875 (2007).
Google Scholar
-
Hidalgo, M. A., Carretta, M. D. & Burgos, R. A. Long chain fatty acids as modulators of immune cells function: contribution of FFA1 and FFA4 receptors. Front. Physiol. 12, 1–18 (2021).
Google Scholar
-
Dai, Z., Mentch, S. J., Gao, X., Nichenametla, S. N. & Locasale, J. W. Methionine metabolism influences genomic architecture and gene expression through H3K4me3 peak width. Nat. Commun. 9, 1–12 (2018).
Google Scholar
-
Zeisel, S. H. The supply of choline is important for fetal progenitor cells. Semin. Cell Dev. Biol. 22, 624–628 (2011).
Google Scholar
-
Wasmuth, J., Schmid, R., Hedley, A. & Blaxter, M. On the extent and origins of genic novelty in the phylum nematoda. PLoS Negl. Trop. Dis. 2, e258 (2008).
Google Scholar
-
Fisher, K., Southall, S. M., Wilson, J. R. & Poulin, G. B. Methylation and demethylation activities of a C. elegans MLL-like complex attenuate RAS signalling. Dev. Biol. 341, 142–153 (2010).
Google Scholar
-
Chello, P. L. & Bertino, J. R. Dependence of 5-Methyltetrahydrofolate utilization by L5178Y Murine leukemia cells in vitro on the presence of hydroxycobalamin and Transcobalamin II. Cancer Res. 33, 1989–1904 (1973).
-
Sugimura, T., Birnbaum, S. M., Winitz, M. & Greenstein, J. P. Quantitative nutritional studies with water-soluble, chemically defined diets. VIII. The forced feeding of diets each lacking in one essential amino acid. Arch. Biochem. Biophys. 81, 448–455 (1959).
Google Scholar
-
Kaiser, P. Methionine dependence of cancer. Biomolecules 10, 7–9 (2020).
Google Scholar
-
Kera, Y. et al. Methionine adenosyltransferase II-dependent histone H3K9 methylation at the COX-2 gene locus. J. Biol. Chem. 288, 13592–13601 (2013).
Google Scholar
-
Brenner, S. The genetics of Caenorhabditis elegans. Genetics 77, 71–94 (1974).
Google Scholar
-
Spiri, S., Berger, S., Mereu, L., DeMello, A. & Hajnal, A. Reciprocal EGFR signaling in the anchor cell ensures precise inter-organ connection during Caenorhabditis elegans vulval morphogenesis. Development 149, dev199900 (2022).
-
Sternberg, P. W. & Horvitz, H. R. Pattern formation during vulval development in C. elegans. Cell 44, 761–772 (1986).
Google Scholar
-
Schindelin, J. et al. Fiji: An open-source platform for biological-image analysis. Nat. Methods 9, 676–682 (2012).
Google Scholar
-
Haag, A., Walser, M., Henggeler, A. & Hajnal, A. The CHORD protein CHP-1 regulates EGF receptor trafficking and signaling in C. elegans and in human cells. eLife 9, 1–23 (2020).
Google Scholar
-
Frøkjaer-Jensen, C. et al. Single copy insertion of transgenes in C. elegans. Nat. Genet. 40, 1375–1383 (2008).
Google Scholar
Acknowledgements
We would like to thank all present and past members of the Hajnal group for critical discussion and input on this project. A special thanks to Michael Daube for lab assistance and maintenance and to Dr. Michael Walser for support during the cell culture. We are thankful to the Caenorhabditis Genetics Center (CGC) (funded by the NIH P40 OD010440), to Wormbase (funded by NIH RO1 OD023041), Dr. Walhout and her lab for sending us the C. aquatica vitamin B12-mutants, and the National Cancer Institute (NIH) for the KRAS mutant and wild-type MEFs. We also want to thank Drs. Verena Jantsch, Judith Kimble, and Monique Zetka for providing antibodies. We thank Dr. deMello and his lab for access to their facilities and reagents. Finally, a big thank you to the Functional Genomics Center Zurich (FGCZ) of the University of Zurich, especially Dr. Maria Domenica Moccia for help with the RNAseq. This project was supported by the Candoc Forschungskredit of the University of Zurich to A.C.L. (grant no. K-74406-03) and the Swiss National Science Foundation (grant nos.31003A-184792 & 320030-228367) to A.H.
Author information
Authors and Affiliations
Contributions
Conceptualization: A.C.L. and A.H.; Investigation: A.C.L., S.B., T.K., and A.H.; Formal Analysis: A.C.L., S.B. and N.R.G.; Writing – Original draft: A.C.L. and A.H.; Writing – Review and Editing: A.C.L. and A.H.; Funding acquisition: A.C.L. and A.H.
Corresponding author
Ethics declarations
Competing interests
The authors declare no competing interests.
Peer review
Peer review information
Nature Communications thanks Albertha Walhout, and the other, anonymous, reviewers for their contribution to the peer review of this work. A peer review file is available.
Additional information
Publisher’s note Springer Nature remains neutral with regard to jurisdictional claims in published maps and institutional affiliations.
Supplementary information
Supplementary Information
Peer Review File
Description of additional supplementary files
Supplementary Data 1
Supplementary Data 2
Supplementary Data 3
Reporting Summary
Source data
Source Data
Rights and permissions
Open Access This article is licensed under a Creative Commons Attribution-NonCommercial-NoDerivatives 4.0 International License, which permits any non-commercial use, sharing, distribution and reproduction in any medium or format, as long as you give appropriate credit to the original author(s) and the source, provide a link to the Creative Commons licence, and indicate if you modified the licensed material. You do not have permission under this licence to share adapted material derived from this article or parts of it. The images or other third party material in this article are included in the article’s Creative Commons licence, unless indicated otherwise in a credit line to the material. If material is not included in the article’s Creative Commons licence and your intended use is not permitted by statutory regulation or exceeds the permitted use, you will need to obtain permission directly from the copyright holder. To view a copy of this licence, visit http://creativecommons.org/licenses/by-nc-nd/4.0/.
Reprints and permissions
About this article
Cite this article
Laranjeira, A.C., Berger, S., Kohlbrenner, T. et al. Nutritional vitamin B12 regulates RAS/MAPK-mediated cell fate decisions through one-carbon metabolism.
Nat Commun 15, 8178 (2024). https://doi.org/10.1038/s41467-024-52556-3
-
Received: 06 December 2023
-
Accepted: 12 September 2024
-
Published: 18 September 2024
-
DOI: https://doi.org/10.1038/s41467-024-52556-3
Comments
By submitting a comment you agree to abide by our Terms and Community Guidelines. If you find something abusive or that does not comply with our terms or guidelines please flag it as inappropriate.