Abstract
Recessive and de novo mutations in the TRIO gene are associated with intellectual deficiency (ID), autism spectrum disorder (ASD) and developmental epileptic encephalopathies (DEE). TRIO is a dual guanine nucleotide exchange factor (GEF) that activates Rac1, Cdc42 and RhoA. Trio has been extensively studied in excitatory neurons, and has recently been found to regulate the switch from tangential to radial migration in GABAergic interneurons (INs) through GEFD1-Rac1-dependent SDF1α/CXCR4 signaling. Given the central role of Rho-GTPases during neuronal migration and the implication of IN pathologies in ASD and DEE, we investigated the relative roles of both Trio’s GEF domains in regulating the dynamics of INs tangential migration. In Trio–/– mice, we observed reduced numbers of tangentially migrating INs, with intact progenitor proliferation. Further, we noted increased growth cone collapse in developing INs, suggesting altered cytoskeleton dynamics. To bypass the embryonic mortality of Trio–/– mice, we generated Dlx5/6Cre;Trioc/c conditional mutant mice (TriocKO), which develop spontaneous seizures and behavioral deficits reminiscent of ASD and ID. These phenotypes are associated with reduced cortical IN density and functional cortical inhibition. Mechanistically, this reduction of cortical IN numbers reflects a premature switch to radial migration, with an aberrant early entry in the cortical plate, as well as major deficits in cytoskeletal dynamics, including enhanced leading neurite branching and slower nucleokinesis reflecting reduced actin filament condensation and turnover as well as a loss of response to the motogenic effect of EphA4/ephrin A2 reverse signaling. Further, we show that both Trio GEFD1 and GEFD2 domains are required for proper IN migration, with a dominant role of the RhoA-activating GEFD2 domain. Altogether, our data show a critical role of the DEE/ASD-associated Trio gene in the establishment of cortical inhibition and the requirement of both GEF domains in regulating IN migration dynamics.
Introduction
Recessive and de novo mutations in the TRIO gene, encoding the triple functional domain protein, are associated with a spectrum of neurodevelopmental disorders (NDDs), including autism spectrum disorder (ASD), intellectual deficiency (ID) and developmental epileptic encephalopathies (DEE) [1,2,3,4,5,6,7]. Trio is a member of the large family of guanine nucleotide exchange factors (GEF), which promote the exchange of GDP for GTP to activate small Rho-GTPases [8]. Trio is composed of two distinct guanine nucleotide exchange factor (GEF) domains and a serine/threonine kinase (SRK) domain [9]. In neurons, Trio’s GEFD1 activates Rac1, RhoG and Cdc42 [10,11,12,13,14] while GEFD2 activates RhoA [14, 15]. Trio thus acts as a molecular switch that controls multiple small Rho-GTPases in response to a variety of environmental cues relevant to neuronal development. Recent functional studies of TRIO variants in heterologous cellular systems, cultured neurons and mutant mice suggest that most ASD/ID-associated variants involve the GEFD1 domain and reduce TRIO-GEFD1-dependant Rac1 activation [2,3,4, 6, 7, 16], although a few de novo sporadic variants result in an aberrant hyperactivation of Rac1 [4]. However, the network mechanisms by which TRIO mutations result in NDDs are unclear.
Trio is expressed ubiquitously and its loss in knock-out mice is embryonically lethal [17]. During development, Trio regulates the organization of the hippocampus [17], olfactory bulb [17] and hindbrain [18] and it controls the migration and morphology of cerebellar granule cells [13]. It is critical for the proper guidance of corticospinal axons [10] and thalamocortical axons through its regulation of corridor cell migration [15]. Trio also controls the maturation and function of glutamatergic neurons [1, 4, 7, 19] and was recently shown to participate in the migration of GABAergic interneurons (INs) [16]. At the molecular level, Trio GEFD1 controls cytoskeletal dynamics [13, 15] and the membrane trafficking of the Trio protein [20]. It also promotes axonal guidance and neurite outgrowth through netrin-1 induced activation of the Rac1/RhoG and Cdc42 pathways [10, 12, 14]. The GEFD2 domain controls axonal pathfinding through Slit2-induced activation of the RhoA pathway [15].
Given the embryonic lethality of Trio–/– mice [17], conditional mouse models have been used to study the impact of Trio deletions on specific neuronal populations. The targeted deletion of Trio in neural progenitor cells, using the Nestin-Cre driver line [21], results in early perinatal mortality and ataxia in survivors [13], mostly through a GEFD1-dependent cerebellar granule cell migration deficit [14]. The targeted deletion in cortical pyramidal cells, using the Emx1-Cre driver line [22, 23], results in a milder phenotype, with intact survival but abnormal hippocampal organization leading to spatial learning deficits [24], as well as impaired morphogenesis and migration of late-born cortical pyramidal cells [25]. Interestingly, the targeted deletion of Trio in INs was recently shown to induce an ASD-like phenotype [16], although the molecular, cellular and network mechanisms underlying this neurodevelopmental phenotype remain unclear.
Here, we show that the constitutive deletion of Trio in mice (Trio−/−) impairs the tangential migration of INs without affecting the proliferation of IN progenitors. Using a conditional genetic strategy, we then show that the specific prenatal deletion of Trio in mouse GABAergic INs (TriocKO) impairs cytoskeletal remodeling in tangentially migrating INs, with major contributions of the GEFD2-RhoA pathway, resulting in delayed tangential migration, reduced cortical inhibition, epilepsy and cognitive-behavioral deficits. Mechanistically, we find that Trio is a key regulator of the intrinsic dynamics of IN migration as it regulates their response to the motogenic effect of EphA4/Ephrin A2 reverse-signaling, ultimately determining the speed of migration and the final distribution of cortical INs, with a loss of both deep layer parvalbumin (PV)-positive (+) INs and superficial layer calretinin (CR)+ and vaso-intestinal peptide (VIP)+ INs. Furthermore, we find that Trio is required for Netrin-1/α3β1 integrins signaling in migrating INs. Loss of Netrin-1/α3β1 signaling in TriocKO mouse embryos results in a reduction of the superficial migratory stream due to a premature switch to radial migration towards the ventricular zone, a slowing of IN migration, a dispersion of the deep migratory stream, overall contributing to the loss of INs in the mature cortex. Together, our data support a critical role for Trio and the regulation of Rho-GTPases during the migration of INs as a critical disease mechanism in TRIO-associated NDD, including ASD and DEE.
Results
Trio is critical for the migration of GABAergic INs
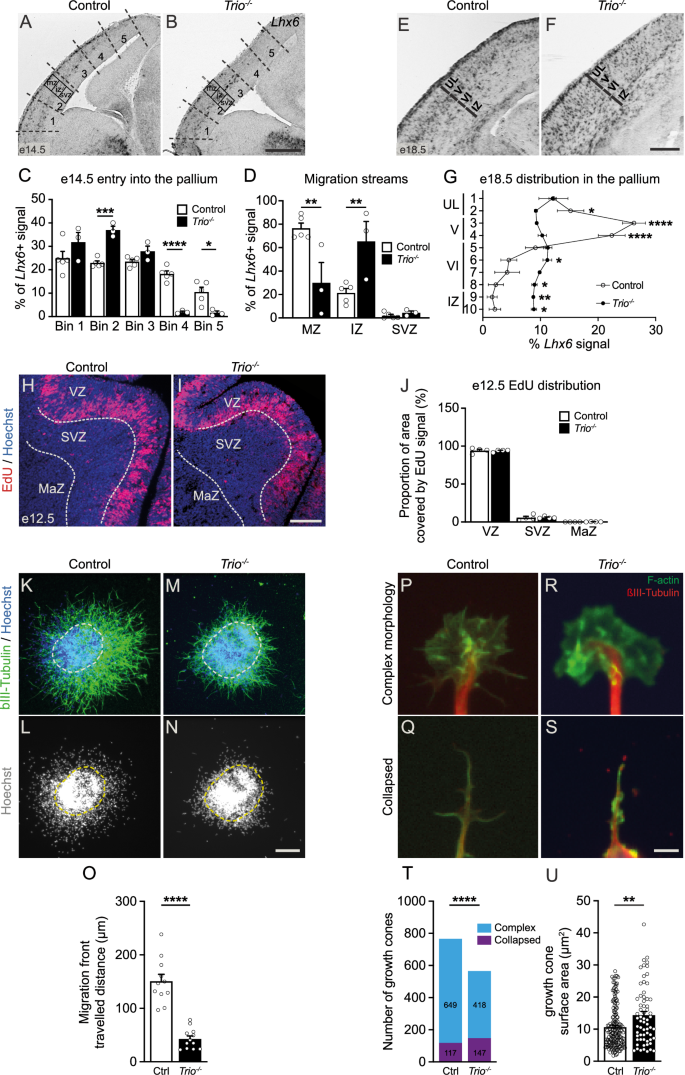
To investigate whether Trio plays a role in the early development and migration of GABAergic INs, we first quantified dorsally-migrating Lim homeobox 6 (Lhx6)-expressing INs in Trio knockout embryos (Trio−/−) using in situ hybridization to selectively label the sub-populations derived from the medial ganglionic eminence (MGE). We found that, in Trio–/– mutants, tangentially migrating Lhx6+ INs migrate shorter distances and remain in the most ventro-lateral bins of the dorsal pallium at e14.5 compared to INs in control embryos (Fig. 1A–C), with a striking reduction of the superficial migratory stream (Fig. 1A, B, D). Furthermore, we observe a disrupted laminar distribution of Lhx6+ GABAergic INs at e18.5, as they coalesce in the intermediate zone rather than in the primitive cortex in Trio–/– mutants compared to control littermates (Fig. 1E–G).

Lhx6 in situ hybridization on e14.5 coronal brain sections in control (A) and Trio–/– (B) embryos. C Histogram showing the distribution of Lhx6+ signal in the dorsal pallium of e14.5 control and Trio–/– embryos. Bins are delineated by the dotted lines in (A, B). D Histogram showing the radial distribution of Lhx6+ signal in the dorsal pallium of e14.5 control and Trio–/– embryos. Neocortical layers (MZ, IZ and SVZ) are delineated by the small boxes in (A, B) (n = 5 control and 3 Trio–/– embryonic brains). Lhx6 in situ hybridization on e18.5 coronal brain sections in control (E) and Trio-/- (F) embryos. G Lhx6+ signal distribution within the e18.5 somatosensory neocortical layers in control and Trio–/– embryos (n = 3 control and 3 Trio-/- embryonic brains). H–J Proliferation in the MGE is not affected at e12.5 in Trio–/– embryos. Representative images showing EdU incorporation (red) in MGE proliferative cells 2 h after EdU injection at e12.5, together with Hoechst staining (blue), in control (H) and Trio–/– embryos (I). J Histogram showing the percentage of the VZ, SVZ and MaZ area covered by EdU+ signal (n = 4 control and 4 Trio–/– embryonic brains). K–O Reduced migration of Trio–/– MGE-derived INs in MGE explant cultures. Representative immunofluorescence images of control (K, L) and Trio–/– (M, N) MGE explants generated at e14.5 and cultured for 48 h. O Histogram showing the mean maximal distance traveled by control and Trio–/– MGE-derived INs in cultured explants (n = 11 explants from 2 control brains and 12 explants from 2 Trio–/– brains, statistical comparisons conducted on the number of explants per genotypes). P–U Impaired growth cone morphology in Trio–/– MGE-derived INs. Representative illustrations for growth cone complex morphology (P, R) and collapsed morphology (Q, S) in control (P, Q) and Trio–/– (R, S) INs from MGE explants. T Histogram showing the number of control and Trio–/– MGE-derived INs with a complex or a collapsed morphology (n = 766 growth cones from 3 control brains and 565 growth cones from 3 Trio–/– brains). U Histogram showing the mean growth cone surface of control and Trio–/– MGE-derived INs with a complex morphology (n = 173 growth cones from 3 control brains and 65 growth cones from 3 Trio–/– brains). *P < 0.05, **P < 0.01, ***P < 0.001, ****P < 0.0001 by two-way ANOVA followed by Bonferroni’s multiple comparison’s test (C, D, G, J), by Mann–Whitney test (O, U) or by Fisher’s exact test (T). Data are represented as mean ± SEM, except for (T). CP cortical plate, Ctrl control, IZ intermediate zone, MaZ mantle zone, MZ marginal zone, SVZ subventricular zone, UL upper layer, VZ ventricular zone. Scale bars: 500 μm (B), 250 μm (F, I) 150 μm (N) and 10 μm (S).
Such a reduction in migrating INs could reflect a primary disruption of neuronal proliferation. To investigate this possibility, we pulse-labeled e12.5 embryos with 5-ethynyl-2’-deoxyuridine (EdU) and examined EdU incorporation in neural progenitor cells 2 h after injection. We found a similar distribution of dividing MGE progenitors in Trio–/– mutants and control littermates, suggesting that the deletion of Trio does not impair the proliferation of MGE-derived IN progenitors (Fig. 1H–J).
To better characterize the cell-autonomous mechanisms by which IN migration is impaired in Trio–/– embryos, we generated MGE explants from e14.5 mouse embryos that were cultured in collagen for 48 h. We analyzed both the cell body migration and leading processes extensions. While both control and Trio–/– MGE-cells had the capacity to migrate out of the MGE explants, we found that migrating Trio–/– MGE-cells traveled a shorter distance compared to control MGE-cells (Fig. 1K–O). Furthermore, Trio–/– MGE-cells in dissociated cultures exhibited an increased rate of growth cone collapse, while growth cones with a complex morphology occupied a larger surface than in control MGE-cells (Fig. 1P–U). These results suggest that the loss of Trio impairs the migration of GABAergic INs in part through altered growth cone cytoskeletal remodeling.
Trio deletion in GABAergic INs results in epilepsy with cognitive and behavioral deficits
To further study the requirement of Trio in INs and its relevance to the overall clinical phenotype, while bypassing the embryonic lethality of Trio–/– mice, we generated conditional knock-out mice (TriocKO) carrying a targeted deletion of Trio in GABAergic INs. Specifically, we bred Triolox/lox mice, in which exons 22–25 are flanked by two loxp sites [13], with Dlx5/6Cre;RCEEGFP mice, to selectively target telencephalic GABAergic INs [26, 27], while labeling Cre-expressing cells in green with the RCEEGFP reporter allele [28].
TriocKO animals are viable, although mutant mice appear smaller than their TrioWT littermates. TriocKO present an increased rate of early mortality, with 24% mortality before 6 months of age (N = 13/55 TriocKO from 10 litters, none in WT littermates), 70% of which occurs before P65 (median age P57). Further, we observed spontaneous seizures as early as P14 in TriocKO mice, although the frailty and small size of TriocKO mice prevented formal EEG recordings at this age. To better characterize the seizure phenotype, we recorded video-EEG for 72 h in surviving TriocKO mice at P30-P36 (Fig. 2A–C). These recordings revealed abundant interictal epileptic activity in all mutants, as well as spontaneous seizures in 3 out of 4 mutants recorded (Fig. 2B, C), with a mean seizure severity score of 3.4 ± 0.3 on the modified Racine scale (Fig. 2D), a mean seizure frequency of 2.0 ± 0.9 seizures per 72 h (Fig. 2E) and a mean seizure duration of 22.5 ± 2.3 seconds (Fig. 2F).
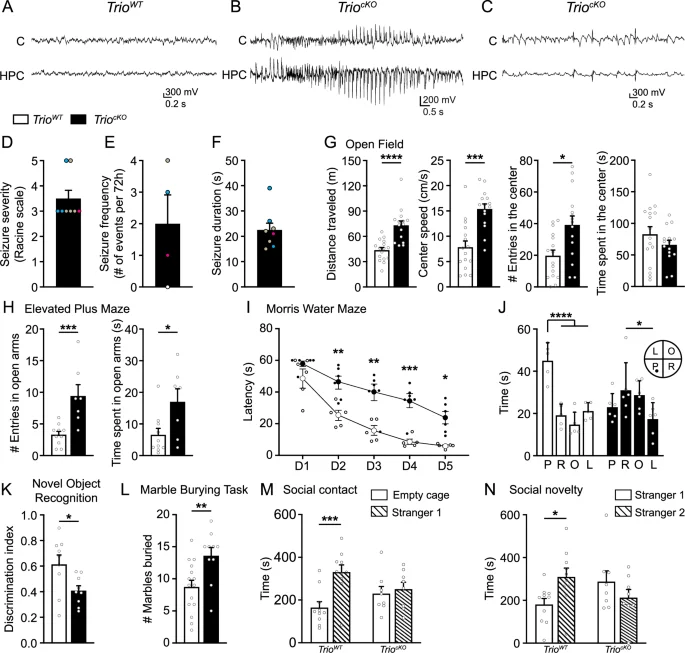
A–F Field potentials and seizure activity assessed with video-EEG recordings in P30-36 littermates. A Representative EEG traces for TrioWT and (B, C) TriocKO mice, showing a prolonged epileptiform discharge during a generalized tonic-clonic seizure (B) and abundant inter-ictal activity (C) in mutants. Recordings were performed using bilateral implanted cortical (C) and hippocampal (HPC) electrodes. For illustration purposes, recordings from single cortical (C) and hippocampal (HPC) fields are illustrated. Histograms displaying the seizure severity (Racine score) (D), frequency (E) and duration (F) for each animal (color-coded for individual mice) (n = 4 TrioWT and 4 TriocKO). G–N Behavioral deficits in TriocKO mice. G Histograms showing the distance traveled, the mean speed, the number of entries and the time spent in the center zone during the open field test (n = 16 TrioWT and 15 TriocKO mice). H Histograms showing the number of entries in the open arms (left) and the time spent in the open arms (right) in the elevated plus maze (n = 10 TrioWT and 7 TriocKO mice). I Line graph showing the escape latency in the Morris water maze during the acquisition phase (Day (D) 1 to D5). J Histogram showing the time spent in each quadrant of the Morris water maze during the probe test (P: platform quadrant, R: adjacent right quadrant, O: opposite quadrant, L: adjacent left quadrant) (n = 5 TrioWT and 6 TriocKO mice). K Histogram showing the discrimination index for a novel object over a familial object during the novel object recognition task (n = 9 TrioWT and 9 TriocKO mice). L Histogram showing the number of marbles buried during the Marble burying task (n = 15 TrioWT and 10 TriocKO mice). M Histogram showing the time spent with an empty cage or with another mouse (stranger 1) during the socialization phase of the three-chamber maze task and (N) Histogram showing the time spent with a familiar mouse (stranger 1) and a novel mouse (stranger 2) in the novelty phase of the three-chamber maze task (n = 10 TrioWT and 8 TriocKO mice). *P < 0.05, **P < 0.01, ***P < 0.001 and ****P < 0.0001, by Mann–Whitney test (G, H, K, L), two-way ANOVA followed by Bonferroni’s multiple comparisons test (I, M, N) or two-way ANOVA followed by Tukey’s multiple comparisons test (J).
To further characterize the clinical phenotype of TriocKO mice, we next examined their behavior in various paradigms (see methods for detailed genotypes). In the Open field, TriocKO mice displayed frank motor hyperactivity, with longer distances traveled and increased speed compared to TrioWT (Fig. 2G). Further, TriocKO mice displayed reduced anxiety in the Open Field, with increased numbers of entries in the center zone of the maze (Fig. 2G). This reduced fear of open spaces was confirmed in the Elevated plus maze, as TriocKO mice entered more frequently and spent more time in the open arms than their TrioWT littermates (Fig. 2H). Further, in the Morris water maze, TriocKO mice displayed striking spatial learning deficits, with increased escape latency in days 2–5 compared to TrioWT (Fig. 2I). TriocKO mice also displayed reduced spatial memory in the probe test: they spent as much time in all quadrants as in the target platform quadrant compared to TrioWT who spent more time in the expected target platform quadrant (Fig. 2J). In the novel object recognition task, TriocKO mice failed to adequately discriminate between novel and familiar objects (Fig. 2K), suggesting a reduction in novelty seeking in TriocKO mice compared to TrioWT. In addition, TriocKO mice presented increased repetitive behaviors in the marble-burying task: TriocKO animals buried nearly twice as many marbles as their TrioWT littermates (Fig. 2L). Finally, TriocKO mice presented reduced socialization skills in the three-chamber maze, spending as much time with an empty cage as with a live animal, as opposed to TrioWT mice who clearly prefer interacting with a live animal (stranger 1; Fig. 2M). TriocKO mice also spent as much time with a novel mouse (stranger 2) as with a familiar mouse (stranger 1; Fig. 2N), indicating a deficit in social novelty seeking. Taken together, these results suggest that the deletion of Trio in GABAergic INs induces an ASD and DEE-like phenotype in mice, with spontaneous seizures, hyperactivity, reduced anxiety (increased risk-taking behaviors), impaired novelty seeking, socialization deficits and increased repetitive behaviors, as well as spatial learning and memory deficits, reminiscent of many features of the disease in humans with TRIO-related ASD, ID and DEE [1,2,3,4,5,6,7].
Trio deletion disrupts the final laminar distribution of cortical GABAergic INs resulting in reduced cortical inhibition
To assess whether the targeted loss of Trio impacts the final numbers of cortical INs in TriocKO mice, we quantified fate-mapped cortical GABAergic INs in the somatosensory cortex (S1) of P21 TriocKO and TrioWT mice (Fig. 3A, B). We found a 15% net reduction of GFP+ cells in S1, particularly in layer I (23%), layer II-III (28%) and layer VI (20%) of TriocKO mice compared to TrioWT littermates (Fig. 3C, D). To assess which IN sub-populations were affected, we quantified the number of fate-mapped GFP+ INs that expressed either PV (Fig. 3E, F), somatostatin (SST) (Fig. 3I, J), CR (Fig. 3M, N), or VIP (Fig. 3Q, R). We found a 20% decrease in the density of PV-expressing INs in S1, particularly in layers V (22%) and VI (45%) of TriocKO mice, compared to TrioWT littermates (Fig. 3G, H). By contrast, the numbers of SST-expressing INs were unchanged in all cortical layers (Fig. 3K, L). Further, we found a 28% decrease in the density of CR+ INs in S1 of TriocKO mice, which was particularly evident in layer II-III (31%) and layer IV (33%), when compared to TrioWT littermates (Fig. 3O, P). We also found a 27% reduction in the density of VIP+ INs in layer II-III (Fig. 3S, T). Thus, the loss of Trio affects multiple populations of INs, with striking reductions in deep-layer PV-expressing INs and in superficial layer CR (but not SST)-expressing INs and VIP-expressing INs. By contrast, we found no change in the density of GFP+ cells in the striatum of TriocKO mice compared to TrioWT littermates (Supplementary Fig. 1), suggesting that the loss of INs in the cortex is unlikely to reflect mistargeting of tangentially migrating INs on their way to the dorsal pallium.
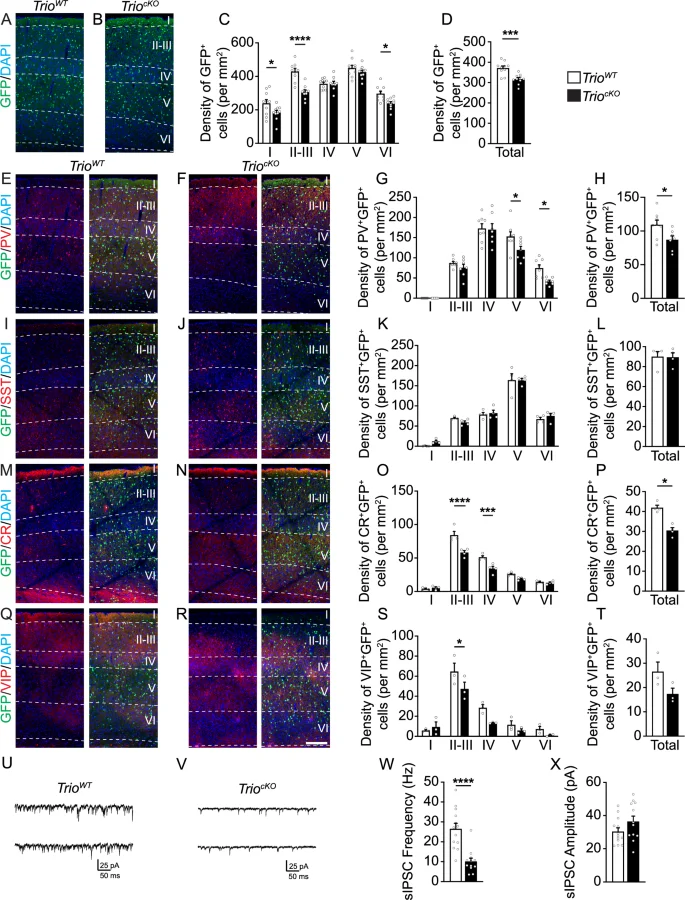
A–D Reduced density of GABAergic INs in the somatosensory cortex of TriocKO mice at P21. Examples of coronal brain sections showing fate-mapped GABAergic INs (GFP, green) and DAPI counterstaining (blue) at P21 in the somatosensory cortex of TrioWT (A) and TriocKO (B) mice. C, D Histograms showing the quantifications of fate-mapped GABAergic INs at P21 in the mouse somatosensory cortex. E–T Reduced density of deep layer PV-expressing INs and superficial layer CR- and VIP-expressing INs, but not SST-expressing INs, in the somatosensory cortex of TriocKO mice at P21. Immunofluorescence for PV (E, F), SST (I–J), CR (M, N) and VIP (Q, R) (red) with DAPI counterstaining (blue) and fate-mapped GABAergic INs (GFP, green) in the TrioWT (E, I, M, Q) and TriocKO (F, J, N, R) somatosensory cortex at P21. Histograms of corresponding quantifications are shown for PV+GFP+ INs (G, H), SST+GFP+ INs (K, L), CR+GFP+ INs (O, P) and VIP+GFP+ INs (S, T) (n = 10 TrioWT and 10 TriocKO brains for GFP quantifications; n = 8 TrioWT and 7 TriocKO brains for PV quantifications; n = 4 TrioWT and 4 TriocKO brains for SST and CR quantifications and n = 3 TrioWT and 3 TriocKO brains for VIP quantification). U–X Reduced cortical inhibition in TriocKO mice. Representative electrophysiological traces of sIPSCs in acute slices from TrioWT (U) and TriocKO (V) mice. Histograms showing the frequency (W) and amplitude (X) of sIPSCs (n = 13 cells from 4 TrioWT brains and 12 cells from 4 TriocKO brains). *P < 0.05, ***P < 0.001 and ****P < 0.0001, by two-way ANOVA followed by Bonferroni’s multiple comparisons test (C, G, K, O, S) or by Mann–Whitney test (D, H, L, P, T, W, X). Scale bar: 200 µm (N).
To assess whether this reduction of IN density results in functional alterations of cortical inhibition, we recorded spontaneous inhibitory post-synaptic currents (sIPSCs) in S1 layer V pyramidal cells in acute slices of P30 animals (Fig. 3U–X). We found a striking reduction in the frequency of sIPSCs in TriocKO animals compared to TrioWT littermates (Fig. 3W), while the amplitude of sIPSCs remained similar between TrioWT and TriocKO slices (Fig. 3X), compatible with a reduction of cortical IN numbers in adult TriocKO mice.
The conditional deletion of Trio impairs the tangential migration of INs with a premature switch to radial migration and a loss of the superficial migratory stream
To investigate whether prenatal alterations in IN migration contribute to this reduction of cortical INs in juvenile TriocKO mice, we conducted cellular quantifications of fate-mapped MGE-derived cells at various embryonic stages. We found that, as in Trio–/– null embryos, IN migration is significantly altered in TriocKO embryos compared to TrioWT littermates (Fig. 4). At e13.5, corresponding to the peak migration of MGE-derived INs (including PV- and SST-expressing INs), INs migrate more slowly, with a 48% (bin 4) to 96% (bin 5) reduction of INs reaching the medial dorsal pallium (bins 4–5) at this stage (Fig. 4A–C). We observe a premature switch towards a radial migration mode and a premature entry in the cortical plate of a subset of INs at e13.5 (Fig. 4D, E), although the majority ( > 80%) of INs remain in tangential migration at this time-point, even amongst those which have entered the cortical plate. Notably, we observed similar migration delays at e15.5 (Fig. 4F–K), corresponding to the peak migration age for CGE-derived INs (including CR- and VIP-expressing INs). We find a similar premature switch to radial migration of INs (Fig. 4L, M), together with a delayed migration of the still-tangentially migrating INs that fail to reach the medial dorsal pallium at this stage (Fig. 4N, O). Furthermore, we note a disorganization of the migratory streams, with a loss of the superficial marginal stream while the deep SVZ stream is preserved (Fig. 4P). Together, these data suggest that, in TriocKOembryos, tangentially migrating INs migrate more slowly than INs of TrioWT mice and that mutant INs fail to properly distribute across the dorsal pallium, resulting in a persistent reduction of cortical IN density at P21.
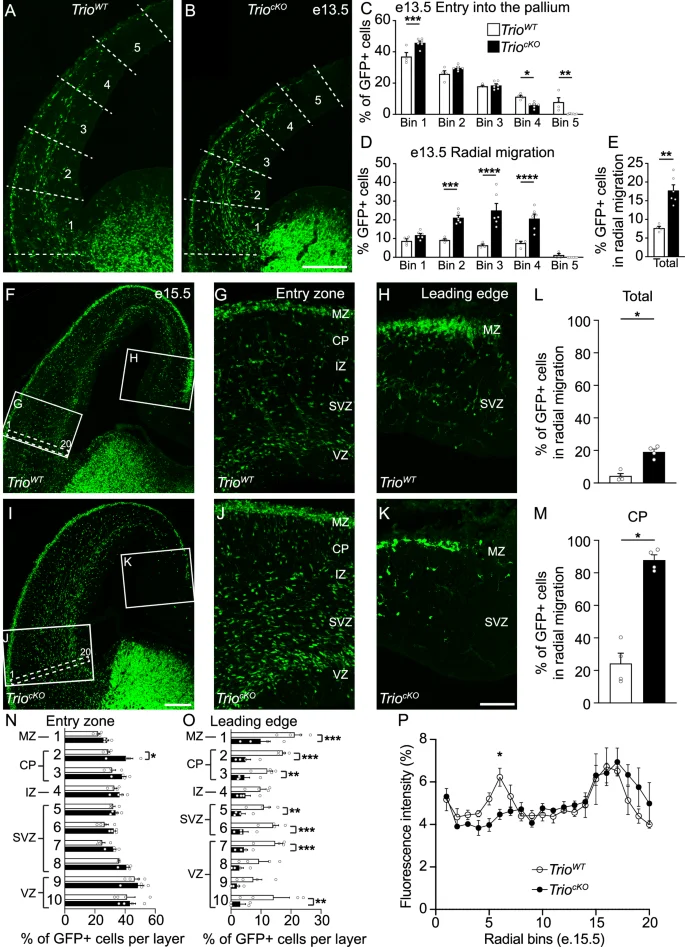
A–E GABAergic IN migration at e13.5 is delayed in TriocKO brains. Examples of immunostaining on coronal brain sections from e13.5 mouse embryos of (A) TrioWT and (B) TriocKO littermates, with binning strategy delineated by the dotted lines. C Histogram showing the distribution of GFP+ INs in the dorsal pallium of e13.5 TrioWT and TriocKO brains. Histograms showing the proportion of radially migrating GFP+ cells in the dorsal pallium at e13.5 across ventro-dorsal bins (D) and in the entire neocortex (E). (n = 4 TrioWT and 6 TriocKO brains). F–P Trio deletion in GABAergic INs delays tangential migration at e15.5 and induces a premature switch to radial migration mode. Examples of coronal brain sections from TrioWT (F) and TriocKO (I) littermates at e15.5. High magnifications of the entry zone (G, J) and the leading edge (H, K) are shown with the delimitation between the developing neocortical layers. L–M Histograms showing the proportion of radially migrating GFP+ INs in the entire neocortex (L) and in the cortical plate (CP) only (M). Histograms showing the proportion of GFP+ INs at e15.5 across the dorsal pallium in the entry zone (N) and the leading edge (O) between TrioWT and TriocKO brains. P Line graph showing the fluorescence intensity across the migratory streams at e15.5 at the neocortex entry zone (see the white dotted rectangle in inserts in F, I) between TrioWT and TriocKO mice. (n = 4 TrioWT and 3 TriocKO brains). *P < 0.05, **P < 0.01, ***P < 0.001, ****P < 0.0001, by Mann–Whitney (E, L, M) or two-way ANOVA followed by Bonferroni’s multiple comparisons test (C, D, N, O, P). Scale bars: 200 µm (B, I) and 50 µm (K).
Trio regulates the structural remodeling and dynamics of tangentially-migrating INs
To investigate the cellular mechanisms underlying the alterations of IN migration in TriocKO mutants, we next analyzed the morphology of developing INs in e13.5 TriocKO embryos and TrioWT littermates using 3-D neuronal reconstructions of cortical fate-mapped GFP-expressing GABAergic INs on fixed cryosections (Fig. 5A, B). We found that, in TriocKO animals, migrating INs displayed a multipolar morphology, with more numerous leading and trailing neurites, and a larger cell body (Fig. 5C, D, G). Further, TriocKO INs displayed excessively long and complex leading neurites and more complex trailing neurites compared to INs of TrioWT mice (Fig. 5E, F, H, I).
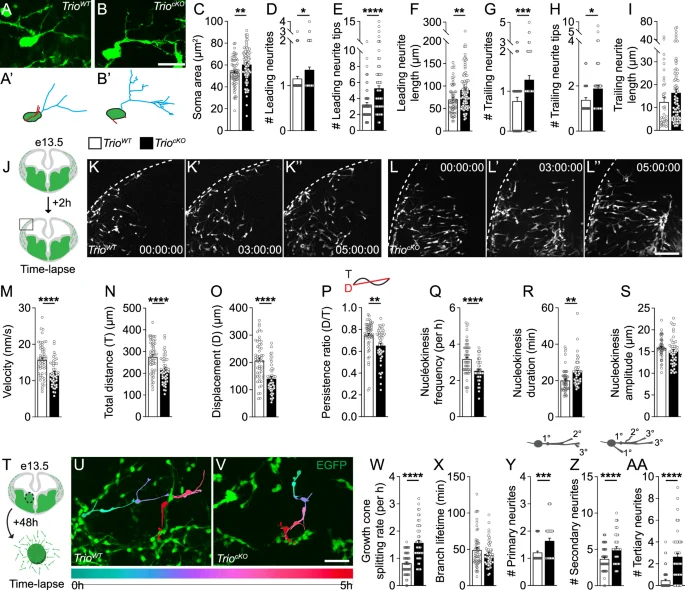
A–I The morphology of GABAergic INs at e13.5 is impaired in TriocKO brains. Examples of GFP+ fate-mapped cortical INs imaged at the migratory front in 50 µm-thick coronal brain sections from TrioWT (A) and TriocKO (B) littermates at e13.5, with their respective 3D reconstruction (A’, B’). Histograms showing measurements for (C) cell body area, (D) number, (E) complexity and (F) length of leading neurites, as well as (G) number, (H) complexity and (I) length of trailing neurites. (n = 64 cells from 3 TrioWT brains and 94 cells from 4 TriocKO brains). J–S GABAergic IN migration and branching dynamics are impaired in TriocKO embryonic brains. (J) Schematic of the experimental design for live-imaging of e13.5 organotypic brain slices after 2 h in culture. Time-lapse sequences showing the migration of GFP+ INs in organotypic brain slices from TrioWT (K-K”) and TriocKO (L-L”) mouse embryos. (M–S) Histograms showing (M) the migration speed, (N) the total distance, (O) the net displacement, (P) the directionality, as well as (Q) nucleokinesis frequency, (R) duration and (S) amplitude of TrioWT and TriocKO GFP+ INs (n = 53 cells from 3 TrioWT brains and 46 cells from 3 TriocKO brains). T Schematic of the experimental design for the live-imaging of MGE explant cultures. Time-lapse sequences showing the migration and branching of (U) GFP+ TrioWT and (V) TriocKO INs in MGE explant cultures. W Histograms showing the frequency of growth cone splitting and (X) the lifetime of newly formed branches during migration. Y–AA Histograms showing the branch order classification during migration (n = 57 GFP + MGE-INs from 3 TrioWT brains and 50 GFP + MGE-INs from 3 TriocKO brains). See also Supplementary Fig. 2 for data on migration dynamics and nucleokinesis in explants. *P < 0.05, **P < 0.01 and ****P < 0.0001, by Student’s t test. Scale bars: 20 µm (A), 100 µm (L”) and 50 µm (V).
To further investigate the impacts of the loss of Trio on IN migration dynamics, we conducted time-lapse imaging of fate-mapped GFP-expressing cells in acute organotypic brain slices of TriocKO and TrioWT e13.5 embryos (Fig. 5J–L and Supplementary movies 1–2). We observed that the dynamics of the migration of tangentially-migrating TriocKO INs were significantly impaired compared to those of TrioWT INs. Indeed, we find a significant reduction in the mean velocity (Fig. 5M), the total distance traveled (Fig. 5N), the net displacement (Fig. 5O), the directionality (i.e. increased meandering) (Fig. 5P), and the frequency of nuclear translocations (Fig. 5Q) of TriocKO INs compared to TrioWT INs. Nucleokinesis cycles in TriocKO INs were of longer duration (Fig. 5R) but their amplitude was unchanged compared to those of TrioWT INs (Fig. 5S).
We next examined branching dynamics in migrating INs of TriocKO and TrioWT embryos. Imaging of INs in organotypic slices does not provide sufficient resolution to analyze branching dynamics, given the tendency of INs to move out of the field of view. Therefore, we used MGE explants from TrioWT and TriocKO e13.5 brains, maintained in culture for 48 h before live-cell imaging (Fig. 5T–V and Supplementary movies 3–4). First, we observed deficits in the migration dynamics of TriocKO INs migrating out of MGE explants compared to TrioWT INs (Supplementary Fig. 2A–F), akin to what we had observed in TriocKO INs migrating in acute slices. In addition, we observed significant alterations in branching dynamics in TriocKO INs, with an increased growth cone splitting rate (Fig. 5W), but preserved mean lifetime of transient branches (Fig. 5X), together leading to a net increase in persistent new branches. Further, we observed an increased number of primary, secondary and tertiary neurites (Fig. 5Y–AA), consistent with the morphological deficits observed in fixed e13.5 TriocKO brains. Altogether, our results suggest that Trio is a critical regulator of IN morphology and migration, with significant roles in the control of IN nucleokinesis and branching dynamics.
TrioGEFD2-mediated RhoA activation regulates the morphological development of INs
The active branching and remodeling of the leading process in response to environmental cues helps guide the migration of INs [29, 30]. This process involves the activation of Rho-GTPases at the tip of the leading process, including RhoA, Rac1 and Cdc42, by GEF proteins such as Trio [30,31,32,33]. To dissect the contribution of each GEF domain to the processes involved in IN morphological remodeling and migration, we conducted a series of ex utero rescue experiments in TriocKO mouse embryos by electroporating a control Dlx5/6::mCherry plasmid together with (1) the full-length Trio cDNA (TrioF-L); (2) a mutated version of Trio cDNA lacking the GEF1 domain, but with an intact GEF2 domain presumably able to activate RhoA (TrioΔGEFD1); or (3) a mutated version of Trio cDNA lacking the GEF2 domain, but with an intact GEF1 domain presumably able to activate Rac1/RhoG/Cdc42 (TrioΔGEFD2), followed by MGE explant cultures (Fig. 6A–E’). The explants were cultured for 48 h, imaged with high-resolution time-lapse imaging for 5 h and fixed and processed for 3D reconstructions.
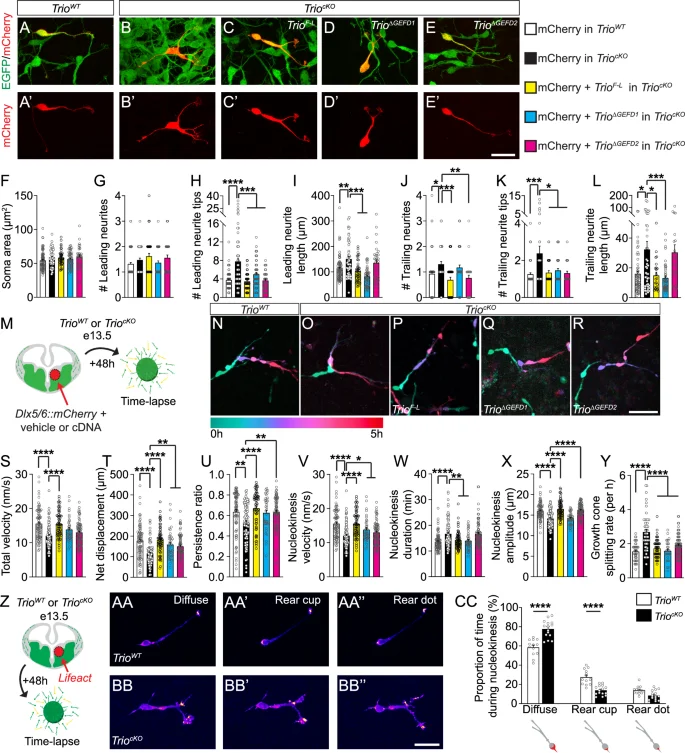
A–E’ Confocal images of (A-A’) TrioWT INs in MGE explants cultures electroporated with a control Dlx5/6::mCherry construct (mCherry), (B-B’) TriocKO INs in MGE explant cultures electroporated with mCherry or TriocKO INs in MGE explant cultures electroporated with mCherry together with (C-C’) full-length Trio cDNA (TrioF-L), (D-D’) a mutated version of the Trio cDNA lacking the GEFD1 (TrioΔGEFD1) or (E-E’) a mutated version of the Trio cDNA lacking the GEFD2 (TrioΔGEFD2). Histograms of (F) the soma area, (G) the number, (H) complexity and (I) length of leading neurites, as well as (J) the number, (K) complexity and (L) length of trailing neurites, following rescue with TrioF-L (yellow bars), TrioΔGEFD1 (blue bars) or TrioΔGEFD2 cDNA (pink bars) (n = 82 GFP + MGE-INs from 5 TrioWT brains electroporated with mCherry, 49 GFP + MGE INs from 4 TriocKO brains electroporated with mCherry, 42 GFP + MGE-INs from 3 TriocKO brains co-electroporated with mCherry and TrioF-L, 52 GFP + MGE-INs from 6 TriocKO brains co-electroporated with mCherry and TrioΔGEFD1 and 34 GFP + MGE-INs from 4 TriocKO brains co-electroporated with mCherry and TrioΔGEFD2). M–Y Both GEF domains are required to fully rescue IN migration. M Schematic of the experimental procedure to rescue IN migration and branching. N Time-lapse color-coded sequences showing a TrioWT GFP + MGE-IN electroporated with mCherry, (O) a TriocKO GFP + MGE-IN electroporated with mCherry, (P) a TriocKO GFP + MGE-IN co-electroporated with mCherry and TrioF-L, (Q) a TriocKO GFP + MGE-IN co-electroporated with mCherry and TrioΔGEFD1 and (R) a TriocKO GFP + MGE-IN co-electroporated with mCherry and TrioΔGEFD2. S–Y Histograms showing the rescue of (S) total migration speed (velocity), (T) net displacement (U) persistence ratio (directionality), (V) nucleokinesis cycle speed (W) nucleokinesis cycle duration and (X) nucleokinesis cycle amplitude (n = 81 GFP + MGE-INs from 5 TrioWT brains electroporated with mCherry, 88 GFP + MGE-INs from 6 TriocKO INs electroporated with mCherry, 65 GFP + MGE-INs from 3 TriocKO brains co-electroporated with mCherry and TrioF-L, 38 GFP + MGE-INs from 3 TriocKO brains co-electroporated with mCherry and TrioΔGEFD1 and 76 GFP + MGE-INs from 4 TriocKO brains co-electroporated with mCherry and TrioΔGEFD2). (Y) Histogram showing the rescue of the growth cone splitting rate (n = 42) GFP + MGE-INs from 3 TrioWT brains electroporated with mCherry, 51 GFP + MGE-INs from 4 TriocKO brains electroporated with mCherry, 52 GFP + MGE-INs from 3 TriocKO brains co-electroporated with mCherry and TrioF-L, 29 GFP + MGE-INs from 3 TriocKO brains co-electroporated with mCherry and TrioΔGEFD1 and 69 GFP + MGE-INs from 4 TriocKO brains co-electroporated with mCherry and TrioΔGEFD2. Z–CC Conditional deletion of Trio in GABAergic INs reduces actin remodeling. Z Schematic of the experimental design used to live-track actin dynamics in MGE-INs. AA-BB” Time-lapse sequences showing the distribution of F-actin (fire mode) in a TrioWT (AA-AA”) and a TriocKO (BB-BB”) GFP + MGE-IN after electroporation of the Lifeact construct. CC Histogram showing the distribution of F-actin in the soma of GFP + MGE-INs (n = 13 GFP + MGE-INs from 3 TrioWT brains and 15 GFP + MGE-INs from 4 TriocKO brains). *P < 0.05, **P < 0.01, ***P < 0.001 and ****P < 0.0001 by one-way ANOVA followed by Tukey’s multiple comparisons tests (F–L, S–Y), or two-way ANOVA followed by Bonferroni’s multiple comparisons test (CC). Note that, with the exception of (S, V), whenever TriocKO MGE-INs electroporated with TrioF-L, TrioΔGEFD1 or TrioΔGEFD2 were statistically different from TriocKO MGE-INs electroporated with mCherry (statistical differences currently showed on the figure), they were also not different from TrioWT MGE-INs electroporated with mCherry. Thus, for better clarity, only comparisons with TriocKO INs electroporated with mCherry (black column) are shown in (F–L) and (S–Y), but p-values for all comparisons can be found in Supplementary Table 1. Scale bars: 25 µm (E, BB”) and 50 µm (R).
On the fixed explants, we confirmed that, as before, TriocKO INs electroporated with the control Dlx5/6::mCherry plasmid displayed significant morphological deficits compared to electroporated INs of TrioWT mice; with longer and more complex leading and trailing neurites, along with an increased number of trailing neurites (Fig. 6F–L). Further, the co-electroporation of the Dlx5/6::mCherry plasmid with the TrioF-L construct in TriocKO INs rescued these morphological deficits (Fig. 6F–L, yellow bars), confirming that Trio loss-of-function in INs was indeed responsible for the morphological deficits reported above. Interestingly, the expression of the TrioΔGEFD1 cDNA in TriocKO INs also rescued most of the morphological deficits, including the increased leading and trailing neurite complexity and length, suggesting an important role for the RhoA-activating GEFD2 domain in these processes (Fig. 6F–L, blue bars). Conversely, the expression of the TrioΔGEFD2 cDNA rescued the complexity of the leading and trailing neurites, as well as the number of trailing neurites, but not the leading and trailing neurite length (Fig. 6F–L, pink bars). Thus, our data suggest a requirement of the GEFD2-RhoA pathway for the proper regulation of leading and trailing process morphology in tangentially migrating INs, with a redundant contribution from the GEFD1-Rac1/Cdc42 pathway in controlling leading and trailing neurite complexity.
Trio GEFD1 and GEFD2 domains redundantly control leading neurite branching dynamics, but both are required for proper cortical IN migration
We next analyzed the requirement of Trio-GEFD1 and Trio-GEFD2 in rescuing the dynamics of neurite remodeling and migration by analyzing time-lapse imaging of the electroporated MGE explants described above (Fig. 6M–R and Supplementary movies 5–7). As before, TriocKO INs electroporated with the control Dlx5/6::mCherry plasmid displayed several deficits in migration dynamics when compared to TrioWT INs, as well as impairments in the leading process branching dynamics (Fig. 6S–Y and Supplementary Fig. 2H–O). As expected, the expression of the TrioF-L plasmid in TriocKO INs rescued most aspects of the migration and branching dynamics deficits (Fig. 6S–Y and Supplementary Fig. 2H–O, yellow bars).
When investigating the contribution of each GEF domain to the migration and branching dynamics, we observed that deficits in the duration of nucleokinesis cycles (Fig. 6W) and in the number of primary neurites (Supplementary Fig. 2M) induced by Trio conditional deletion were exclusively rescued by the electroporation of the TrioΔGEFD1, whereas impairments in migration directionality (Fig. 6U) and nucleokinesis amplitude (Fig. 6X) were exclusively rescued by the TrioΔGEFD2. As a result, electroporation of either TrioΔGEFD1 or TrioΔGEFD2 rescued the net soma displacement (Fig. 6T), as well as the frequency of growth cone splitting (Fig. 6Y) and the number of third order neurites (Supplementary Fig. 2O), and partially rescued nucleokinesis cycle velocity (Fig. 6V and Supplementary Table 1), suggesting a redundancy in controlling these specific dynamic processes. However, neither construct was able to rescue the global migration velocity (Fig. 6S), the total distance (Supplementary Fig. 2H) nor the nucleokinesis cycle frequency by itself (Supplementary Fig. 2I). Altogether, these data suggest that the two GEF domains exert a complementary control over different aspects of migration and branching dynamics, with some redundancy in terms of net displacement, nucleokinesis velocity and growth cone splitting (summarized in Supplementary Fig. 3). Nonetheless, both domains are required for the proper net migration of GABAergic INs.
Trio controls IN migration by regulating actin cytoskeleton remodeling
Nucleokinesis, which involves a translocation of the nucleus in the leading process, is regulated by actin remodeling and actomyosin contractions at the rear of the cell body [29, 34,35,36]. Thus, we investigated the impact of Trio deletion on actin remodeling in GABAergic INs by generating MGE explants from TrioWT and TriocKO e13.5 embryos after ex utero MGE electroporation of the Lifeact plasmid (Fig. 6Z). During IN migration, F-actin can be found in the cell body either in a non-polarized diffuse state, forming a cup at the rear of the cell body in preparation for actomyosin contraction, or condensed in a dot at the rear of the cell body, just before nuclear translocation (Fig. 6AA–BB) [36, 37]. In migrating TriocKO INs, F-actin distribution remains diffuse, largely failing to form a rear cup, when compared to TrioWT INs (Fig. 6CC, Supplementary movies 8–9). Together, these data suggest that Trio controls actin turnover as well as its localization in order to promote the actomyosin contractions necessary for successful and rapid nucleokinesis. Thus, mislocalization of polymerized actin and failed actomyosin contractions in TriocKO INs likely contribute to the slower and inefficient nucleokinesis observed in TriocKO INs, and likely reduces the speed and distance traveled by tangentially migrating INs in TriocKO mice.
Trio mediates Netrin-1 and EphA4 signaling in migrating INs
The tangential migration of GABAergic INs relies upon several guidance cues that guide INs towards their final destination in the neocortex [38, 39]. We focused our attention on two such signals, Slit-2 and Netrin-1, both expressed along the path of IN migration and known to implicate RhoGTPase signaling. Slit-2 is expressed in the ventral VZ and repulses MGE-IN expressing Robo-1 receptors in vitro [40, 41] (although it is dispensable in vivo [42]). Slit-2 also promotes axonal pathfinding through Trio-GEFD2 mediated RhoA activation [15]. Netrin-1, expressed at the ventral VZ, also repels MGE-INs upon ligation to the DCC receptor. Furthermore, in the dorsal IZ and MZ, Netrin-1 activates IN migration and regulates the formation of the superficial migratory stream through binding to the α3β1 integrins [43] (as reviewed in [44]).
To investigate whether Trio regulates the response of INs to these molecular cues, we performed a series of migration assays in e13.5 MGE-derived TrioWT and TriocKO INs following treatment with Slit-2, Netrin-1 or vehicle (Fig. 7A–G). As expected, Slit-2 repulses TrioWT INs, but also TriocKO INs, as demonstrated by a similar reduction of the proportion of MGE cells migrating towards the Slit-2 containing chamber, compared to their migration towards a vehicle-containing chamber in the Boyden assay (Fig. 7A). By contrast, Netrin-1 attracts TrioWT MGE cells, but not TriocKO MGE cells, as demonstrated by an increased migration index in TrioWT but not TriocKO MGE cells in the Boyden assay (Fig. 7B). Furthermore, when applied to e13.5 MGE explants, Netrin-1 enhanced the migration radius of INs after 48 h in TrioWT, but not in TriocKO (Fig. 7C–G). Together, these data suggest that Trio is required to mediate chemoattraction to Netrin-1, but not chemorepulsion to Slit-2, in migrating INs.
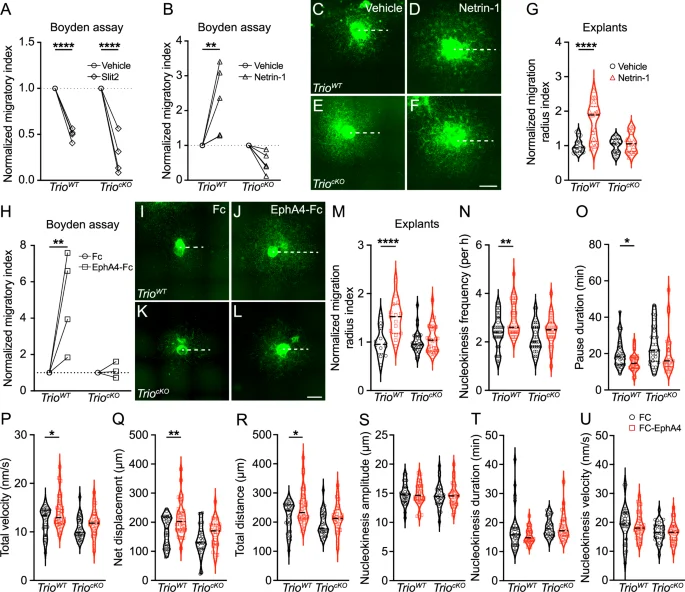
Graphs showing the normalized migratory index of dissociated TrioWT and TriocKO MGE-INs in Boyden chamber assays following treatment with vehicle or Slit-2 (A), or with vehicle or Netrin-1 (B). (n = 5 experiments for TrioWT and 6 experiments for TriocKO MGE-INs treated with vehicle, Netrin-1 or Slit-2). Examples of fluorescence images of TrioWT and TriocKO MGE explants cultures 48 h after treatment with either vehicle (C, E) or Netrin-1 (D, F). Dotted lines illustrate the migration radius on each explant. G Violin-box graph showing the normalized migration radius index of MGE-INs migrating out of TrioWT and TriocKO explants 48 h after treatment with Netrin-1. (n = 11 MGE explants from 3 TrioWT brains and 13 MGE explants from 3 TriocKO brains treated with vehicle and 26 MGE explants from 3 TrioWT brains and 16 MGE explants from 3 TriocKO brains treated with Netrin-1). H Graph showing the normalized migratory index of dissociated TrioWT and TriocKO MGE-INs in Boyden chamber assays following treatment with human protein FC or FC-EphA4. (n = 4 experiments for TrioWT and 3 experiments for TriocKO MGE-INs treated with human FC or FC-EphA4 protein). Examples of fluorescence images of TrioWT and TriocKO MGE explants cultures 48 h after treatment with either human protein FC (I, K) or FC-EphA4 (J, L). M Violin-box graphs showing the normalized migration radius index of MGE-INs migrating out of TrioWT and TriocKO explants 48 h after treatment with human protein FC or FC-EphA4 (n = 17 MGE explants from 4 TrioWT brains and 30 MGE explants from 6 TriocKO brains treated with human FC protein and 18 MGE explants from 4 TrioWT brains and 28 MGE explants from 6 TriocKO brains treated with human FC-EphA4). Violin-box graphs showing TrioWT and TriocKO MGE-INs migration dynamics following treatment with human protein FC or FC-EphA4, including nucleokinesis frequency (N), pause duration (O), total migration velocity (P), net displacement (Q), total traveled distance (R) and nucleokinesis amplitude (S), duration (T) and velocity (U). (n = 32 MGE-INs from 3 TrioWT brains and 29 MGE-INs from 3 TriocKO brains treated with human FC protein and 34 MGE-INs from 3 TrioWT brains and 28 MGE-INs from 3 TriocKO brains treated with human FC-EphA4). *P < 0.05, **P < 0.01, ****P < 0.0001 by two-way ANOVA followed by Bonferroni’s multiple comparisons test. For better clarity, only comparisons between treatments for each genotype were made. Scale bars: 500 µm.
Other cues along the path of IN migration exert an active prokinetic/motogenic effect that accelerates the dynamics of IN migration. In particular, EphA4/ephrin A2 reverse signaling actively promotes IN migration: ephrin A2 ligand expressed by INs activates an intracellular cascade in INs when binding to EphA4 receptors expressed by cells on the path of migration in the dorsal IZ and MZ at e15.5 [45, 46]. To investigate whether Trio participates in EphA4-mediated reverse signaling in INs, we performed a series of migration assays using the EphA4-Fc chimera protein, a dimerized EphA4-FC receptor moiety capable of activating reverse signaling through binding to ephrin A2 in migrating INs in vitro. Treatment with EphA4-Fc enhanced the migration of TrioWT MGE cells towards the experimental chamber of the Boyden assay compared to TrioWT MGE cells exposed to the human IgG Fc fragment. By contrast, TriocKO MGE cells did not respond to the motogenic effect of EphA4-Fc, resulting in a similar migration index when compared to TriocKO MGE cells exposed to the control human IgG Fc fragment (Fig. 7H). To further investigate this mechanism, we evaluated the response to EphA4-mediated chemotaxis in MGE explants cultured for 48 h with either EphA4-Fc chimera or the inert human IgG Fc fragment. As observed in the Boyden chambers assays, treatment of TrioWT explants with EphA4-Fc chimera for 48 h increased the migration radius of INs, when compared to TrioWT explants treated with human IgG Fc fragment. By contrast, the migration radius of TriocKO INs remained similar between the two treatment conditions (Fig. 7I–M), suggesting that Trio is required during both acute and chronic EphA4-mediated reverse-signaling chemotaxis in INs.
Given the prokinetic effect of EphA4 signaling during INs tangential migration, we next evaluated its impact on the dynamics of migration in MGE explants treated with either EphA4-Fc chimera or human IgG Fc fragment and cultured for 48 h (Supplementary movies 10–13). In TrioWT MGE explants, exposure to EphA4-Fc chimera increased the frequency of nucleokinesis (Fig. 7N) and decreased the duration of pauses between nucleokinesis cycles (Fig. 7O), thereby accelerating the migration of GABAergic INs, as reflected by the increased total velocity (Fig. 7P), net displacement (Fig. 7Q) and total traveled distance (Fig. 7R) compared to treatment with the human IgG Fc fragment. However, it did not impact nucleokinesis cycles amplitude, duration or velocity (Fig. 7S–U). Interestingly, in TriocKO MGE explants, treatment with EphA4-Fc chimera had no impact on any of these migration parameters when compared to treatment with human IgG Fc fragment (Fig. 7N–U), indicating that TriocKO INs are insensitive to the motogenic effect of EphA4 reverse signaling. Altogether, our data reveal that, beyond its role in regulating the switch from tangential to radial migration, Trio is a critical hub regulator of the intracellular response to a range of prokinetic and chemoattractive cues that determine the net speed of migration and the intrinsic kinetic properties of tangentially migrating INs.
Discussion
This study identifies the dual GEF Trio protein as a major regulator of the morphological development and migration of cortical GABAergic INs, suggesting that major features of TRIO-associated NDDs reflect a developmental interneuronopathy. In particular, we find that the deletion of Trio in GABAergic INs results in spontaneous seizures and ASD-like behaviors in TriocKO mutant mice. This phenotype is largely attributable to a delayed migration of INs, resulting in reduced PV + , VIP+ and CR + IN numbers in the mature cortex, together with decreased cortical inhibition in mutant mice. Mechanistically, we find that the deletion of Trio alters the branching and nucleokinesis dynamics during IN tangential migration. While Trio GEFD1 and GEFD2 independently regulate specific steps of IN migration, both are required to fully rescue the migration dynamics. Notably, we observe disruptions of actin remodeling, with deficits in actin polymerization and actomyosin contractions, slowing nucleokinesis in TriocKO INs. Furthermore, we find that this delay in tangential migration reflects a lack of response to a variety of guidance cues, notably to Netrin-1, which usually attracts INs to the superficial migratory stream and activates their migration, and to EphA4/Ephrin A2-reverse signaling that typically exerts a motogenic effect on dorsally migrating INs. Altogether, our findings suggest that TRIO-associated NDDs are developmental interneuronopathies, with both GEF domains playing critical roles during IN migration, and that Trio is a central hub regulator of a variety of chemogenic and motogenic cues required to promote adequate IN migration.
Interneuronopathies in NDDs
Human de novo and recessive TRIO mutations result in a spectrum of NDDs, including early-onset DEE and/or ASD with or without ID [1,2,3,4,5,6]. The mechanisms underlying these clinical phenotypes are not fully understood. Our results suggest that the loss of Trio is particularly detrimental to the tangential migration of GABAergic INs, as also suggested by others [16], and that its selective deletion in INs suffices to impair cortical inhibition and to induce epilepsy and ASD-like phenotypes in mice. This finding expands a growing body of evidence suggesting that a primary deficit of cortical inhibition, and particularly of PV-expressing INs (PV-INs), results in epilepsy and ASD-like behavior in rodents [47,48,49,50,51]. PV-INs are the main inhibitory targets of thalamocortical afferents and they provide strong and rapid synaptic inhibition on the soma of adjacent pyramidal cells [52,53,54,55,56,57,58]. Thus, the deletion of genes involved in the specification [59], proliferation [60], migration and maturation [26, 48, 61,62,63,64,65], excitability [66,67,68,69] or synaptic function [49, 50, 70] of PV-INs results in epilepsy and cognitive deficits in mice. Furthermore, PV-INs participate in the generation of gamma oscillations, critical for cortical processing [71, 72], attention [73] and memory [74]. Disruption of gamma oscillations thus contributes to the array of cognitive and behavioral deficits associated with PV-INs impairments [47, 51, 65, 70, 75], including in TriocKO mice.
Deficits in other IN subtypes, particularly the reduction of superficial cortical layer CR- and VIP-expressing INs in TriocKO mice likely also contribute to the overall phenotype. Indeed, CR/VIP-expressing INs orchestrate cortical synchrony through local and long-range disinhibition [76] and dysfunction of VIP-INs results in ASD/DEE phenotypes in rodents [77, 78].
Surprisingly, our quantification results contradict the findings reported by Sun et al. [16], who did not observe a reduction of IN densities in the somatosensory cortex of Dlx5/6Cre;Trioc/c mice. Methodological differences, most notably our reliance on genetic fate-mapping to label all INs from the Dlx5/6 lineage rather than tracking transgenic Dlx5/6 expression (Dlx5/6Cre-IRES-EGFP) [16], and the increased statistical power in our study likely contributed to our findings of notable differences in IN densities in the somatosensory cortex. Further, Sun et al. [16] did not observe spontaneous seizures but found a reduced threshold to PTZ-induced seizures in Dlx5/6Cre;Trioc/c mice. This difference may stem from age differences in the study populations. Indeed, our study was conducted in early adult mice (P21-P30), while Sun et al. investigated older adult mice (P35-P60). A transient developmental window for seizure susceptibility occurs between P20-P25 in various models of PV-IN dysfunction, with reduced seizure susceptibility at later stages (P33-45) [49, 50, 70, 79,80,81]. By contrast, neurocognitive deficits persist into adulthood [70, 82], suggesting that early disruption of PV-INs development results in long-lasting impacts on cognition and behavioral control.
Impaired tangential migration as a disease mechanism for Trio-associated NDD
Trio is a key regulator of the development [1, 7, 14], migration [13, 15] and synaptic function of excitatory neurons [4, 7, 19]. As discussed in the sections below, our findings and those of Sun et al. [16] suggest that Trio is also a critical regulator of the morphological development and migration of GABAergic INs, in addition to many other well-described molecular actors (reviewed in [32, 47]).
Trio regulates the switch to radial migration and the integrity of the superficial migratory stream through SDF1/CxCr4 and Netrin-1/α3β1 integrin signaling
Our findings, aligned with those of Sun et al. [16], reveal that, in the absence of Trio, tangentially migrating INs switch rapidly to a radial migration mode, leading to a premature entry in the cortical plate. This reflects, in part, a loss of response to SDF1/CxCr4 signaling in Trio cKO INs [16]. Indeed, SDF1/CxCr4 signaling typically repels INs from the cortical plate, in a GEFD1/Rac1-dependant manner [16, 83, 84], until they down-regulate the CxCr4 receptor Cxcr12 [85, 86]. Nonetheless, this premature entry in the cortical plate fails to explain the extent of dynamic deficits observed in the 80% of INs still migrating tangentially in TriocKO mutants at e13.5 and e15.5, suggesting that other mechanisms are also at play.
Notably, we find that TriocKO MGE cells do not respond adequately to Netrin-1. The distinctive migration pattern of MGE-derived INs in e13.5 and e15.5 TriocKO mutants is consistent with a lack of response to Netrin-1/α3β1 integrins signaling, resulting in misplacement of tangentially migrating INs that fail to migrate in the superficial marginal stream but rather coalesce in the deeper migratory stream, a pattern similar to the one reported in α3β1 cKO mice on a Netrin-1 null background [43]. Furthermore, as observed in TriocKO mutants, loss of Netrin-1/α3β1 signaling in α3β1 conditional mutant mice on a Netrin-1 null background also results in an apparent increase of radial migration as INs descend towards the VZ instead of remaining tangentially oriented in the more superficial stream [43]. This loss of proper directionality further delays their migration towards more medial dorsal pallial regions. Furthermore, this signaling cascade appears to be critical for the proper positioning of CR + IN population in superficial cortical layers [43], similar to our observations in TriocKO mutants. Thus, beyond a lack of response to SDF1/CxCR4 signaling [16], TriocKO fail to respond to Netrin-1 signaling, resulting in a loss of the superficial migratory stream, an apparent increase in radial migration that does not result in a stop of migration but rather a displacement towards the deeper migratory stream, and a net reduction in cortical INs, including in superficially located CR+ INs in the mature cortex. Netrin-1 can signal through multiple receptors [44]. In other neuronal populations, Netrin-1/DCC interaction mediates axonal outgrowth and axonal guidance through Trio-mediated Rac1 activation [10, 87, 88] while inhibiting RhoA [89]. Our findings suggest that Netrin-1 binding to α3β1 integrins to guide the tangential migration of INs in the dorsal pallium requires the activity of Trio, although the exact downstream mechanisms remain to be clarified.
Trio regulates IN morphology and leading process branching
Our data also suggest that the loss of Trio significantly impairs the dynamics of leading process branching, growth cone splitting, trailing process retraction and nucleokinesis, all key determinants of the overall speed and integrity of IN migration. Other RhoGTPase regulators, including elongator, mDia, Dock7 and ArhGAP15, also participate in regulating these processes in INs [36, 37, 90, 91]. Importantly, we show that these events require both the GEFD1-Rac1/RhoG/Cdc42 and the GEFD2-RhoA pathways, as neither domain is sufficient to fully rescue IN migration. Notably, IN morphology, and in particular the length of both the leading and trailing neurites, is regulated by the GEFD2-RhoA pathway. By contrast, the retraction of the trailing neurite, which contributes to maintaining a bipolar morphology, depends on the GEFD1-Rac1/Cdc42 pathway. However, we find that both GEFD1 and GEFD2 pathways regulate branching dynamics and neurite complexity. This is concordant with previous reports of Rac1 (and Rac3) controlling the polarity and neurite complexity in tangentially-migrating INs [91, 92]. In pyramidal cells, both Rac1-dependent activation of the PAK/LIMK and RhoA-dependent activation of ROCK/LIMK prevent axonal outgrowth [91, 93] and neurite branching [91, 94,95,96] during radial migration, while Cdc42 controls the cell morphology and polarity [33, 97]. Cdc42 also promotes cerebellar granule cell migration [97] and axonal outgrowth in a Trio GEFD1-Cdc42-dependent manner [14]. Whether Cdc42 plays a role in IN migration remains to be determined.
Trio regulates IN nucleokinesis
We find that both GEFD1 and GEFD2 control IN nucleokinesis : GEFD2/RhoA determines the duration while GEFD1/Rac1 regulates the amplitude of each cycle. Although previous reports in fixed sections of KO mice suggested that RhoA, Rac1 and Cdc42 were dispensable during IN migration but were required for progenitor cell division and migration competency [94, 98,99,100], our live-cell imaging data demonstrate a critical role of both GEFD1/Rac1 and GEFD2/RhoA pathways on the dynamic process of nucleokinesis in INs. Further, we find that Trio GEFD1/Rac1 helps maintain the directionality of migration in TriocKO INs, a process depended on Rac1 activation [91].
Interestingly, similar complementary roles have been described in migrating pyramidal cells, in which centrosomal translocation initiating nucleokinesis requires Rac1 activation [101], while Trio GEFD2-dependant RhoA activation increases the rate of migration [25, 102]. In hindbrain pre-cerebellar neurons, RhoA regulates nuclear translocations, while Rac1 and Cdc42 initiate leading process extension [103]. Thus, the tight spatiotemporal regulation of multiple Rho GTPases by Trio controls migration dynamics of multiple neuronal cell types, including INs.
Trio controls cytoskeletal actin remodeling during the tangential migration of INs
RhoA, Rac1 and Cdc42 are known regulators of the cytoskeleton, controlling the remodeling of actin filaments and microtubules in response to various cues [33]. Filamin A stabilizes actin filaments and is required for proper elongation and branching of IN leading process [104, 105]. Interestingly, filamin A binds Trio PH1-GEF1 domain [106, 107]. Loss of this interaction thus likely contributes to the aberrant leading process branching observed in TriocKO. Similarly, the inactivation of Rac1/Cdc42, but not RhoA, decreases actin polymerization at the leading edge and alters microtubule dynamics, leading to impaired neuronal migration, aberrant polarity and excessive neurite branching in other neuronal populations [90, 92, 95, 97, 108, 109]. Notably, Rac1, Cdc42 and RhoA interact in a spatially-restricted and cell-type specific manner [110,111,112,113]. In addition, the PH2 domain next to Trio-GEFD2 negatively regulates RhoA [114]. Binding of G-coupled protein Gαq to the PH2 relieves this inhibition and leads to targeted RhoA activation in a spatially restricted fashion [114]. Trio itself undergoes complex feedback regulatory mechanisms as it is a direct target of RhoA and Cdc42 [97, 115]. The loss of Trio may thus result in local overactivation of RhoA, further inhibiting proper Rac1 activation at the leading edge, accentuating the impact on actin and microtubule dynamics in growing neurites.
Further, during nucleokinesis, actin condensation at the rear of the nucleus supports the actomyosin contractions that propel the nucleus forward in both pyramidal cells and INs [34]. This process requires local RhoA activation [37, 90, 108]. Here, we find that the loss of Trio results in a failure of proper actin condensation at the rear of the cell body, impairing nucleokinesis. In addition, a reorganization of microtubules is required for nuclear translocations [34], while microtubule stabilization supports movement of the nucleus towards the centrosome in migrating INs [92]. Trio associates with acentrosomic microtubules to control cell polarity during migration [116] and it binds the plus ends of growing microtubules during neurite extension [117]. Thus, altered microtubule dynamics likely contributes to the IN migration deficits observed in TriocKO mutants.
Amongst the key regulators of nucleokinesis, we find that Trio is required for EphA4/ephrin A2 reverse signaling, a critical motogenic activator of IN migration [46]. Notably, this differs from the usual forward repulsive signaling between EphA4 receptors on INs and striatal ephrinA3 ligand. Indeed, we observe an intact number of EGFP+ cells in the striatum suggesting an adequate repulsion from the striatum as INs migrate tangentially towards the dorsal pallium, a mechanism that also requires Sema3A/3F – Nrp1/2 signaling [118, 119]. The intracellular cascade driving this motogenic effect of reverse EphA4/ephrin A2 signaling in INs is unclear. However, our data suggest that Trio is required for the increase in nucleokinesis frequency and reduced pause duration during EphA4/ephrin A2 reverse signaling, ultimately resulting in greater migration velocity. Whether this depends on GEFD1/Rac1 or GEFD2/RhoA remains to be established although both pathways are involved in EphA4 signaling in other cell populations [120, 121].
In summary, our findings suggest that the DEE/ASD/ID-associated RhoGEF Trio regulates the development and migration of GABAergic INs by controlling the path of migration and the cytoskeletal remodeling critical for proper motion of tangentially-migrating INs through Netrin-1/α3β1 and EphA4/ephrin A2 reverse signaling. Importantly, we demonstrate that while each GEF domain individually contributes to fundamental aspects of IN migration, with critical contributions from the GEFD2-RhoA pathway, their synergistic effects are required to ensure proper IN migration. These findings support an emergent literature suggesting that a subset of genetically determined DEE/ASD/NDD result from a primary impairment of IN migration (see reviews [47, 122, 123]), and that such disorders may ultimately benefit from pharmacological or cell-based therapies aiming to reestablish circuit inhibition [124,125,126,127].
Material and methods
Animals
All experiments were conducted in accordance with the Canadian Council of Animal Care (CCAC) guidelines, or with French and European regulations, and approved by the Université de Montréal Animal Care Committee and the CHU Sainte-Justine Animal Ethics Board, or by the Paris Descartes (CEEA 34) ethical committee for animal experimentation, in accordance with guidance from the French Ministry of Research.
Constitutive knock-out (Trio–/–) embryos were obtained by crossing Trio+/– mice [17] and were maintained on a BALB/c genetic background. Since we found no statistical differences between Trio+/– and WT littermates in terms of IN numbers, proliferation and migration, both genotypes were pooled and used as controls for comparisons with Trio-/- mice (Fig. 1) and mice were not randomized.
Dlx5/6Cre;Trioc/c;RCEEGFP mutant mice (TriocKO) were obtained by breeding Dlx5/6Cre mice [26, 27] with conditional Trioc/c mice [13] expressing the Cre-reporter allele RCEEGFP [28] to genetically label GABAergic INs. Dlx5/6Cre;RCEEGFP littermates (TrioWT) were used as controls for comparisons with TriocKO animals for all cellular experiments (Figs. 3–7), without randomization. However, to optimize the use of each litter during electrophysiology experiments and behavioral tests, which did not require fate-mapping of INs, we pooled Trioc/c, Trioc/+ (i.e. without Cre recombination) and Dlx5/6Cre littermates (i.e. with WT alleles) animals as controls to compare with Dlx5/6Cre;Trioc/c (TriocKO) conditional mutants (Fig. 2). Conditional mutant mice were maintained on a 129sv genetic background. PCR-based genotyping was performed as previously described [13, 15]. Animals used to generate the conditional mutant mouse model were housed at the CHU Sainte-Justine animal facility under 12 h light/dark cycles with water and food ad libitum. Trio+/- animals were housed and crossed at CDTA-TAAM Orléans. For pre-natal experiments, timed-pregnancies were monitored daily, with detection of a vaginal plug corresponding to embryonic stage e0.5. Investigators were not blinded to the genotype, unless stated otherwise.
Video-EEG recordings
P30-36 mice were anesthetized with isoflurane (3% in O2, 0.8 L/min) and bilateral stainless steel electrodes (Plastic One, E363/3/SPC) were implanted in the somatosensory cortex and CA1 areas (AP/ML/DV: Cortex: –1.0/ ± 1.5/-1.0 mm, CA1: -2.0/ ± 1.5/-2.0 mm to Bregma), with a reference electrode over the cerebellum [49]. EEGs were recorded 24 h later at 2000 Hz acquisition speed, filtered at HP 1.0 Hz and LP 70 Hz, and digitized using Cerevello-NeuroMed (Blackrock Microsystems, Salt Lake City, UT, USA). Recording sessions were conducted continuously for at least 72 h in TrioWT and TriocKO littermates. Seizures were characterized as sustained epileptic activity > 4 seconds with behavioral changes and were quantified in terms of frequency, duration, type and severity on the modified Racine scale, as previously described [49].
Patch-clamp electrophysiology
Brain slices of the somatosensory cortex (S1) were prepared as previously described [49, 50, 70] from TrioWT and TriocKO littermates at P30. Spontaneous inhibitory post-synaptic currents (sIPSCs) were recorded in layer V PCs in the presence of 10 µM CNQX and 50 µM DL-APV at -70 mV. Data were recorded and analyzed as before [49, 50, 70]. The investigator was blinded to the genotype for data acquisition and analysis.
Behavior
Behavioral tests were done at P30 in TrioWT and TriocKO littermates at a similar daytime period, by investigators blinded to the genotype. Mice were placed in the experimental room for at least 30 min and mice of both sexes were used in all experiments. All assays were conducted under video-tracking (Logitech c615 camera, SMART tracking system, Harvard Apparatus, Cambridge, MA, USA). The behavioral tasks were conducted sequentially from P30 onwards: Open Field (P30), Elevated Plus Maze (P32), Morris Water Maze (P34). Separate sets of mice underwent the Object Recognition, Marble Burying and Three Chamber Maze tasks. Except for the Marble Burying task, all behavioral assays were conducted and analyzed as in [70].
Open field
Mice were introduced at the center of the open-field arena (50 cm × 50 cm × 35 cm, length x width x height [L x W x H], illuminated with dim light) and movement and exploration were video-recorded for 10 min. The surface area was divided into center and periphery as 36 and 64% of the total area, respectively. To measure exploratory behavior, total distance traveled during the 10 minutes period, the speed and time spent in the center or the periphery and the number of entries in the center zone were calculated. The open-field arena was cleaned with 70% ethanol between each trial.
Elevated plus maze
Mice were introduced onto the center (5 × 5 cm) of an Elevated plus maze (EPM) facing a closed arm (arms 30 cm × 6 cm × 35 cm [L x W x H]), elevated 50 cm above the ground. The exploratory behavior was video-recorded for 5 min. The time spent and number of entries into open arms, closed arms and central zone were measured.
Novel object recognition
The novel object recognition test was performed in the above-mentioned open-field arena. After freely exploring the arena for 5 min, mice were recorded while exploring 2 similar small Falcon tissue culture flasks (50 ml volume) for 10 min and then returned to their home cages. After 30 min of inter-trial interval, one flask was replaced with a novel object with a different texture and duration of interaction was assessed in a second 10 min trial. Exploration time for each object was measured and represented as a discrimination index (time spent with novel object/total time spent with novel + familiar objects). Animals were scored as interacting with the objects when their nose was in contact with the object, or pointing toward the object within a defined distance (1.5 cm).
Morris Water Maze
Spatial memory was tested in a Morris water maze setup. A circular pool (125 cm) was filled with water and painted with non-toxic white paint (Brault & Bouthilier) and kept overnight at room temperature. Mice were placed in the pool and were expected to locate a submerged escape platform using the visible cues present in the room. Mice were trained for 5 consecutive days, 4 trials per day with a 1–3 min inter-session interval. In each trial, mice were first placed on the platform for 30 s, and then placed in the water at a random start position and allowed to swim to find the platform. Mice that were unable to find the platform within 60 s were placed back on the platform by hand. On day 6, a probe test was performed with the platform removed. Mice were placed in the pool opposite from the platform location and allowed to swim for 60 s. During training trials, the latency to reach the platform was measured and in the probe trial, the time spent in each quadrant of the pool was measured.
Marble burying task
Repetitive behavior was assessed using the marble burying task. Each mouse was placed in a clean cage with 3-inch bedding material and allowed to freely explore for 30 minutes. Then, 20 marbles were positioned equidistantly in the cage and each mouse was observed for an additional 20 minutes. The number of marbles buried during the 20-minute trial was quantified.
Three-chamber maze
Socialization assays were tested in the Three Chamber Maze, which consists of a rectangular arena of 70 × 45 cm surrounded by 30 cm tall transparent walls and separated in three equally-sized zones by two 45 × 30 cm transparent walls. The dividing walls had a door allowing the mice to circulate between zones. The animals were first placed in the middle of the central chamber and allowed to explore all empty chambers for 5 min. After habituation, an unfamiliar mouse of the same age and sex Stranger 1, S1 was placed inside a small wired cage and an empty cage was added in the opposite zone, while the middle zone remained empty. The tested animal was allowed to freely explore the three chambers of the arena for 10 min. Then, a new unfamiliar mouse of the same age and sex (Stranger 2, S2) was placed in the previously empty cage and the tested mouse was observed for an additional 10 min to assess preference for social novelty. S1 and S2 animals originated from different home cages and had never been in contact with the tested mice or between each other. The sociability and social novelty were quantified as the time spent by the tested animal in each chamber in close proximity with the other animal (or empty cage) during the first and second 10-min trial, respectively. The maze and cages were cleaned with 70% ethanol at the end of the task.
Histology
Timed-pregnant females were sacrificed by cervical dislocation and embryos were collected at e13.5, e14.5, e15.5 or e18.5 as previously described [15, 128]. Animals at P21 were deeply anesthetized with Pentobarbital (100 mg/kg, i.p.). Brains from e13.5 and e14.5 embryos were dissected out of the skull, rinsed in phosphate-buffered saline (PBS; 100 mM, pH 7.4) and fixed by immersion in 4% paraformaldehyde (PFA) overnight (ON) at 4°C. E15.5 and e18.5 embryos were perfused transcardially with 0.5 mL of 4% PFA and P21 animals were perfused transcardially with 12 mL of PBS followed by 12 mL of 4% PFA. E13.5, e14.5, e15.5, e18.5 and P21 brains were rapidly dissected out, post-fixed by immersion in 4% PFA for 1 h (e13.5, e15.5 and P21) or ON (e14.5 and e18.5) at 4°C and cryoprotected in 30% sucrose in PBS. Then, brains were embedded in CryoMatrix and frozen on dry ice. Brains were cut along the coronal plane with a Cryostat (Leica Microsystems Canada, Concord, ON, Canada) into 18 µm-thick sections and collected on pre-cleaned Superfrost Plus Microscope Slides (Cat. No. 12-550-15, ThermoFisher Scientific, Ottawa, ON, Canada). Microscope slides were kept at –20 °C until use. For e13.5 brains, every ninth section was cut at 50 µm thickness, collected in PBS and stored at 4°C for further use (3D neuronal reconstructionn experiments).
Fixed (e13.5, e15.5, P21) and free-floating (e13.5) sections were rinsed 3×10 min in PBS followed by blocking for 1 h at room temperature (RT) in a solution containing 10% normal goat serum and 1% Triton X-100 in PBS. Sections were then incubated ON at 4 °C in a blocking solution containing 5% normal goat serum and 0.1% Triton X-100 with the proper combination of primary antibodies: rat anti-EGFP (Cat. #04404-84, Nacalai Tesque; 1:1000), mouse anti-NeuN (Cat. #MAB377, Millipore Sigma-Aldrich Canada, Oakville, ON, Canada; 1:1000), rabbit anti-parvalbumin (Cat. #PV-27, Swant, Burgdorf, Switzerland; 1:1000), mouse anti-parvalbumin (Cat. #P3088, Sigma-Aldrich; 1 :1000), rabbit anti-somatostatin (Cat. #PA5-82678, ThermoFisher; 1:1000), rabbit anti-calretinin (Cat. #ABN2191, Millipore Sigma-Aldrich Canada; 1:1000), rabbit anti-VIP (Cat. #20077, Immunostar, Hudson, WI, USA; 1:1000). After several rinses in PBS, sections were then incubated for 2 h at RT in the same blocking solution containing 1:1000 dilutions of corresponding Alexa secondary antibodies (Invitrogen, ThermoFisher Scientific) made in goat and coupled to either 488, 594 or 647 fluorophores. Sections were then rinsed several times in PBS before they were coverslipped with Vectashield® Hardset™ Antifade Mounting Medium (Cat. #H-1400, Vector Laboratories, Newark, CA, USA) or ThermoFisher Scientific™ Shandon™ Immuno-Mount™ (Cat. #9990402, ThermoFisher Scientific) mounting medium. Sections from P21 animals were counterstained with DAPI (Cat. # MP-01306, Invitrogen) prior to cover-slipping. For in situ hybridization, e14.5 and e18.5 were processed as in [15], using the Lhx6 digoxigenin-labeled probe [129].
After their respective culture time, electroporated MGE explants were fixed ON at 4°C with 4% PFA, while Trio–/– and WT MGE explants were fixed for 1 h. After several rinses in PBS, explants were blocked for 1 h at RT as above, followed by an ON incubation at 4°C in the primary antibody solution (5% normal goat serum, 0.1% Triton X-100) containing 1:1000 dilutions of Rabbit anti-GFP (Cat. #A-6455, ThermoFisher Scientific) or Rat anti-mCherry (Cat. # M11217, ThermoFisher Scientific) antibodies, or a 1:100 dilution of mouse anti- βIII Tubulin (Cat # G7121, Promega, Madison, WI, USA) antibody. For F-actin labeling, explants were stained with Alexa Fluor 488-Phalloidin (1:200, Molecular Probes, ThermoFisher Scientific). Explants were then rinsed in PBS several times followed by a 2 h incubation at RT in the secondary antibody solution (5% normal goat serum, 0.1% Triton X-100) containing 1:1000 dilutions of the goat anti-Rabbit Alexa 488 and goat anti-Rat Alexa 594 antibodies or a 1:400 dilution of the donkey anti-mouse Alexa 488 or of the donkey anti-mouse Alexa 594 (Jackson ImmunoResearch, Westgrove, PA, USA), together with Hoechst staining (30 min, RT). Then, explants were washed again three times in PBS and were immediately imaged by confocal microscopy.
EdU staining
Pregnant dams were injected intraperitoneally at e12.5 with a solution containing 5-Ethynyl-2’-deoxyuridine (EdU, ThermoFisher Scientific) and embryos were collected 2 h after. Brains were obtained and fixed as above, cut into 18 μm-thick cryosections and processed following manufacturer instructions (Click-iT EdU Alexa Fluor 488 Imaging kit, Life Technologies, ThermoFisher Scientific) for 30 min at RT. Sections were rinsed three times in 3% bovine serum albumin (BSA) and then in PBS. Hoechst staining was performed for 30 min at RT before pursuing the immunohistochemistry protocol as described above.
Plasmids
The pIRES2-EGFP vector (Cat. #V11106; Clontech, Takara Bio USA Inc., San Jose, CA, USA) was modified by enzymatic restriction to insert the Dlx5/6 promoter (Gift from G. Fishell) [130] in place of the original CMV promoter. The Trio full-length cDNA (TrioF-L) was cloned by standard PCR using a cDNA library from 3 adult mouse cortices and inserted into the modified Dlx5/6::pIRES2-EGFP vector by enzymatic restriction. The TrioΔGEFD1 and TrioΔGEFD2 plasmids were obtained by mutagenesis overlapping PCR using the TrioF-L cDNA plasmid as template. Inserted mutations allowed for the deletion of the GEFD1-PH1 domain (Δ1291-1591) or the GEFD2-PH2 domain (Δ1969-2271). The resulting plasmid was inserted into the modified Dlx5/6::pIRES2-EGFP vector by enzymatic restriction. The Dlx5/6::mCherry plasmid, generated by replacing the EGFP cassette by an mCherry cassette, was used as control. The CMV::tdTomato-Lifeact-7 plasmid (abbreviated Lifeact throughout the manuscript) was a gift from Michael Davidson (Addgene plasmid # 54528; http://n2t.net/addgene:54528; RRID:Addgene_54528) [131]. All plasmids were verified by sequencing before use.
Ex utero electroporation
Electroporation of the MGE was conducted at e13.5 as previously described [128], with minor modifications. Briefly, endo-free plasmid DNA solutions, mixed with 0.01% Fast Green (Cat. #F7258, Sigma-Aldrich), were injected ex vivo directly into the MGE of e13.5 embryos. The Dlx5/6::mCherry control plasmid was either mixed with vehicle (TE buffer) or with one of the Trio cDNA plasmid to obtain a final concentration of 1.5 µg/µl each. The Lifeact plasmid was electroporated at 1.5 µg/µl. Electroporation was performed with platinum plated electrodes (Tweezertrodes, BTX Harvard Apparatus) and an Electro Square Porator (BTX Harvard Apparatus) by delivering 4 square pulses of 40 V, 50 ms in duration at 500 ms intervals.
Organotypic slice cultures and MGE explant cultures
TrioWT and TriocKO embryonic brains were processed for organotypic slice cultures as previously described [128]. Briefly, e13.5 brains were dissected out of the skull in cold L-15 medium (Invitrogen), embedded in 4% low-melting point agarose and cut with a vibratome into 250 µm-thick slices collected in sterile oxygenated artificial cerebrospinal fluid (ACSF; see [128] for composition). Slices that contained the MGE were cultured on 30 mm membrane inserts in enriched Neurobasal medium (see [128] for composition) for 2 h before being transferred into an 8-well coverslip for time-lapse imaging. For TriocKO and TrioWT MGE explant cultures, cortices from WT (without the Cre and the RCE alleles) e13.5 littermate embryos were dissected out, mechanically dissociated in enriched Neurobasal culture medium [128] and plated at a density of 5.25 ×10⁵ cells/cm2 [132] in 8-well coverslips previously coated with collagen and poly-L-lysine, followed by culture for 1 h (37 °C, 5% CO2). Then, GFP+ littermate embryos were individually processed by decapitation, followed by plasmid injection and MGE electroporation, when applicable, dissection of the MGE and cutting into approximately 200-µm2 explants, which were cultured onto the previously prepared monolayer of mixed cortical cells for 48 h. For Trio–/– and WT MGE explants, e14.5 brains were processed as above to obtain 250-µm thick coronal sections. Then, MGE were dissected out of the obtained slices, cut into small explants as above using a tungsten needle and either cultured on poly-L-ornithine/laminin coated wells (both from Sigma-Aldrich) for growth cone morphology analysis or embedded in rat tail collagen (BD Bioscience) for migration front analysis. The explants were cultured for 48 h in Neurobasal medium supplemented as above, but with the addition of 100 U/ml pen-strep (Invitrogen).
Chemotaxis assays
For Boyden chamber assays, TrioWT or TriocKO MGE were dissected at e13.5 and MGE cells were dissociated by centrifugation for 3 min at 800 G. For each experiment, breedings were optimized to obtain only TrioWT or TriocKO brains, allowing the MGEs from all embryos of a single litter to be pooled together. After centrifugation, L-15 medium was replaced by serum-free enriched Neurobasal medium and the number of live dissociated cells was assessed with Typan blue (Cat. #MT25900CI, ThermoFisher Scientific). Corning® Transwell® polycarbonate membrane cell culture inserts (Cat. #CLS3422, Millipore Sigma-Aldrich) were coated with rat collagen and inserted in a 12-well plate also coated with rat collagen and filled with 600 µl of serum-free enriched Neurobasal medium. Each membrane was then filled with 90 000 dissociated MGE cells, followed by the addition of recombinant human Slit2 protein (2 mg/ml; Cat. #8616-SL-050, Cedarlane, Burlington, ON, Canada), recombinant mouse Netrin-1 protein (250 ng/ml; Cat. #1109-N1-025/CF, Bio-Techne/R&D Systems, Minneapolis, MN, USA), recombinant mouse EphA4-Fc chimera protein (10 µg/ml; Cat. #641-A4, Bio-Techne/R&D Systems), human IgG Fc protein (as a control for EphA4-Fc treatment; 10 µg/ml; Cat. #009-0103, Rockland Immunochemicals, Pottstown, PA, USA) or sterile PBS (vehicle as control for Slit2 and Netrin-1 treatments) in the well under the membrane, and cultured for 6 h (37°C, 5% CO2). Solutions containing EphA4-Fc chimera or human IgG Fc protein were subjected to protein dimerization with goat anti-human IgG Fc secondary antibody (10 µg/ml; Cat. #H10500, ThermoFisher Scientific) for 30 min at RT prior to incubation with MGE cells. After their appropriate incubation period, dissociated MGE cells in Boyden chambers were fixed overnight at 4°C with 4% PFA, followed by delicate rinses in PBS and confocal microscopy as described below. TrioWT and TriocKO MGE explants cultures were prepared as above and treated for chemotaxis assays, followed by culture for 48 h (37°C, 5% CO2).
Time-lapse imaging and video analyses
Migrating INs were monitored by time-lapse imaging of neocortical EGFP+ cells in organotypic slices, EGFP+ cells in MGE explants (including chemotaxis assays) or mCherry + /EGFP+ cells in electroporated MGE explants. For the migration and branching assays, images were acquired every 5 min for 5 h using a Leica spinning disk confocal microscope equipped with an environmental chamber (37°C, 5% CO2), a sCMOS Orca Flash 4.0 camera, a HC PL APO 20x/0.80 objective and the VisiView acquisition software (v. 4.1.0.6). Images from e13.5 organotypic slices were taken at the migration front in the dorsal pallium with 18 optical z-plans at 2 µm intervals. Images of EGFP+ cells migrating out of MGE explants were acquired using the same parameters. Migration dynamics was analyzed according to the method described in [36]. Briefly, a nuclear translocation was identified when the movement of the nucleus exceeded 5 µm. For organotypic slices, only tangentially migrating INs were included in the migration analyses. The amplitude of translocation was calculated as the average length of significant nuclear movement per cell. The frequency of translocation corresponds to the number of significant nuclear movement divided by the time of recording (5 h). The total distance corresponds to the length of the entire track covered by the soma, whereas the displacement refers to the net distance between the first position (at 0 h) and the last position of the soma (at 5 h). The global velocity was calculated by dividing the total distance (nm) by the time of recording (s). INs were considered in pause when cell body movement were less than 5 µm in amplitude, and pauses were calculated in terms of duration and frequency. Nucleokinesis velocity corresponds to the mean speed of nuclear translocations, excluding pauses. Branching dynamics was analyzed for the leading process only. The growth cone splitting rate was quantified by dividing the number of new branches or growth cone splitting events by the time of recording. The transient branch lifetime corresponds to the average time between the appearance of a new branch or a growth cone splitting and either its complete retraction or its transformation into a trailing process. A multipolar phenotype (number of primary neurites >1) was identified whenever two or more primary branches were simultaneously extending with at least one growth cone each. Secondary neurites were identified as newly formed branch or growth cone splitting closest to the cell body. Given the dynamic nature of migrating INs and the quick switch from leading to trailing process and vice-versa, we considered any new branch or growth cone splitting that formed more distally than a secondary neurite as a tertiary neurite. Quantifications correspond to the total number of such events (primary, secondary, tertiary neurites) for the entire time of recording per cell. For actin dynamics assays, images were acquired every 30 s for 3 h using the same system as above, but with a N PL L 40x/0.55 CORR objective, and analyzed using fire-mode in the ImageJ/FIJI software to visualize actin intensity and localization, as in [36]. Briefly, for each electroporated cell, each timeframe was analyzed and F-actin was categorized as being either diffusely distributed, forming a rear cup behind the nucleus or condensing into a rear dot. The number of events for each category was then divided by the total number of timeframes analyzed to obtain the proportion of time spent in each state.
Microscopy, neuronal quantifications and morphological analyses
Immunostained coronal 18 µm-thick sections from e13.5, e15.5 were scanned using an upright Leica TSC SP8 confocal microscope equipped with three solid state lasers, PMT and HyD detectors and the Leica Application Suite X (LAS-X) acquisition software (v. 3.5.19976.5, Leica Microsystems). For each brain section, several z-stacks containing six or seven 2 µm-thick optical sections were acquired using a HC PL Apo 20x/0.75 dry objective and tiled to cover the entire section. Isolated GABAergic INs at the migratory front in 50 µm-thick immunostained sections were imaged in their entirety using the same confocal microscope with a 63x/1.40 oil objective, a digital magnification of 1.5 and 0.5 µm-thick optical sections. Immunostained coronal 18 µm-thick sections from P21 animals and electroporated INs in MGE explants were imaged with an inverted Leica SP8 confocal microscope, equipped as above, but with four solid state lasers and using a HC PL Apo 20x/0.75 dry objective and a HC PL APO 63x/1.40 oil CS2 objective, respectively. Electroporated INs in MGE explants were imaged in their entirety.
Dissociated MGE cells that migrated through the porous membrane in Boyden chambers were imaged with the same inverted Leica SP8 confocal microscope and HC PL Apo 20x/0.75 dry objective as above. For each well, a total of four unmerged fields of view starting from the center of the membrane were acquired at a resolution of 2048 ×2048 pixels, a frequency of 600 Hz and a z-depth of 100 µm with 2 µm-thick optical sections. After live-imaging, MGE explants subjected to chemotaxis treatments were fixed overnight at 4°C with 4% PFA, followed by rinses in PBS, and imaged in their entirety by epifluorescence using an inverted widefield DMi8 microscope (Leica Microsystems) equipped with a HC PL FLUOTAR 10x/0.30 dry objective, a GFP fluorescence filter set for DMi8 microscopes (excitation: BP470/40, dichroic: 495, emission: BP525/50), a sCMOS black & white camera (DFC9000 GTC, Leica Microsystems) and the Leica Application Suite X (LAS X) acquisition software (v. 3.7, Leica Microsystems).
Hybridized e14.5 and e18.5 coronal sections were imaged with a Leica MZ16F Stereoscope. For EdU experiments at e12.5, images were acquired using an Olympus Widefield BX63 microscope equipped with a Hamamatsu ORCA-flash4 camera and a 10x objective. Explants and growth cones from WT and Trio–/– embryos were imaged with a DMi8 microscope (Leica Microsystems) using a HC PL FLUOTAR 10x/0.30 dry objective also equipped with a Hamamatsu ORCA-flash4 camera. For illustration purposes only, growth cones were also imaged using a HC PL FLUOTAR 20x objective.
Neuronal quantifications in embryonic brains were performed using an unbiased approach with the open-source Fiji/ImageJ software. Eight equally spaced sections were imaged in tile-scans and z-stacks across the entire rostro-caudal extent of the embryonic telencephalon, with the first section selected randomly. For each coronal section, three optical sections in the middle of the stack were selected and processed by average intensity projection. On the resulting images, the dorsal pallium (e13.5 and e14.5) was then divided in five equal bins across its entire ventro-dorsal extent, starting at the cross-section between the dorsal pallium and the LGE and GFP+ cells were quantified in each bin, as in [133]. For e15.5 and e18.5 brains, the dorsal pallium was divided in ten equally distant bins in the latero-medial plan, and embryonic rudimental layers, i.e. the marginal zone (MZ), the cortical plate (CP), the intermediate (IZ), subventricular (SVZ) and ventricular zones (VZ) were defined, as in [133]. GFP+ cells were manually counted in each of these bins and/or layers and their percentile distribution across all bins was reported. For the quantification of radially migrating cells, the number of GFP+ cells oriented 45° or more from the SVZ and MZ migration streams was quantified and reported as a proportion of the total number of GFP+ cells in the dorsal pallium (e13.5) or in the CP (e15.5). For migratory stream segregation assessment at e15.5, confocal images were processed by sum intensity projection in Fiji/ImageJ and a 300 pixel-width line was traced perpendicular to the pia starting at the cross-section of the LGE and the dorsal pallium and terminating just under the pia. Fluorescence intensity profile across the traced line was obtained using the Intensity Summary function in Fiji/ImageJ and divided in 20 equidistant bins to facilitate graphical representation of the data. For Lhx6 signal quantification, signal intensity in each bin was measured and normalized to the total signal intensity detected in all five bins. The same strategy was used to measure Lhx6 radial signal intensity across the MZ, IZ and SVZ. The resulting signal intensity percentage was considered indicative of the percentage of cells stained in each bin. For proliferation assays at e12.5, the percentage of the VZ, SVZ and mantle zone area covered by EdU+ signal was measured. For P21 brains, GFP-positive INs were manually counted in the somatosensory cortex or the striatum using Fiji/ImageJ software as in [70]. The cortical layers were identified using DAPI staining. Briefly, fate-mapped GABAergic INs were identified as such by their expression of EGFP and DAPI, and were manually counted using the Cell Counter plug-in in Fiji/ImageJ. Densities were calculated by dividing the number of cells by the area of each layer, or by the total area. A similar approach was used to quantified immunostained INs expressing either PV, SST, CR or VIP, with the exception that only immunostained cells that also co-expressed EGFP were considered for quantification.
For Boyden chambers assays, the number of EGFP+ cells found under the porous membrane was quantified using the Find Maxima function in Fiji/ImageJ. The migration index was obtained by dividing the number of cells treated with either Slit2, Netrin-1 or EphA4 Fc chimera by the number of cells treated with their respective control solution within the same experiment and for each genotype. The migration radius index in MGE explants was obtained by measuring the largest migration radius from the center of the explant divided by the radius of the explant itself. Then, for each genotype, the calculated migration radius following treatment with either Slit2, Netrin-1 or EphA4 Fc chimera was normalized to the calculated migration radius following treatment with corresponding control solution within the same experiment.
Morphological analyses were performed on high-resolution confocal images using the specialized NeuroLucida image analysis software (v. 11.0.8.2, MicroBrightField) to reconstitute neurons in 3-D. The cell body size corresponds to the largest area of the cell body. The leading process was identified by the presence of a swelling in front of the cell body, the thickness of the neurite and the presence of growth cones at the extremities. The trailing process was identified as such by the presence of a thin neurite, generally oriented towards the back of the cell body, and devoid of a growth cone or a swelling. Migration distances in fixed MGE explants generated at e14.5 were obtained by measuring the mean distance of the 50 cells that migrated the most from the explant and averaged between at least four different explant per brain. Growth cones were scored as in [134]. Briefly, growth cones were categorized as either collapsed or with a complex morphology, and for growth cones presenting with a complex morphology, the surface was measured using the area tool in Fiji/ImageJ.
Statistical analyses
All statistical analyses were performed using GraphPad Prism software (v. 8.2.0, GraphPad software, San Diego, USA). Unpaired two-sided Student’s t-tests were used for comparisons between two groups with normal distribution, while Mann-Whitney tests were used for comparison between two groups with non-parametric data distribution or with small samples. One-way two-sided ANOVA, followed by Tukey’s multiple comparisons tests, were used for comparisons between three or more groups and two-way two-sided ANOVA or two-way mixed-effect analyses (for repeated measures with missing values), followed by Bonferroni’s or Tukey’s multiple comparisons tests were used to compare groups with two or more factors. Fisher’s exact test was used for growth cone morphology comparison. Differences were considered significant at P ( < ) 0.05. Mean and standard error of the mean (s.e.m.) are used throughout the text as central tendency and dispersion measures, respectively. Minimal sample size required for each experimental procedure was either calculated using power analysis based on effect size from [50] or estimated when published data were not available.
Data availability
All data and protocols are available on request.
References
-
Ba W, Yan Y, Reijnders MR, Schuurs-Hoeijmakers JH, Feenstra I, Bongers EM, et al. TRIO loss of function is associated with mild intellectual disability and affects dendritic branching and synapse function. Hum Mol Genet. 2016;25:892–902.
Google Scholar
-
Pengelly RJ, Greville-Heygate S, Schmidt S, Seaby EG, Jabalameli MR, Mehta SG, et al. Mutations specific to the Rac-GEF domain of TRIO cause intellectual disability and microcephaly. J Med Genet. 2016;0:1–8.
-
Katrancha SM, Wu Y, Zhu M, Eipper BA, Koleske AJ, Mains RE. Neurodevelopmental disease-associated de novo mutations and rare sequence variants affect TRIO GDP/GTP exchange factor activity. Hum Mol Genet. 2017;26:4728–40.
Google Scholar
-
Sadybekov A, Tian C, Arnesano C, Katritch V, Herring BE. An autism spectrum disorder-related de novo mutation hotspot discovered in the GEF1 domain of Trio. Nat Commun. 2017;8:1–13.
Google Scholar
-
Michaud JL, Lachance M, Hamdan FF, Carmant L, Lortie A, Diadori P, et al. The genetic landscape of infantile spasms. Hum Mol Genet. 2014;23:4846–58.
Google Scholar
-
Barbosa S, Greville-Heygate S, Bonnet M, Godwin A, Fagotto-Kaufmann C, Kajava AV, et al. Opposite modulation of RAC1 by mutations in TRIO is associated with distinct, domain-specific neurodevelopmental disorders. Am J Hum Genet. 2020;106:338–55.
Google Scholar
-
Katrancha SM, Shaw JE, Zhao AY, Myers SA, Cocco AR, Jeng AT, et al. Trio haploinsufficiency causes neurodevelopmental disease-associated deficits. Cell Rep. 2019;26:2805–17.e2809.
Google Scholar
-
Etienne-Manneville S, Hall A. Rho GTPases in cell biology. Nature. 2002;420:629–35.
Google Scholar
-
Debant A, Serra-Pagès C, Seipel K, O’Brien S, Tang M, Park S-H, et al. The multidomain protein Trio bind the LAR transmembrane tyrosine phosphatase, contains a protein kinase domain, and has separate rac-specific and rho-specific guanine nucleotide exchange factor domains. Proc Natl Acad Sci USA. 1996;93:5466–71.
Google Scholar
-
Briancon-Marjollet A, Ghogha A, Nawabi H, Triki I, Auziol C, Fromont S, et al. Trio mediates netrin-1-induced Rac1 activation in axon outgrowth and guidance. Mol Cell Biol. 2008;28:2314–23.
Google Scholar
-
DeGeer J, Boudeau J, Schmidt S, Bedford F, Lamarche-Vane N, Debant A. Tyrosine phosphorylation of the Rho guanine nucleotide exchange factor Trio regulates netrin-1/DCC-mediated cortical axon outgrowth. Mol Cell Biol. 2013;33:739–51.
Google Scholar
-
Estrach S, Schmidt S, Diriong S, Penna A, Blangy A, Fort P, et al. The human Rho-GEF Trio and its target GTPase RhoG are involved in the NGF pathway, leading to neurite outgrowth. Curr Biol. 2002;12:307–12.
Google Scholar
-
Peng YJ, He WQ, Tang J, Tao T, Chen C, Gao YQ, et al. Trio is a key guanine nucleotide exchange factor coordinating regulation of the migration and morphogenesis of granule cells in the developing cerebellum. J Biol Chem. 2010;285:24834–44.
Google Scholar
-
Tao T, Sun J, Peng Y, Wang P, Chen X, Zhao W, et al. Distinct functions of Trio GEF domains in axon outgrowth of cerebellar granule neurons. J Genet Genomics. 2019;46:87–96.
Google Scholar
-
Backer S, Lokmane L, Landragin C, Deck M, Garel S, Bloch-Gallego E. Trio GEF mediates RhoA activation downstream of Slit2 and coordinates telencephalic wiring. Development. 2018;145:dev153692.
Google Scholar
-
Sun X, Wang L, Wei C, Sun M, Li Q, Meng H, et al. Dysfunction of Trio GEF1 involves in excitatory/inhibitory imbalance and autism-like behaviors through regulation of interneuron migration. Mol Psychiatry. 2021;26:7621–40.
Google Scholar
-
O’Brien J, Seipel K, Medley QG, Bronson R, Segal R, Streuli M. Skeletal muscle deformity and neuronal disorder in Trio exchange factor-deficient mouse embryos. Proc Natl Acad Sci USA. 2000;97:12074–8.
Google Scholar
-
Backer S, Hidalgo-Sanchez M, Offner N, Portales-Casamar E, Debant A, Fort P, et al. Trio controls the mature organization of neuronal clusters in the hindbrain. J Neurosci. 2007;27:10323–32.
Google Scholar
-
Herring BE, Nicoll RA. Kalirin and Trio proteins serve critical roles in excitatory synaptic transmission and LTP. Proc Natl Acad Sci USA. 2016;113:2264–9.
Google Scholar
-
Tao T, Sun J, Peng Y, Li Y, Wang P, Chen X, et al. Golgi-resident TRIO regulates membrane trafficking during neurite outgrowth. J Biol Chem. 2019;294:10954–68.
Google Scholar
-
Graus-Porta D, Blaess S, Senften M, Littlewood-Evans A, Damsky C, Huang Z, et al. Beta1-class integrins regulate the development of laminae and folia in the cerebral and cerebellar cortex. Neuron. 2001;31:367–79.
Google Scholar
-
Chan C-H, Godinho LN, Thomaidou D, Tan S-S, Gulisano M, Parnavelas JG. Emx1 is a marker for pyramidal neurons of the cerebral cortex. Cereb Cortex. 2001;11:1191–8.
Google Scholar
-
Gorski JA, Talley T, Qiu M, Puelles L, Rubenstein JL, Jones KR. Cortical excitatory neurons and glia, but not GABAergic neurons, are produced in the Emx1-expressing lineage. J Neurosci. 2002;22:6309–14.
Google Scholar
-
Zong W, Liu S, Wang X, Zhang J, Zhang T, Liu Z, et al. Trio gene is required for mouse learning ability. Brain Res. 2015;1608:82–90.
Google Scholar
-
Wei C, Sun M, Sun X, Meng H, Li Q, Gao K, et al. RhoGEF Trio Regulates Radial Migration of Projection Neurons via Its Distinct Domains. Neurosci Bull. 2022;38:249–62.
Google Scholar
-
Wang Y, Dye CA, Sohal V, Long JE, Estrada RC, Roztocil T, et al. Dlx5 and Dlx6 regulate the development of parvalbumin-expressing cortical interneurons. J Neurosci. 2010;30:5334–45.
Google Scholar
-
Kohwi M, Petryniak MA, Long JE, Ekker M, Obata K, Yanagawa Y, et al. A subpopulation of olfactory bulb GABAergic interneurons is derived from Emx1- and Dlx5/6-expressing progenitors. J Neurosci. 2007;27:6878–91.
Google Scholar
-
Sousa VH, Miyoshi G, Hjerling-Leffler J, Karayannis T, Fishell G. Characterization of Nkx6-2-derived neocortical interneuron lineages. Cereb Cortex. 2009;19:i1–10.
Google Scholar
-
Bellion A, Baudoin JP, Alvarez C, Bornens M, Metin C. Nucleokinesis in tangentially migrating neurons comprises two alternating phases: forward migration of the Golgi/centrosome associated with centrosome splitting and myosin contraction at the rear. J Neurosci. 2005;25:5691–9.
Google Scholar
-
Martini FJ, Valiente M, Lopez Bendito G, Szabo G, Moya F, Valdeolmillos M, et al. Biased selection of leading process branches mediates chemotaxis during tangential neuronal migration. Development. 2009;136:41–50.
Google Scholar
-
Valiente M, Martini FJ. Migration of cortical interneurons relies on branched leading process dynamics. Cell Adh Migr. 2009;3:278–80.
Google Scholar
-
Marin O. Cellular and molecular mechanisms controlling the migration of neocortical interneurons. Eur J Neurosci. 2013;38:2019–29.
Google Scholar
-
Govek EE, Hatten ME, Van Aelst L. The role of Rho GTPase proteins in CNS neuronal migration. Dev Neurobiol. 2011;71:528–53.
Google Scholar
-
Martini FJ, Valdeolmillos M. Actomyosin contraction at the cell rear drives nuclear translocation in migrating cortical interneurons. J Neurosci. 2010;30:8660–70.
Google Scholar
-
Marin O, Valiente M, Ge X, Tsai LH. Guiding neuronal cell migrations. Cold Spring Harb Perspect Biol. 2010;2:a001834.
Google Scholar
-
Tielens S, Huysseune S, Godin JD, Chariot A, Malgrange B, Nguyen L. Elongator controls cortical interneuron migration by regulating actomyosin dynamics. Cell Res. 2016;26:1131–48.
Google Scholar
-
Shinohara R, Thumkeo D, Kamijo H, Kaneko N, Sawamoto K, Watanabe K, et al. A role for mDia, a Rho-regulated actin nucleator, in tangential migration of interneuron precursors. Nat Neurosci. 2012;15:373–80.
Google Scholar
-
Peyre E, Silva CG, Nguyen L. Crosstalk between intracellular and extracellular signals regulating interneuron production, migration and integration into the cortex. Front Cell Neurosci. 2015;9:129.
Google Scholar
-
Toudji I, Toumi A, Chamberland E, Rossignol E. Interneuron odyssey: molecular mechanisms of tangential migration. Front Neural Circuits. 2023;17:1256455.
Google Scholar
-
Zhu Y, Li H, Zhou L, Wu JY, Rao Y. Cellular and molecular guidance of GABAergic neuronal migration from an extracortical origin to the neocortex. Neuron. 1999;23:473–85.
Google Scholar
-
Yuan W, Zhou L, Chen JH, Wu JY, Rao Y, Ornitz DM. The mouse SLIT family: secreted ligands for ROBO expressed in patterns that suggest a role in morphogenesis and axon guidance. Dev Biol. 1999;212:290–306.
Google Scholar
-
Andrews W, Liapi A, Plachez C, Camurri L, Zhang J, Mori S, et al. Robo1 regulates the development of major axon tracts and interneuron migration in the forebrain. Development. 2006;133:2243–52.
Google Scholar
-
Stanco A, Szekeres C, Patel N, Rao S, Campbell K, Kreidberg JA, et al. Netrin-1-alpha3beta1 integrin interactions regulate the migration of interneurons through the cortical marginal zone. Proc Natl Acad Sci USA. 2009;106:7595–600.
Google Scholar
-
Yamagishi S, Bando Y, Sato K. Involvement of netrins and their receptors in neuronal migration in the cerebral cortex. Front Cell Dev Biol. 2020;8:590009.
Google Scholar
-
Greferath U, Canty AJ, Messenger J, Murphy M. Developmental expression of EphA4-tyrosine kinase receptor in the mouse brain and spinal cord. Mech Dev. 2002;119:S231–238.
Google Scholar
-
Steinecke A, Gampe C, Zimmer G, Rudolph J, Bolz J. EphA/ephrin A reverse signaling promotes the migration of cortical interneurons from the medial ganglionic eminence. Development. 2014;141:460–71.
Google Scholar
-
Rossignol E. Genetics and function of neocortical GABAergic interneurons in neurodevelopmental disorders. Neural Plast. 2011;2011:649325.
Google Scholar
-
Batista-Brito R, Rossignol E, Hjerling-Leffler J, Denaxa M, Wegner M, Lefebvre V, et al. The cell-intrinsic requirement of Sox6 for cortical interneuron development. Neuron. 2009;63:466–81.
Google Scholar
-
Rossignol E, Kruglikov I, van den Maagdenberg AM, Rudy B, Fishell G. CaV 2.1 ablation in cortical interneurons selectively impairs fast-spiking basket cells and causes generalized seizures. Ann Neurol. 2013;74:209–22.
Google Scholar
-
Jiang X, Lupien-Meilleur A, Tazerart S, Lachance M, Samarova E, Araya R, et al. Remodeled cortical inhibition prevents motor seizures in generalized epilepsy. Ann Neurol. 2018;84:436–51.
Google Scholar
-
Jiang X, Lachance M, Rossignol E. Involvement of cortical fast-spiking parvalbumin-positive basket cells in epilepsy. Prog Brain Res. 2016;226:81–126.
Google Scholar
-
Pinto DJ, Brumberg JC, Simons DJ. Circuit dynamics and coding strategies in rodent somatosensory cortex. J Physiol. 2000;83:1158–66.
Google Scholar
-
Pinto D, Hartings JA, Brumberg JC, Simons DJ. Cortical damping: analysis of thalamocortical reponse transformation in rodent barrel cortex. Cerebral Cortex. 2003;13:33–44.
Google Scholar
-
Pouille F, Marin-Burgin A, Adesnik H, Atallah BV, Scanziani M. Input normalization by global feedforward inhibition expands cortical dynamic range. Nat Neurosci. 2009;12:1577–85.
Google Scholar
-
Cruikshank SJ, Lewis TJ, Connors BW. Synaptic basis for intense thalamocortical activation of feedforward inhibitory cells in neocortex. Nat Neurosci. 2007;10:462–8.
Google Scholar
-
Gabernet L, Jadhav SP, Feldman DE, Carandini M, Scanziani M. Somatosensory integration controlled by dynamic thalamocortical feed-forward inhibition. Neuron. 2005;48:315–27.
Google Scholar
-
Gibson JR, Beierlein M, Connors BW. Two networks of electrically coupled inhibitory neurons in neocortex. Nature. 1999;402:75–9.
Google Scholar
-
Porter JT, Johnson CK, Agmon A. Diverse types of interneurons generate thalamus-evoked feedforward inhibition in the mouse barrel cortex. J Neurosci. 2001;21:2699–710.
Google Scholar
-
Butt SJ, Sousa VH, Fuccillo MV, Hjerling-Leffler J, Miyoshi G, Kimura S, et al. The requirement of Nkx2-1 in the temporal specification of cortical interneuron subtypes. Neuron. 2008;59:722–32.
Google Scholar
-
Jung EM, Moffat JJ, Liu J, Dravid SM, Gurumurthy CB, Kim WY. Arid1b haploinsufficiency disrupts cortical interneuron development and mouse behavior. Nat Neurosci. 2017;20:1694–707.
Google Scholar
-
Close J, Xu H, De Marco Garcia N, Batista-Brito R, Rossignol E, Rudy B, et al. Satb1 is an activity-modulated transcription factor required for the terminal differentiation and connectivity of medial ganglionic eminence-derived cortical interneurons. J Neurosci. 2012;32:17690–705.
Google Scholar
-
Powell EM, Campbell DB, Stanwood GD, Davis C, Noebels JL, Levitt P. Genetic disruption of cortical interneuron development causes region- and GABA cell type-specific deficits, epilepsy, and behavioral dysfunction. J Neurosci. 2003;223:622–31.
Google Scholar
-
Levitt P, Eagleson KL, Powell EM. Regulation of neocortical interneuron development and the implications for neurodevelopmental disorders. Trends Neurosci. 2004;27:400–6.
Google Scholar
-
van den Berghe V, Stappers E, Vandesande B, Dimidschstein J, Kroes R, Francis A, et al. Directed migration of cortical interneurons depends on the cell-autonomous action of Sip1. Neuron. 2013;77:70–82.
Google Scholar
-
Penagarikano O, Abrahams BS, Herman EI, Winden KD, Gdalyahu A, Dong H, et al. Absence of CNTNAP2 leads to epilepsy, neuronal migration abnormalities, and core autism-related deficits. Cell. 2011;147:235–46.
Google Scholar
-
Dutton SB, Makinson CD, Papale LA, Shankar A, Balakrishnan B, Nakazawa K, et al. Preferential inactivation of Scn1a in parvalbumin interneurons increases seizure susceptibility. Neurobiol Dis. 2013;49:211–20.
Google Scholar
-
Cheah CS, Yu FH, Westenbroek RE, Kalume FK, Oakley JC, Potter GB, et al. Specific deletion of Nav1.1 sodium channels in inhibitory interneurons causes seizures and premature death in a mouse model of Dravet syndrome. Proc Natl Acad Sci USA. 2012;109:14646–51.
Google Scholar
-
Li KX, Lu YM, Xu ZH, Zhang J, Zhu JM, Zhang JM, et al. Neuregulin 1 regulates excitability of fast-spiking neurons through Kv1.1 and acts in epilepsy. Nat Neurosci. 2011;15:267–73.
Google Scholar
-
Tan GH, Liu YY, Hu XL, Yin DM, Mei L, Xiong ZQ. Neuregulin 1 represses limbic epileptogenesis through ErbB4 in parvalbumin-expressing interneurons. Nat Neurosci. 2011;15:258–66.
Google Scholar
-
Lupien-Meilleur A, Jiang X, Lachance M, Taschereau-Dumouchel V, Gagnon L, Vanasse C, et al. Reversing frontal disinhibition rescues behavioural deficits in models of CACNA1A-associated neurodevelopment disorders. Mol Psychiatry. 2021;26:7225–46.
Google Scholar
-
Cardin JA, Carlen M, Meletis K, Knoblich U, Zhang F, Deisseroth K, et al. Driving fast-spiking cells induces gamma rhythm and controls sensory responses. Nature. 2009;459:663–7.
Google Scholar
-
Sohal VS, Zhang F, Yizhar O, Deisseroth K. Parvalbumin neurons and gamma rhythms enhance cortical circuit performance. Nature. 2009;459:698–702.
Google Scholar
-
Siegle JH, Pritchett DL, Moore CI. Gamma-range synchronization of fast-spiking interneurons can enhance detection of tactile stimuli. Nat Neurosci. 2014;17:1371–9.
Google Scholar
-
Howard MW, Rizzuto DS, Caplan JB, Madsen JR, Lisman J, Aschenbrenner-Scheibe R, et al. Gamma oscillations correlate with working memory load in humans. Cereb Cortex. 2003;13:1369–74.
Google Scholar
-
Marin O. Interneuron dysfunction in psychiatric disorders. Nat Rev Neurosci. 2012;13:107–20.
Google Scholar
-
Cauli B, Zhou X, Tricoire L, Toussay X, Staiger JF. Revisiting enigmatic cortical calretinin-expressing interneurons. Front Neuroanat. 2014;8:52.
Google Scholar
-
Mossner JM, Batista-Brito R, Pant R, Cardin JA. Developmental loss of MeCP2 from VIP interneurons impairs cortical function and behavior. Elife. 2020;9:e55639.
Google Scholar
-
Goff KM, Goldberg EM. Vasoactive intestinal peptide-expressing interneurons are impaired in a mouse model of Dravet syndrome. Elife. 2019;8:e46846.
Google Scholar
-
Favero M, Sotuyo NP, Lopez E, Kearney JA, Goldberg EM. A transient developmental window of fast-spiking interneuron dysfunction in a mouse model of Dravet syndrome. J Neurosci. 2018;38:7912–27.
Google Scholar
-
Almog Y, Fadila S, Brusel M, Mavashov A, Anderson K, Rubinstein M. Developmental alterations in firing properties of hippocampal CA1 inhibitory and excitatory neurons in a mouse model of Dravet syndrome. Neurobiol Dis. 2021;148:105209.
Google Scholar
-
Rubinstein M, Westenbroek RE, Yu FH, Jones CJ, Scheuer T, Catterall WA. Genetic background modulates impaired excitability of inhibitory neurons in a mouse model of Dravet syndrome. Neurobiol Dis. 2015;73:106–17.
Google Scholar
-
Han S, Tai C, Westenbroek RE, Yu FH, Cheah CS, Potter GB, et al. Autistic-like behaviour in Scn1a+/- mice and rescue by enhanced GABA-mediated neurotransmission. Nature. 2012;489:385–90.
Google Scholar
-
Lopez-Bendito G, Sanchez-Alcaniz JA, Pla R, Borrell V, Pico E, Valdeolmillos M, et al. Chemokine signaling controls intracortical migration and final distribution of GABAergic interneurons. J Neurosci. 2008;28:1613–24.
Google Scholar
-
Li G, Adesnik H, Li J, Long J, Nicoll RA, Rubenstein JL, et al. Regional distribution of cortical interneurons and development of inhibitory tone are regulated by Cxcl12/Cxcr4 signaling. J Neurosci. 2008;28:1085–98.
Google Scholar
-
Tiveron MC, Rossel M, Moepps B, Zhang YL, Seidenfaden R, Favor J, et al. Molecular interaction between projection neuron precursors and invading interneurons via stromal-derived factor 1 (CXCL12)/CXCR4 signaling in the cortical subventricular zone/intermediate zone. J Neurosci. 2006;26:13273–8.
Google Scholar
-
Stumm RK, Zhou C, Ara T, Lazarini F, Dubois-Dalcq M, Nagasawa T, et al. CXCR4 regulates interneuron migration in the developing neocortex. J Neurosci. 2003;23:5123–30.
Google Scholar
-
DeGeer J, Kaplan A, Mattar P, Morabito M, Stochaj U, Kennedy TE, et al. Hsc70 chaperone activity underlies Trio GEF function in axon growth and guidance induced by netrin-1. J Cell Biol. 2015;210:817–32.
Google Scholar
-
Li X, Saint-Cyr-Proulx E, Aktories K, Lamarche-Vane N. Rac1 and Cdc42 but not RhoA or Rho kinase activities are required for neurite outgrowth induced by the Netrin-1 receptor DCC (deleted in colorectal cancer) in N1E-115 neuroblastoma cells. J Biol Chem. 2002;277:15207–14.
Google Scholar
-
Moore SW, Correia JP, Lai Wing Sun K, Pool M, Fournier AE, Kennedy TE. Rho inhibition recruits DCC to the neuronal plasma membrane and enhances axon chemoattraction to netrin 1. Development. 2008;135:2855–64.
Google Scholar
-
Nakamuta S, Yang YT, Wang CL, Gallo NB, Yu JR, Tai Y et al. Dual role for DOCK7 in tangential migration of interneuron precursors in the postnatal forebrain. J Cell Biol. 2017;216:4313–30.
-
Zamboni V, Armentano M, Saro G, Ciraolo E, Ghigo A, Germena G, et al. Disruption of ArhGAP15 results in hyperactive Rac1, affects the architecture and function of hippocampal inhibitory neurons and causes cognitive deficits. Sci Rep. 2016;6:34877.
Google Scholar
-
Tivodar S, Kalemaki K, Kounoupa Z, Vidaki M, Theodorakis K, Denaxa M, et al. Rac-GTPases Regulate Microtubule Stability and Axon Growth of Cortical GABAergic Interneurons. Cereb Cortex. 2015;25:2370–82.
Google Scholar
-
Hall A, Lalli G. Rho and Ras GTPases in axon growth, guidance, and branching. Cold Spring Harb Perspect Biol. 2010;2:a001818.
Google Scholar
-
Chen L, Liao G, Waclaw RR, Burns KA, Linquist D, Campbell K, et al. Rac1 controls the formation of midline commissures and the competency of tangential migration in ventral telencephalic neurons. J Neurosci. 2007;27:3884–93.
Google Scholar
-
Fan L, Lu Y, Shen X, Shao H, Suo L, Wu Q. Alpha protocadherins and Pyk2 kinase regulate cortical neuron migration and cytoskeletal dynamics via Rac1 GTPase and WAVE complex in mice. Elife. 2018;7:1–26.
-
Zamboni V, Armentano M, Berto G, Ciraolo E, Ghigo A, Garzotto D, et al. Hyperactivity of Rac1-GTPase pathway impairs neuritogenesis of cortical neurons by altering actin dynamics. Sci Rep. 2018;8:7254.
Google Scholar
-
Govek EE, Wu Z, Acehan D, Molina H, Rivera K, Zhu X, et al. Cdc42 REGULATES NEURONAL POLARITY DURING CEREBELLAR AXON FORMATION AND GLIAL-GUIDED MIGration. iScience. 2018;1:35–48.
Google Scholar
-
Katayama K, Imai F, Campbell K, Lang RA, Zheng Y, Yoshida Y. RhoA and Cdc42 are required in pre-migratory progenitors of the medial ganglionic eminence ventricular zone for proper cortical interneuron migration. Development. 2013;140:3139–45.
Google Scholar
-
de Curtis I. Roles of Rac1 and Rac3 GTPases during the development of cortical and hippocampal GABAergic interneurons. Front Cell Neurosci. 2014;8:307.
Google Scholar
-
Vidaki M, Tivodar S, Doulgeraki K, Tybulewicz V, Kessaris N, Pachnis V, et al. Rac1-dependent cell cycle exit of MGE precursors and GABAergic interneuron migration to the cortex. Cereb Cortex. 2012;22:680–92.
Google Scholar
-
Yang T, Sun Y, Zhang F, Zhu Y, Shi L, Li H, et al. POSH localizes activated Rac1 to control the formation of cytoplasmic dilation of the leading process and neuronal migration. Cell Rep. 2012;2:640–51.
Google Scholar
-
Pacary E, Heng J, Azzarelli R, Riou P, Castro D, Lebel-Potter M, et al. Proneural transcription factors regulate different steps of cortical neuron migration through Rnd-mediated inhibition of RhoA signaling. Neuron. 2011;69:1069–84.
Google Scholar
-
Causeret F, Hidalgo-Sanchez M, Fort P, Backer S, Popoff MR, Gauthier-Rouviere C, et al. Distinct roles of Rac1/Cdc42 and Rho/Rock for axon outgrowth and nucleokinesis of precerebellar neurons toward netrin 1. Development. 2004;131:2841–52.
Google Scholar
-
Nakamura F, Osborn TM, Hartemink CA, Hartwig JH, Stossel TP. Structural basis of filamin A functions. J Cell Biol. 2007;179:1011–25.
Google Scholar
-
Sato M, Nagano T. Involvement of Filamin A and Filamin A-interacting protein (FILIP) in controlling the start and cell shape of radially migrating cortical neurons. Anatomical Science International. 2005;80:19–29.
Google Scholar
-
Bellanger JM, Astier C, Sardet C, Ohta Y, Stossel TP, Debant A. The Rac1-and RhoG-specific GEF domain of Trio targets filamin to remodel cytoskeletal actin. Nat Cell Biol. 2000;2:888–92.
Google Scholar
-
Bellanger JM, Estrach S, Schmidt S, Briançon-Marjollet A, Zugasti O, Fromont S, et al. Different regulation of the Trio Dbl-Homology domains by their associated PH domains. Biology of the Cell. 2003;95:625–34.
Google Scholar
-
Kholmanskikh SS, Dobrin JS, Wynshaw-Boris A, Letourneau PC, Ross ME. Disregulated RhoGTPases and actin cytoskeleton contribute to the migration defect in Lis1-deficient neurons. J Neurosci. 2003;23:8673–81.
Google Scholar
-
Wong K, Ren X-R, Huang Y-Z, Xie Y, Liu G, Saito H, et al. Signal transduction in neuronal migration: Roles of GTPase activating proteins and the small GTPase Cdc42 in the slit-robo pathway. Cell. 2001;107:209–21.
Google Scholar
-
Li Z, Aizenman CD, Cline HT. Regulation of Rho GTPases by cross-talk and neuronal activity in vivo. Neuron. 2002;33:741–50.
Google Scholar
-
Iden S, Collard JG. Crosstalk between small GTPases and polarity proteins in cell polarization. Nat Rev Mol Cell Biol. 2008;9:846–59.
Google Scholar
-
Duman JG, Mulherkar S, Tu YK, X Cheng J, Tolias KF. Mechanisms for spatiotemporal regulation of Rho-GTPase signaling at synapses. Neurosci Lett. 2015;601:4–10.
Google Scholar
-
Sander EE, Ten Klooster JP, Van Delft S, Van der Kammen RA, Collard JG. Rac downregulates Rho activity: reciprocal balance between both GTPases determines cellular morphology and migratory behavior. J Cell Biol. 1999;147:1009–21.
Google Scholar
-
van Rijssel J, van Buul JD. The many faces of the guanine-nucleotide exchange factor trio. Cell Adh Migr. 2012;6:482–7.
Google Scholar
-
Medley QG, Serra-Pages C, Iannotti E, Seipel K, Tang M, O’Brien SP, et al. The trio guanine nucleotide exchange factor is a RhoA target. Binding of RhoA to the trio immunoglobulin-like domain. J Biol Chem. 2000;275:36116–23.
Google Scholar
-
Cheng HW, Hsiao CT, Chen YQ, Huang CM, Chan SI, Chiou A, et al. Centrosome guides spatial activation of Rac to control cell polarization and directed cell migration. Life Sci Alliance. 2019;2:e201800135.
Google Scholar
-
van Haren J, Boudeau J, Schmidt S, Basu S, Liu Z, Lammers D, et al. Dynamic microtubules catalyze formation of navigator-TRIO complexes to regulate neurite extension. Curr Biol. 2014;24:1778–85.
Google Scholar
-
Marin O, Yaron A, Bagri A, Tessier-Lavigne M, Rubenstein JL. Sorting of striatal and cortical interneurons regulated by semaphorin-neuropilin interactions. Science. 2001;293:872–5.
Google Scholar
-
Rudolph J, Zimmer G, Steinecke A, Barchmann S, Bolz J. Ephrins guide migrating cortical interneurons in the basal telencephalon. Cell Adh Migr. 2010;4:400–8.
Google Scholar
-
Wahl S, Barth H, Ciossek T, Aktories K, Mueller BK. Ephrin-A5 induces collapse of growth cones by activating Rho and Rho kinase. J Cell Biol. 2000;149:263–70.
Google Scholar
-
Singh A, Winterbottom E, Daar IO. Eph/ephrin signaling in cell-cell and cell-substrate adhesion. Front Biosci (Landmark Ed). 2012;17:473–97.
Google Scholar
-
Jacob J. Cortical interneuron dysfunction in epilepsy associated with autism spectrum disorders. Epilepsia. 2016;57:182–93.
Google Scholar
-
Siehr MS, Noebels JL. Early rescue of interneuron disease trajectory in developmental epilepsies. Curr Opin Neurobiol. 2016;36:82–8.
Google Scholar
-
Baraban SC, Southwell DG, Estrada RC, Jones DL, Sebe JY, Alfaro-Cervello C, et al. Reduction of seizures by transplantation of cortical GABAergic interneuron precusors into Kv1.1 mutant mice. Proc Natl Acad Sci USA. 2009;106:15472–7.
Google Scholar
-
Hunt RF, Girskis KM, Rubenstein JL, Alvarez-Buylla A, Baraban SC. GABA progenitors grafted into the adult epileptic brain control seizures and abnormal behavior. Nat Neurosci. 2013;16:692–7.
Google Scholar
-
Hunt RF, Baraban SC. Interneuron transplantation as a treatment for epilepsy. Cold Spring Harb Perspect Med. 2015;5:a022376.
Google Scholar
-
Howard MA, Baraban SC. Synaptic integration of transplanted interneuron progenitor cells into native cortical networks. J Neurophysiol. 2016;116:472–8.
Google Scholar
-
Eid L, Lachance M, Hickson G, Rossignol E. Ex utero electroporation and organotypic slice cultures of embryonic mouse brains for live-imaging of migrating GABAergic interneurons. J Vis Exp. 2018;20:57526.
-
Marin O, Anderson SA, Rubenstein JL. Origin and molecular specification of striatal interneurons. J Neurosci. 2000;20:6063–76.
Google Scholar
-
De Marco Garcia NV, Karayannis T, Fishell G. Neuronal activity is required for the development of specific cortical interneuron subtypes. Nature. 2011;472:351–5.
Google Scholar
-
Fiolka R, Shao L, Rego EH, Davidson MW, Gustafsson MG. Time-lapse two-color 3D imaging of live cells with doubled resolution using structured illumination. Proc Natl Acad Sci USA. 2012;109:5311–5.
Google Scholar
-
Myers AK, Meechan DW, Adney DR, Tucker ES. Cortical interneurons require Jnk1 to enter and navigate the developing cerebral cortex. J Neurosci. 2014;34:7787–801.
Google Scholar
-
Myers AK, Cunningham JG, Smith SE, Snow JP, Smoot CA, Tucker ES. JNK signaling is required for proper tangential migration and laminar allocation of cortical interneurons. Development. 2020;147:dev180646.
Google Scholar
-
Castellani V, Chedotal A, Schachner M, Faivre-Sarrailh C, Rougon G. Analysis of the L1-deficient mouse phenotype reveals cross-talk between Sema3A and L1 signaling pathway in axonal guidance. Neuron. 2000;27:237–49.
Google Scholar
Acknowledgements
LE was funded through a Savoy Foundation postdoctoral fellowship, a Fonds de recherche du Québec-Santé (FRQ-S) postdoctoral fellowship, a Sainte-Justine Foundation fellowship, a postdoctoral fellowship from the Transforming Autism Care Consortium Quebec Autism Research Training Program and a Brain Canada Research Fund, with financial support from Health Canada and the Kids Brain Health Network. PKR and XJ received a Savoy Foundation postdoctoral fellowship. J-CL was supported by a Research Center grant (Center Interdisciplinaire de Recherche sur le Cerveau et l’Apprentissage; CIRCA) from the Fonds de recherche du Québec—Santé (FRQ-S), a Group grant from Université de Montréal (Groupe de recherche sur la signalisation et circuiterie neurale; GRSNC) and is the recipient of the Canada Research Chair in Cellular and Molecular Neurophysiology (CRC 950-231066). ER was awarded FRQ-S and CIHR career awards and is the current holder of a Tier II Canada Research Chair on the Neurobiology of Epilepsy. LL and EB-G are INSERM investigators. This project was funded through operating grants and awards to the E.R. lab from CURE Epilepsy, the Savoy Foundation, the Scottish Rite Foundation, the Epilepsy Canada Foundation, the Fonds de recherche du Québec en Santé (FRQ-S) and the Canadian Institutes for Health Research (CIHR). We would like to thank Sonia Garel for her insights, James Waldron for his technical support, the summer interns who participated in this project (Felicia Hansson, Gabrielle Godin, Petra Tamer, Lucas Toussaint, Louis Fauteux-Loiselle, Marc-André Ranger Emile Chamberlant and Estelle Douet), Elke Küster-Schöck for her technical support at the Plateforme d’Imagerie Microscopique (PIM) of the CHU Sainte-Justine Research Center, as well as Denise Carrier and the animal care workers at the CHU Sainte-Justine Research Center.
Author information
Authors and Affiliations
Contributions
LE, LL, PKR, SBTT, XJ, KT, AL-M, FC-L, AT, SB, ML-J, MM contributed to data acquisition and data analysis. LE wrote the manuscript. J-C, EB-G and ER contributed to study design, supervision of data analysis and edited the manuscript. All authors agreed with the final version of this manuscript.
Corresponding authors
Ethics declarations
Competing interests
The authors declare no competing interests.
Additional information
Publisher’s note Springer Nature remains neutral with regard to jurisdictional claims in published maps and institutional affiliations.
Supplementary information
Supplementary Figure 1
Supplementary Figure 2
Supplementary Figure 3
Supplementary video 1
Supplementary video 2
Supplementary video 3
Supplementary video 4
Supplementary video 5
Supplementary video 6
Supplementary video 7
Supplementary video 8
Supplementary video 9
Supplementary video 10
Supplementary video 11
Supplementary video 12
Supplementary video 13
Supplementary Table 1
Supplementary Figures, video and Table 1 legend
Rights and permissions
Open Access This article is licensed under a Creative Commons Attribution-NonCommercial-NoDerivatives 4.0 International License, which permits any non-commercial use, sharing, distribution and reproduction in any medium or format, as long as you give appropriate credit to the original author(s) and the source, provide a link to the Creative Commons licence, and indicate if you modified the licensed material. You do not have permission under this licence to share adapted material derived from this article or parts of it. The images or other third party material in this article are included in the article’s Creative Commons licence, unless indicated otherwise in a credit line to the material. If material is not included in the article’s Creative Commons licence and your intended use is not permitted by statutory regulation or exceeds the permitted use, you will need to obtain permission directly from the copyright holder. To view a copy of this licence, visit http://creativecommons.org/licenses/by-nc-nd/4.0/.
Reprints and permissions
About this article
Cite this article
Eid, L., Lokmane, L., Raju, P.K. et al. Both GEF domains of the autism and developmental epileptic encephalopathy-associated Trio protein are required for proper tangential migration of GABAergic interneurons.
Mol Psychiatry (2024). https://doi.org/10.1038/s41380-024-02742-y
-
Received: 23 December 2022
-
Revised: 19 August 2024
-
Accepted: 02 September 2024
-
Published: 19 September 2024
-
DOI: https://doi.org/10.1038/s41380-024-02742-y