Abstract
Geothermal features in Antarctica provide favorable conditions for diverse microorganisms, yet their genomic diversity remains poorly understood. Here, we present an integrated dataset comprising PacBio HiFi and Hi-C metagenomic sequencing, along with single-cell amplified genomes (SAGs) from two high-altitude geothermal sites, Mount Melbourne and Mount Rittmann, in Antarctica. The long-read HiFi sequencing, coupled with Hi-C, enhances the understanding of microbiome diversity and functionality in this unique ecosystem by providing more complete and accurate genomic information. SAGs complement this by recovering rare microbial taxa and offering a strain-resolved perspective. This dataset aims to deepen our understanding of microbial evolution and ecology in Antarctic geothermal environments, and facilitate cross-comparison with other geothermal environments globally.
Background & Summary
Geothermal features in Antarctica represent unique and extreme environments where heat from volcanic activity creates isolated oases of warmth amidst the frigid landscape. These geothermally influenced habitats can be found in exposed volcanic mountains, islands, and even subglacial environments1,2. Currently, there are four active geothermal sites in Antarctica: one on Deception Island in the South Shetland Islands near the Antarctic Peninsula, and three in continental Antarctica, specifically in Victoria Land (Mount Erebus, Mount Melbourne, and Mount Rittmann). Geothermal activity results in warm soils and fumaroles, which can support bryophytes and microbial life by providing liquid water and relatively stable temperatures, despite the harsh external climate. This unique thermal moderation enables the persistence of diverse microbial communities specifically adapted to the combined thermal and chemical extremes of these habitats.
Over the past four decades, researchers have explored microbial diversity in these Antarctic geothermal environments using various methodologies. Early studies relied heavily on culture-dependent techniques, leading to the identification of only a limited number of bacterial phyla3,4,5,6. However, the advent of molecular methods, such as marker gene-based surveys and shotgun metagenomics, has unveiled a surprisingly diverse array of both cosmopolitan and endemic prokaryotic lineages, encompassing over 20 phyla1,7,8,9. These microorganisms have evolved mechanisms to thrive in extreme conditions characterized by high temperatures, fluctuating pH levels, and the presence of various metals and sulfur compounds. These unique conditions facilitate the development of specialized metabolic pathways, including thermophilic and chemolithotrophic processes. Studying these microbial communities provides valuable insights into the resilience and adaptability of life, offering clues about the potential for life in similar extreme environments elsewhere on Earth and possibly on other planets. While previous research has primarily focused on Mount Erebus and Deception Island, there is a scarcity of studies conducted on Mount Melbourne and Mount Rittmann8,9,10,11.
Shotgun metagenomic sequencing provides a comprehensive overview of microbial community composition and function in various environments. Deeper sequencing enhances our understanding at the genome level by reconstructing metagenome-assembled genomes (MAGs), which is particularly useful in less complex environments12,13. However, this approach has limitations when short-read sequencing is applied: it often misses low-abundance taxa, and the resulting MAGs can be fragmented and error-prone14. Furthermore, short-read-based MAGs often represent population-level composite genomes, making it difficult to distinguish closely related species or strains15. In contrast, long-read metagenomic sequencing, particularly PacBio high-accuracy long-read (HiFi) sequencing, substantially improves nucleotide accuracy and read length, enabling the assembly of complete MAGs16. Hi-C sequencing also provides an advance for microbial ecology by chemically linking phages, plasmids to host cells, as well as retrieve strain-level MAGs using Hi-C contact maps17,18. Single-cell genomics, on the other hand, allows for the isolation and amplification of DNA from individual cells. This approach enables the detailed characterization of rare and uncultured microbes, revealing strain-level diversity that might be overlooked in bulk metagenomic analyses19. Single-cell amplified genomes (SAGs) are especially useful in uncovering unique adaptations and evolutionary strategies of microbes in extreme or specialized environments20,21. Therefore, integrating SAGs with PacBio HiFi and Hi-C metagenomic sequencing can significantly enhance our understanding of microbial diversity and functionality by providing more complete and accurate genomic information from both abundant and rare microbial community members.
Here, we present an integrated microbial genomic diversity dataset from two high-altitude geothermal sites, Mount Melbourne and Mount Rittmann, in Antarctica. This dataset includes Pacbio HiFi and Hi-C sequencing reads, resulting in 75 high-quality MAGs, 69% of which are single-contig MAGs. Additionally, 224 SAGs, derived from a nontargeted cell sorting method, were sequenced, assembled, and taxonomically identified. This collection of genomic data on bacteria and archaea facilitates a genome-level understanding of microbial communities and their functionalities in these unique environments, enabling researchers to make comparisons with other geothermal habitats on Earth.
Methods
Soil sampling
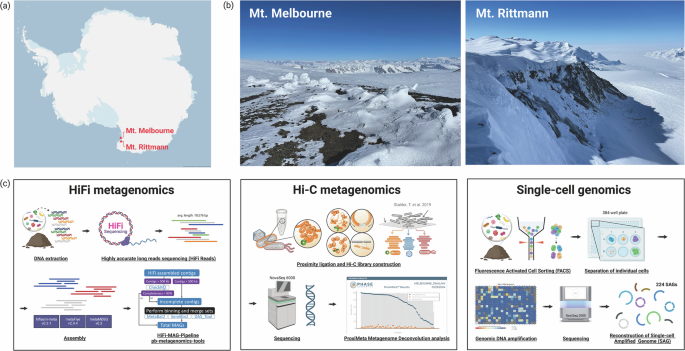
Soil sampling was conducted at two high-altitude geothermal sites located in northern Victoria Land, Antarctica: Mount Melbourne (74°21′S, 164°42′E; 2,733 m) and Mount Rittmann (73°27′S, 165°30′E; 2,600 m) (Fig. 1a and b; Table 1). These sites are within Antarctic Specially Protected Areas (ASPA) No. 175. At Mount Melbourne, four soil samples were collected along the Cryptogram Ridge, located at the northeast edge of an old caldera rim, and combined to form a composite sample. Similarly, at Mount Rittmann, four soil samples were collected from areas with active fumarolic activity on the upper and middle slopes of the caldera rim, and then pooled to create a composite sample. Surface soil temperatures in the Cryptogram Ridge reach 40 to 50 °C6, while temperatures of 43.4 °C have been recorded at Mount Rittmann22. To minimize the site contamination, we adhered to strict protocols, including the use of clean suits and masks during sampling. Surface soils (0–10 cm depth) were collected using sterilized trowels treated with 70% ethanol. The collected soil samples were transported to the Jang Bogo station and stored at −20 °C before being shipped to South Korea via air cargo under cold room conditions. Subsamples were placed in glycerol-TE buffer for subsequent single-cell sorting23.
Sampling locations and workflow for multi-modal microbiome profiling strategies. (a) Site map, (b) Landscape pictures of Mount Melbourne and Mount Rittmann, and (c) schematic workflows for Pacbio HiFi and Hi-C metagenomic sequencing, and single-cell genomics. This figure was created with BioRender.com.
PacBio HiFi metagenomic sequencing
DNA was extracted from 10 g of soils using the DNeasy PowerMax Soil Kit (QIAGEN) following the manufacturer’s instructions. Due to the low microbial biomass in these geothermal habitats, DNA from four separate extractions were pooled to generate a composite sample for each location. Electrophoresis was performed on a 1% agarose gel to visualize the extracted DNA. The quantity and quality of the extracted DNA were assessed using the PicoGreen (Invitrogen) method with a Victor 3 Fluorometry. The DNA size distribution was determined using the Femto Pulse method (Agilent), revealing average fragment sizes of 17,167 bp for Mount Melbourne and 10,156 bp for Mount Rittmann. The genomic DNA was sheared using the Megarupor3 and purified using AMPurePb magnetic beads. HiFi SMRTbell libraries were then prepared following the PacBio protocol “Preparing 10 kb library using SMRTbell Express Template Prep kit 2.0 for metagenomics shotgun sequencing”, and subsequently annealed with the Sequel II Bind Kit 2.2 and Internal Control Kit 1.0.0. Sequencing was performed on the Sequel II platform (Pacific Biosciences) using the Sequel II Sequencing Kit 2.0 and Sequel II SMRT cell 8 M Tray, with a 30-h video recorded for each SMRT cell. Library preparation and PacBio HiFi sequencing were carried out at Macrogen Inc. (Seoul, Republic of Korea).
Summary statistics of HiFi reads were calculated and visualized using Pauvre24. HiFi sequencing reads were assembled using three different assemblers: metaFlye v2.9.425, hifiasm-meta v0.3.1 (r63.2)26, and metaMDBG-0.327. We ran hifiasm-meta with the default parameters, and primary contigs (p_ctg.gfa) were used for further analyses. metaFlye was executed with the –pacbio-hifi and –meta options. metaMDBG was run with its default settings, and “l” (linear), “c” (circular), and “rc” (rescued circular) contigs were used. Minimap2-v2.28 (r1209)28 was used with the ‘-ax map-hifi’ option to determine the fraction of reads mapped to the assemblies.
The resultant assemblies were then input into the HiFi-MAG-Pipeline from pb-metagenomics-tools29 to generate high-quality MAGs (Fig. 1c). In brief, contigs underwent a ‘completeness-aware’ strategy, retaining MAGs with ≥93% completeness as high-quality outputs, while MAGs with <93% completeness are subjected to additional binning and refining pathways to improve their quality.
Hi-C sequencing
20 g of soil sample was processed following the low biomass protocol outlined in the ProxiMetaTM Hi-C Kit Protocol v4.0. Hi-C libraries were then prepared using ProxiMetaTM Kit (Phage Genomics, Seattle, WA) according to the manufacturer’s instructions (Fig. 1c). This procedure includes cross-linking, digestion, and the formation of chimeric junctions. Subsequently, the H-C libraries were sequenced on the NovaSeq6000 paired-end 150 bp at DNA Link Inc. (Seoul, Republic of Korea). The raw Hi-C reads and HiFi assembled contigs were analyzed using ProxiMeta metagenome deconvolution platform30.
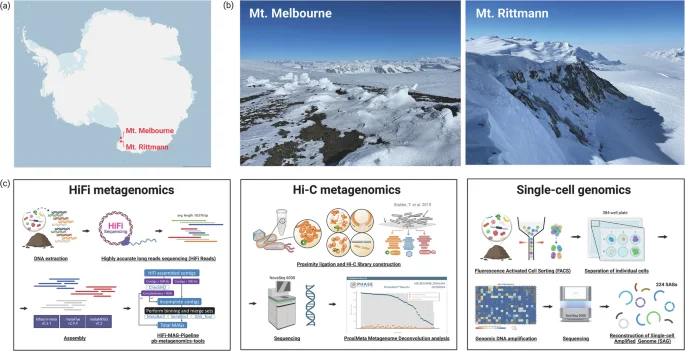
Recovered MAGs from both HiFi-MAG-Pipeline (HiFi reads) and ProxiMeta (Hi-C reads) were dereplicated using dRep v3.5.0 at an average nucleotide identity (ANI) >0.99 and maximum alignment coverage >0.95 to remove redundant contigs while retaining strain-level diversity31. CheckM2 v1.0.232 was used to assess the quality of MAGs, and phylogenetic inference and taxonomic assignment of MAGs were performed using GTDB-Tk v2.4.033 with GTDB release 214. We defined high-quality MAGs as those with ≥90% completeness and ≤5% contamination. The resultant genome tree was then annotated and visualized using Interactive Tree of Life (iTOL) v6.9.134 (Fig. 2).
Genome tree of metagenome-assembled genomes (MAGs) and single-cell amplified genomes (SAGs). In total, 75 dereplicated high-quality MAGs, and 21 medium-quality SAGs were included in the tree.
Single-cell genomics
Soil samples were shipped with dry ice to the Bigelow Laboratory for Ocean Sciences’ Single Cell Genomics Center (SCGC), and microbial cells were sorted following SCGC procedures (Fig. 1c). In brief, microbial particles were stained with the fluorescent DNA stain SYTO-9 (Thermo Fisher Scientific) and then sorted using an inFlux Mariner (Beckman Coulter). Each sample was sorted into two 384-well plates by fluorescence-activated cell sorting (FACS). The cells were lysed through two freeze-thaw cycles followed by KOH treatment, and genomic DNA was amplified using Whole Genome Amplification-X (WGA-X®)35. WGA Cp values indicate time (in hours) required to reach half of the maximal DNA-SYTO-9 fluorescence. Per plate, 64 negative control (no droplet) and 3 positive control (10 cells per well) were included.
Sequencing libraries were prepared using Nextera XT (Illumina), and sequencing was performed on an Illumina NextSeq2000 with P3 reagents (2 × 100 bp), resulting in approximately 1.1 billion paired-end reads. Initial quality trimming of raw reads was performed using Trimmomatic v0.3936 and de novo assembly was conducted using SPAdes v2.2.1037. Contigs shorter than 2,000 bp were removed. Completeness and contamination of SAGs were determined using CheckM2 v1.0.232. Contaminant contigs were identified by principal component analysis on nucleotide tetramer frequencies38. Functional annotation was performed by Prokka39, supplemented by Swiss-Prot database.
The quality of SAGs was determined based on the Minimum Information about a Single Amplified Genome (MISAG)40. SAGs with <50% completeness were considered ‘low quality’, while those with ≥50% completeness and <10% contamination were considered ‘medium quality’. The recovery of rRNA genes were checked by Barrnap v0.941. Taxonomic assignment of SAG was performed using GTDB-Tk v2.4.033, and classification based on rRNA genes was carried out using SILVA v138.1 database42.
Data Records
The PacBio HiFi and Hi-C sequencing reads, along with single-cell amplified genomes (SAGs), are submitted to the NCBI Sequence Reads archive (SRA) under BioProject accession number PRJNA112633143. HiFi reads are available at SRR29483436 and SRR29483437, Hi-C at SRR29496777 and SRR2949677843. High-quality MAGs are available at SRR30404090-SRR30463440 and SAGs at SRR29679156-SRR29679379 under the same NCBI Bioproject43. The detailed information for MAGs (Supplementary Table 1), SAGs (Supplementary Table 2), and virus-host associations (Supplementary Table 3) were deposited to figshare44 with https://doi.org/10.6084/m9.figshare.26157934.
Technical Validation
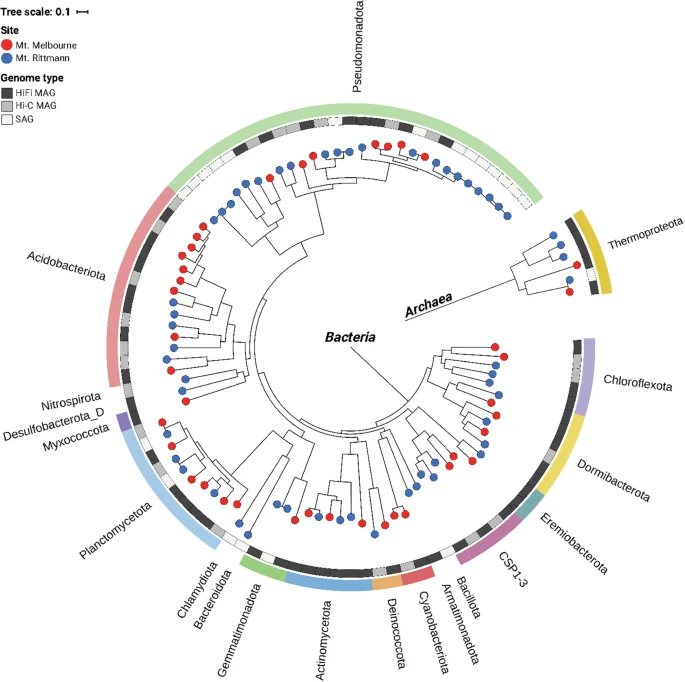
Pacbio HiFi sequencing generates long read lengths with high accuracy (99.9% single-molecule read accuracy) using the circular consensus sequencing (CCS) method. HiFi read length and quality distribution for two samples demonstrate the generation of high-quality reads with long read length: 11,808 bp ± 4,112 bp (mean ± standard deviation) for Mount Melbourne, and 9,343 bp ± 3,139 bp for Mount Rittmann (Fig. 3a and d; Table 2). The MAGs that passed the HiFi-MAG-Pipeline criteria (≥70% completeness, ≤10% contamination, <20 contigs) include 113 MAGs from Mount Melbourne (Fig. 3b and c) and 89 MAGs from Mount Rittmann (Fig. 3e and f). Dereplication at 99% ANI yielded 57 high-quality MAGs.
Quality validation for PacBio HiFi reads and recovered metagenome-assembled genomes (MAGs). Pacbio HiFi read length and quality distribution for (a) Mount Melbourne and (d) Mount Rittmann. (b,e) show the relationship between completeness and contamination for all generated MAGs with marginal density plots, highlighting the quality pass criteria of completeness >70% and contamination <10%. (c,f) display the relationship between completeness and contamination for the quality-criteria passed MAGs. (a), (b), and (c) represent data from Mount Melbourne, while (d), (e), and (f) correspond to data from Mount Rittmann.
ProxiMeta generated 83 and 259 clusters (proximity-assembled genomes) for Mount Melbourne and Mount Rittmann, respectively (Table 2). Proximity ligation binning resulted in a 31.6% increase (from 57 MAGs to 75 MAGs) in the total number of high-quality MAGs compared to those obtained solely from the HiFi-MAG-Pipeline. Of these, 29 MAGs (39%) were unique to the HiFi-MAG-Pipeline, 18 MAGs (24%) were unique to ProxiMeta, and 28 MAGs (37%) were shared between the HiFi-MAG-Pipeline and ProxiMeta (Fig. 4a). ProxiMeta also identified 14 virus-host associations44, though no plasmids were linked to their host MAGs.
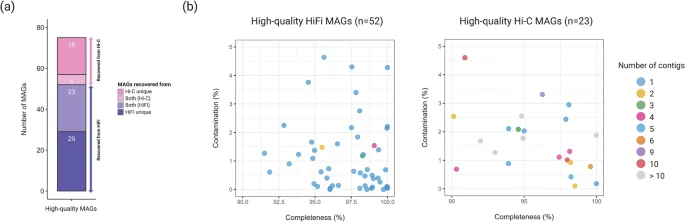
The final set of high-quality metagenome-assembled genomes (MAGs) obtained from both HiFi and Hi-C reads. (a) Categories of high-quality MAGs and (b) the relationship between completeness and contamination for MAGs from each method. In panel (a), ‘Hi-C unique’ refers to MAGs unique to ProxiMeta-based binning, ‘HiFi unique’ refers to MAGs unique to the HiFi-MAG-Pipeline, and ‘Both (Hi-C or HiFi)’ represents MAGs shared between the two methods but preferentially selected by one based on the MAG quality.
In single-cell genomics, we used WGA-X for genomic DNA amplification instead of multiple displacement amplification (MDA) to enhance genome recovery and reduce amplification biases42. SAGs chosen for sequencing were selected based on their low Cp values, as genome recovery has been shown to increase with decreasing WGA-X Cp values (hours)35. Among 490 positive wells, 224 wells with Cp values less than 02:13 were selected for genome sequencing, comprising 108 from Mount Melbourne and 116 from Mount Rittmann. The completeness of these SAGs ranged broadly from 3.69% to 80.38% (Fig. 5), consistent with findings from other soil studies45,46. Contamination levels were low, averaging 0.21%, with only one SAG above 10% and all others below 2%. Additionally, 135 out of 224 SAGs (60.3%) recovered 16S rRNA sequences, indicating a higher retrieval rate of 16S rRNA genes compared to previous single-cell genomics studies in soil45,47.
Quality validation plots for single-cell amplified genomes (SAGs). Relationship between completeness and contamination for all generated SAGs with marginal box plots for (a) Mount Melbourne, and (b) Mount Rittmann.
Usage Notes
We sequenced 224 SAGs out of 490 positive wells, leaving more than half of the SAGs unsequenced. We encourage researchers to use these stored SAGs for taxonomic identification based on SSU rRNA gene or genome sequencing. Despite advancements in chemistry, our SAGs still exhibit low genome recovery while retaining low contamination <2% (Fig. 5). This limitation can be mitigated by co-assembling multiple SAGs that are closely related, or by performing hybrid assemblies that combine SAGs with bulk metagenomic data obtained from the same samples48.
Code availability
The code and associated run parameters for the bioinformatics workflow, along with software versions, are available on figshare43 File 4: Code_availability.txt (https://doi.org/10.6084/m9.figshare.26157934).
References
-
Herbold, C. W., McDonald, I. R. & Cary, S. C. Microbial Ecology of Geothermal Habitats in Antarctica. In Antarctic Terrestrial Microbiology (ed. Cowan, D.) 181-215 (Springer, Berlin, Heidelberg, 2014).
-
Dziadek, R., Ferraccioli, F. & Gohl, K. High geothermal heat flow beneath Thwaites Glacier in West Antarctica inferred from aeromagnetic data. Commun. Earth Environ. 2, 162 (2021).
Google Scholar
-
Hudson, J. A. & Daniel, R. M. Enumeration of thermophilic heterotrophs in geothermally heated soils from Mount Erebus, Ross Island, Antarctica. Appl. Environ. Microbiol. 54, 622–624 (1988).
Google Scholar
-
Nicolaus, B. et al. “Bacillus thermoantarcticus” sp. nov., from Mount Melbourne, Antarctica: a novel thermophilic species. Polar Biol. 16, 101–104 (1996).
-
Nicolaus, B. et al. Alicyclobacilli from an unexplored geothermal soil in Antarctica: Mount Rittmann. Polar Biol. 19, 133–141 (1998).
-
Allan, R. et al. Brevibacillus levickii sp. nov. and Aneurinibacillus terranovensis sp. nov., two novel thermoacidophiles isolated from geothermal soils of northern Victoria Land, Antarctica. Int. J. Syst. Evol. Microbiol. 55, 1039–1050 (2005).
Google Scholar
-
Soo, R. M., Wood, S. A., Grzymski, J. J., McDonald, I. R. & Cary, S. C. Microbial biodiversity of thermophilic communities in hot mineral soils of Tramway Ridge, Mount Erebus, Antarctica. Environ. Microbiol. 11, 715–728 (2009).
Google Scholar
-
Vicente, J., de Celis, M., Alonso, A., Marquina, D. & Santos, A. Microbial Communities Present in Hydrothermal Sediments from Deception Island, Antarctica. Microorganisms. 9, 1631 (2021).
Google Scholar
-
Noell, S. E. et al. Antarctic geothermal soils exhibit an absence of regional habitat generalist microorganisms. Preprint at https://doi.org/10.1101/2024.06.06.597824 (2024).
-
Bendia, A. G. et al. A mosaic of geothermal and marine features shapes microbial community structure on deception Island Volcano, Antarctica. Front. Microbiol. 9, 899 (2018).
Google Scholar
-
Herbold, C. W., Lee, C. K., McDonald, I. R. & Cary, S. C. Evidence of global-scale aeolian dispersal and endemism in isolated geothermal microbial communities of Antarctica. Nat. Commun. 5, 3875 (2014).
Google Scholar
-
Stewart, R. D. et al. Assembly of 913 microbial genomes from metagenomic sequencing of the cow rumen. Nat. Commun. 9, 870 (2018).
Google Scholar
-
Delmont, T. O. et al. Nitrogen-fixing populations of Planctomycetes and Proteobacteria are abundant in surface ocean metagenomes. Nat. Microbiol. 3, 804–813 (2018).
Google Scholar
-
Maguire, F. et al. Metagenome-assembled genome binning methods with short reads disproportionately fail for plasmids and genomic islands. Microb. Genom. 6, e000436 (2020).
-
Chen, L. X., Anantharaman, K., Shaiber, A., Eren, A. M. & Banfield, J. F. Accurate and complete genomes from metagenomes. Genome Res. 30, 315–333 (2020).
Google Scholar
-
Kim, C. Y., Ma, J. & Lee, I. HiFi metagenomic sequencing enables assembly of accurate and complete genomes from human gut microbiota. Nat. Commun. 13, 6367 (2022).
Google Scholar
-
Wu, R. et al. Hi-C metagenome sequencing reveals soil phage–host interactions. Nat. Commun. 14, 7666 (2023).
Google Scholar
-
Yaffe, E. & Relman, D. A. Tracking microbial evolution in the human gut using Hi-C reveals extensive horizontal gene transfer, persistence and adaptation. Nat. Microbiol. 5, 343–353 (2020).
Google Scholar
-
Woyke, T., Doud, D. F. R. & Schulz, F. The trajectory of microbial single-cell sequencing. Nat. Methods. 14, 1045–1054 (2017).
Google Scholar
-
Rinke, C. et al. Insights into the phylogeny and coding potential of microbial dark matter. Nature. 499, 431–437 (2013).
Google Scholar
-
Anstett, J. et al. A compendium of bacterial and archaeal single-cell amplified genomes from oxygen deficient marine waters. Sci. Data. 10, 332 (2023).
Google Scholar
-
Bargagli, R., Broady, P. & Walton, D. Preliminary investigation of the thermal biosystem of Mount Rittmann fumaroles (northern Victoria Land, Antarctica). Antarct. Sci. 8, 121–126 (1996).
Google Scholar
-
Rinke, C. et al. Obtaining genomes from uncultivated environmental microorganisms using FACS–based single-cell genomics. Nat. Protoc. 9, 1038–1048 (2014).
Google Scholar
-
Schultz, D. T. Pauvre: QC and genome browser plotting Oxford Nanopore and PacBio long reads. Github https://github.com/conchoecia/pauvre (2019).
-
Kolmogorov, M. et al. metaFlye: scalable long-read metagenome assembly using repeat graphs. Nat. Methods. 17, 1103–1110 (2020).
Google Scholar
-
Feng, X., Cheng, H., Portik, D. & Li, H. Metagenome assembly of high-fidelity long reads with hifiasm-meta. Nat. Methods. 19, 671–674 (2022).
Google Scholar
-
Benoit, G. et al. High-quality metagenome assembly from long accurate reads with metaMDBG. Nat. Biotechnol. 42, 1–6 (2024).
-
Li, H. Minimap2: pairwise alignment for nucleotide sequences. Bioinformatics. 34, 3094–3100 (2018).
Google Scholar
-
Portik, D. M. et al. Highly accurate metagenome-assembled genomes from human gut microbiota using long-read assembly, binning, and consolidation methods. Preprint at https://doi.org/10.1101/2024.05.10.593587 (2024).
-
Press, M. O. et al. Hi-C deconvolution of a human gut microbiome yields high-quality draft genomes and reveals plasmid-genome interactions. Preprint at https://doi.org/10.1101/198713 (2017).
-
Olm, M. R., Brown, C. T., Brooks, B. & Banfield, J. F. dRep: a tool for fast and accurate genomic comparisons that enables improved genome recovery from metagenomes through de-replication. ISME J. 11, 2864–2868 (2017).
Google Scholar
-
Chklovski, A., Parks, D. H., Woodcroft, B. J. & Tyson, G. W. CheckM2: a rapid, scalable and accurate tool for assessing microbial genome quality using machine learning. Nat. Methods. 20, 1203–1212 (2023).
Google Scholar
-
Chaumeil, P.-A., Mussig, A. J., Hugenholtz, P. & Parks, D. H. G. T. D. B.- Tk: a toolkit to classify genomes with the Genome Taxonomy Database. Bioinformatics. 36, 1925–1927 (2020).
Google Scholar
-
Letunic, I. & Bork, P. Interactive Tree of Life (iTOL) v6: recent updates to the phylogenetic tree display and annotation tool. Nucleic Acids Res. 52, W78–W82 (2024).
Google Scholar
-
Stepanauskas, R. et al. Improved genome recovery and integrated cell-size analyses of individual uncultured microbial cells and viral particles. Nat. Commun. 8, 84 (2017).
Google Scholar
-
Bolger, A. M., Lohse, M. & Usadel, B. Trimmomatic: a flexible trimmer for Illumina sequence data. Bioinformatics. 30, 2114–2120 (2014).
Google Scholar
-
Bankevich, A. et al. SPAdes: a new genome assembly algorithm and its applications to single-cell sequencing. Comput. Biol. 19, 455–477 (2012).
Google Scholar
-
Woyke, T. et al. Assembling the marine metagenome, one cell at a time. PLoS ONE. 4, e5299 (2009).
Google Scholar
-
Seemann, T. Prokka: rapid prokaryotic genome annotation. Bioinformatics. 30, 2068–2069 (2014).
Google Scholar
-
Bowers, R. M. et al. Minimum information about a single amplified genome (MISAG) and a metagenome-assembled genome (MIMAG) of bacteria and archaea. Nat. Biotechnol. 35, 725–731 (2017).
Google Scholar
-
Seemann, T. barrnap 0.9: rapid ribosomal rna prediction. Github https://github.com/tseemann/barrnap (2013).
-
Quast, C. et al. The SILVA ribosomal RNA gene database project: improved data processing and web-based tools. Nucleic Acids Res. 41, D590–D596 (2012).
Google Scholar
-
NCBI Sequence Read Archive https://identifiers.org/ncbi/insdc.sra:SRP515179 (2024).
-
Myeong, N. R. et al. A summary of metagenome-assembled genomes (MAGs) and single-cell amplified genomes (SAGs) from Antarctic geothermal habitats. Figshare https://doi.org/10.6084/m9.figshare.26157934 (2024).
-
Nishikawa, Y. et al. Validation of the application of gel beads-based single-cell genome sequencing platform to soil and seawater. ISME Commun. 2, 92 (2022).
Google Scholar
-
Aoki, W. et al. Massively parallel single-cell genomics of microbiomes in rice paddies. Front. Microbiol. 13, 1024640 (2022).
Google Scholar
-
Choi, J. et al. Strategies to improve reference databases for soil microbiomes. ISME J. 11, 829–834 (2017).
Google Scholar
-
Arikawa, K. et al. Recovery of strain-resolved genomes from human microbiome through an integration framework of single-cell genomics and metagenomics. Microbiome. 9, 1–16 (2021).
Acknowledgements
This work was supported by Korea Polar Research Institute (KOPRI) grant funded by the Ministry of Oceans and Fisheries (KOPRI, PE24460 and PE24070), and the Chung-Ang University Graduate Research Scholarship in 2017. We gratefully acknowledge the invaluable contributions of KOPRI scientists, Hadong Park and Hyuntae Joo, mountaineer Donghwa Kim for soil sampling, and Yooha Song for assistance with Hi-C library preparation.
Author information
Authors and Affiliations
Contributions
M.K. conceived the study, and M.K. and Y.C. collected samples. Y.C. and N.R.M. extracted DNA, and prepared libraries for Pacbio HiFi and H-C sequencing. N.R.M. handled sample pre-treatment for single-cell genomics. M.K., N.R.M., S.C.S. and J.K. performed bioinformatic analyses. The manuscript was written by N.R.M., M.K. and W.J.S. with contributions and approval from all authors.
Corresponding author
Ethics declarations
Competing interests
The authors declare no competing interests.
Additional information
Publisher’s note Springer Nature remains neutral with regard to jurisdictional claims in published maps and institutional affiliations.
Rights and permissions
Open Access This article is licensed under a Creative Commons Attribution-NonCommercial-NoDerivatives 4.0 International License, which permits any non-commercial use, sharing, distribution and reproduction in any medium or format, as long as you give appropriate credit to the original author(s) and the source, provide a link to the Creative Commons licence, and indicate if you modified the licensed material. You do not have permission under this licence to share adapted material derived from this article or parts of it. The images or other third party material in this article are included in the article’s Creative Commons licence, unless indicated otherwise in a credit line to the material. If material is not included in the article’s Creative Commons licence and your intended use is not permitted by statutory regulation or exceeds the permitted use, you will need to obtain permission directly from the copyright holder. To view a copy of this licence, visit http://creativecommons.org/licenses/by-nc-nd/4.0/.
Reprints and permissions
About this article
Cite this article
Myeong, N.R., Choe, YH., Shin, S.C. et al. Genomic profiling of Antarctic geothermal microbiomes using long-read, Hi-C, and single-cell techniques.
Sci Data 11, 1023 (2024). https://doi.org/10.1038/s41597-024-03875-z
-
Received: 08 July 2024
-
Accepted: 11 September 2024
-
Published: 19 September 2024
-
DOI: https://doi.org/10.1038/s41597-024-03875-z