Abstract
The folate requirements for beef cattle have not been established. Therefore, we investigated whether rumen-unprotected folic acid supplementation during the fattening period affects carcass traits and nutritional metabolism in Japanese Black beef cattle. Eighteen Beef cattle aged 16 months were divided into three groups: control, low folic acid supplementation (0.43 g DM/day), and high folic acid supplementation (0.86 g DM/day). Treatment was administered for 12 months. Folic acid supplementation dose-dependently increased serum folate levels, suggesting that supplemental folic acid can be absorbed into the body. Folic acid supplementation dose-dependently decreased serum vitamin B12 levels, while plasma total homocysteine and methylmalonic acid levels—markers for deficiency of folate and/or vitamin B12—were unaffected. Thus, the treatment did not clearly affect the nutritional status of these vitamins. Supplementation increased body weight, with no negative effects on other carcass traits. The levels of insulin-like growth factor 1, retinol, albumin, and some amino acids in serum or plasma were affected by supplementation. These results suggest that rumen-unprotected folic acid supplementation during the fattening period could increase the body weight of Japanese Black beef cattle and the mechanism of action may be related to growth-related hormones and/or the metabolism of some nutrients, including folate.
Introduction
Water-soluble B vitamins are generally biosynthesized by microorganisms in the rumen1, and deficiencies in these vitamins are rarely observed in cattle. However, recent studies have revealed the beneficial effects of vitamin B supplementation on the productive performance of dairy cows and beef cattle2,3,4,5,6,7. Therefore, it can be speculated that at least under some conditions, vitamin B supply from the diet and rumen microbiota is not sufficient for productive performance and/or health in dairy cows and beef cattle.
Folic acid, as a vitamin B complex, plays an important role in the synthesis of purines and pyrimidines; synthesis, repair, and methylation of DNA; synthesis of phosphatidylcholine; and the transfer of one carbon unit required for protein and nucleotide biosynthesis8,9. The folate requirements for beef cattle have not been established, probably because folate is endogenously synthesized by ruminal microorganisms10,11. Several studies have evaluated the use of folic acid in beef cattle. In addition to the ruminal total volatile fatty acid (VFA) concentration, cellulolytic bacterial abundance and enzyme activity were found to increase with folic acid supplementation in steers6,12. Advances in genetics, nutrition, and technology have significantly improved growth and production performance in recent decades. Nevertheless, folate synthesized from the rumen or derived from forage sources may not be sufficient to meet the requirements of productive and rapidly growing ruminants.
Excessive folic acid supplementation could induce vitamin B12 deficiency in cattle13. Therefore, the nutritional status of both vitamins in the body must be evaluated for the study on folic acid supplementation. One study that has investigated the effects of supplemental folic acid in cattle used related parameters (blood levels of both vitamins and their deficiency markers) and discussed their effects on the nutritional status of dairy cows14. However, to our knowledge, no study has used these related parameters to evaluate the effects of supplemental folic acid in beef cattle. There are two previous reports investigating of the effects of folic acid supplementation in beef cattle. One report indicated that supplementation with rumen-protected folic acid (29.13 mg DM/day) and cobalt (5.34 mg DM/day, a vitamin B12 substrate in rumen bacteria) could increase blood folate and vitamin B12 levels, whereas beneficial effects on carcass traits were not clearly detected15. We speculate that vitamin deficiency markers would be useful for interpreting the results, although they have not been tested. Another report indicated that supplementation with rumen-protected folic acid (119.14 mg DM/day) resulted in increased body weight gain, elevated rumen VFA concentrations, improved fiber digestion, and increased cellulolytic bacteria6. However, the deficiency markers were not evaluated. Based on these results, we speculated that increased body weight gain and its mechanism of action are worth focusing on. If increased folic acid-induced alteration of microbiota in the rumen is involved in the mechanism of action, we hypothesized that rumen-unprotected folic acid may be also effective even though its absorption into the body is low16.
Therefore, in the present study, for the first step to clarify our hypothesis, we investigated the effects of rumen-unprotected folic acid supplementation on beef cattle. In this study, we speculated that (1) not only folate and vitamin B12, but their deficiency markers in the blood will also be useful to evaluate the supplemental effects of folic acid in beef cattle; (2) to maximize the beneficial effect of folic acid supplementation, we must administer an adequate dose of cobalt simultaneously to prevent vitamin B12 deficiency, and (3) even though most previous studies used the rumen-protected form, if supplementation of rumen-unprotected folic acid is also effective, it may be acceptable in terms of the cost performance. Therefore, in the present study, we investigated whether supplementation of rumen-unprotected folic acid with an adequate dose of cobalt during the fattening period affects carcass traits and nutrient metabolism (folate, vitamin B12, etc.) in Japanese Black beef cattle.
Results
Folate and vitamin B12nutritional status
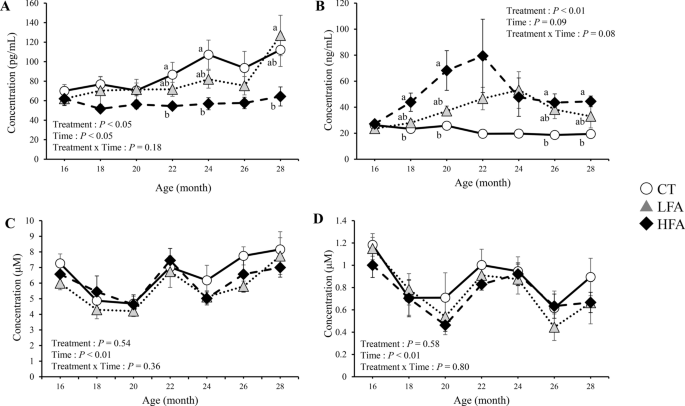
Figure 1 shows the effects of folic acid supplementation on folate and vitamin B12 nutritional status. Folate levels were higher in the high folic acid supplementation (HFA) group than in the control group at 18, 20, 26, and 28 months of age. The levels of vitamin B12 were lower in the HFA group than in the control group at 22, 24, and 28 months of age. Total homocysteine and methylmalonic acid levels in the plasma were not affected by treatment.

Effects of folic acid supplementation on folate and vitamin B12 nutritional status. (A) serum vitamin B12 level, (B) serum folate level, (C) plasma total homocysteine level, and (D) plasma methylmalonic acid level. CT Control group (n = 6). LFA Low folic acid supplementation group (n = 6). HFA High folic acid supplementation group (n = 6). Data are shown as the mean ± SEM. Different letters are significantly different at the same period by Tukey–Kramer test.
Growth performances
Figure 2 shows the effects of folic acid supplementation on the growth performance. Body weights were higher in the low folic acid supplementation (LFA) group than in the control group at 26 and 28 months of age. The daily weight gain in the LFA group was higher than in the control group at 24 and 26 months of age. Feed intake was higher in the LFA group than in the control group at 20, 22, 24, and 26 months of age. Feed intake was higher in the HFA group than in the control group at 24 and 26 months of age.
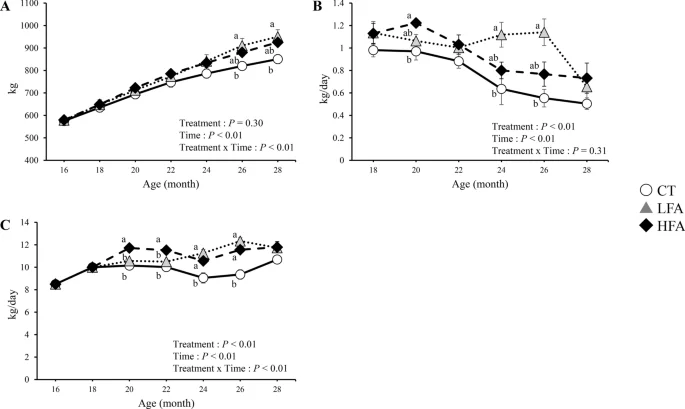
Effects of folic acid supplementation on the growth performance. (A) body weight, (B) daily gain, and (C) feed intake. CT Control group (n = 6). LFA Low folic acid supplementation group (n = 6). HFA High folic acid supplementation group (n = 6). Data are shown as the mean ± SEM. Different letters are significantly different at the same period by Tukey–Kramer test.
Carcass characteristics
Table 3 shows the effects of folic acid supplementation on carcass characteristics. The live weight in the LFA group was higher than that in the control group. Other parameters were not affected by the treatment.
Serum biochemical parameters, retinol, and IGF-1
Figure 3 shows the effects of folic acid supplementation on serum retinol, albumin, and insulin-like growth factor 1 (IGF-1) levels. The serum retinol levels gradually decreased from 16 to 22 months of age. During this period, serum retinol levels in the LFA group were lower than those in the control group at 18 and 20 months of age. Serum albumin levels in the LFA group were lower than those in the control group at the same age. The serum IGF-1 levels in the LFA group were higher than those in the control group at 24 months of age. Other blood biochemical parameters were not affected by treatment (Supplementary Table 1).
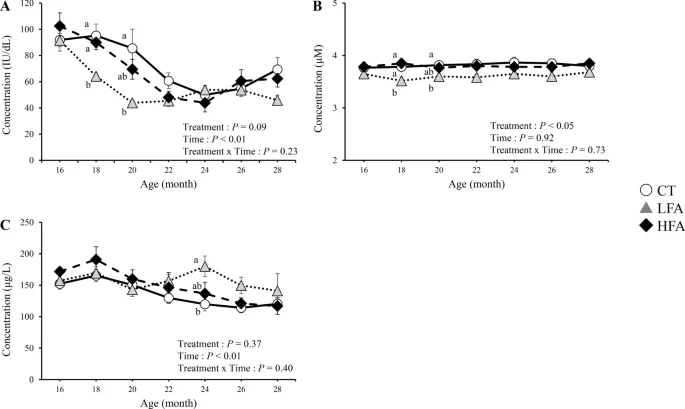
Effects of folic acid supplementation on serum retinol, albumin, and insulin-like growth factor 1 (IGF-1) levels. (A) serum retinol level, (B) serum albumin level, and (C) serum IGF-1 level. CT Control group (n = 6). LFA low folic acid supplementation group (n = 6). HFA High folic acid supplementation group (n = 6). Data are shown as the mean ± SEM. Different letters are significantly different at the same period by Tukey–Kramer test.
Plasma free amino acids and their metabolites
Figure 4 shows the effects of folic acid supplementation on plasma free aspartic acid, ornithine, kynurenine, leucine, phenylalanine, and tryptophan levels. At 18 months of age, aspartic acid, kynurenine, and leucine levels were lower in the LFA group than in the control group. Ornithine levels were lower in the HFA group than in the control group at 18 and 24 months of age. Phenylalanine levels were lower in the LFA group than in the control group at 24 months of age. Tryptophan levels were lower in the LFA group than in the control group at 18, 20, and 24 months of age. HFA affected one amino acid (ornithine), whereas LFA affected five amino acids (aspartic acid, kynurenine, leucine, phenylalanine, and tryptophan) in the plasma. The plasma levels of other free amino acids and related metabolites were not affected by treatment (Supplementary Table 2).
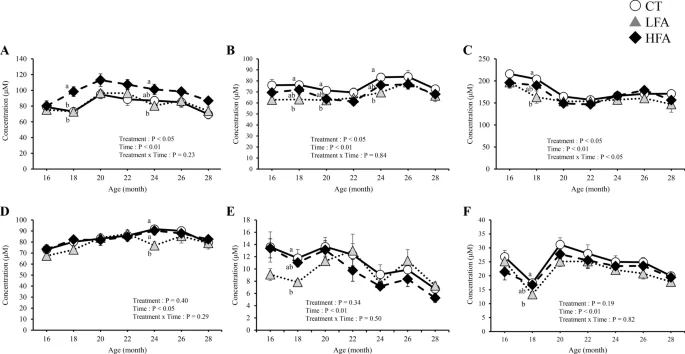
Effects of folic acid supplementation on plasma free aspartic acid, ornithine, kynurenine, leucine, phenylalanine, and tryptophan levels. (A) plasma ornithine level, (B) plasma tryptophan level, (C) plasma leucine level, (D) plasma phenylalanine level, (E) plasma aspartic acid level, and (F) plasma kynurenine level. CT Control group (n = 6) LFA Low folic acid supplementation group (n = 6) HFA High folic acid supplementation group (n = 6). Data are shown as the mean ± SEM. Different letters are significantly different at the same period by Tukey–Kramer test.
Discussion
Among the carcass traits analyzed, rumen-unprotected folic acid supplementation partially increased live weight while other carcass traits, such as subcutaneous fat, marbling score, and color score, remained unaffected. On the other hand, tendency of increased carcass weight was observed. These findings suggest that rumen-unprotected folic acid did not induce negative effects, and its potential benefits warrant further investigation.
Supplemental rumen-unprotected folic acid could, to some extent, be absorbed into the body because the treatment dose-dependently increased serum folate levels. Considering that the absorption efficacy of rumen-protected folic acid is much higher than that of rumen-unprotected folic acid16, we used a much higher dose of folic acid supplementation than the dose of rumen-protected folic acid used in studies on beef cattle6,15. These results and experimental conditions indicate that the present supplementation might affect not only the nutritional status of folate in the body but also the rumen microbiota by increasing the folate level in the rumen. Considering previous studies showing that supplemental rumen-protected folic acid increased body weight gain and improved rumen microbiota in beef cattle6, supplemental rumen-unprotected folic acid may enhance the performance of rumen microorganisms, which could be associated with improved feed intake and, consequently, lead to increased body weight gain. On the other hand, to understand more precisely, whether difference between rumen-protected folic acid (relatively low dose) and rumen-unprotected folic acid (relatively high dose) affects the body and microbiota cannot be ignored. Therefore, the nutritional status of both the body and rumen microbiota is of interest and worth focusing on in further studies.
Although folic acid supplementation decreased serum vitamin B12 levels in a dose-dependent manner, it did not affect plasma total homocysteine or methylmalonic acid levels, which are markers for deficiency of folate and/or vitamin B12. These results indicate that supplemental folic acid might accelerate vitamin B12 consumption in the body similar to the previous study13, but it did not induce vitamin B12 deficiency different from the previous study13. In addition, an increase in feed intake by folic acid supplementation did not induce deficiencies of either vitamin because both deficiency markers remained unaltered. However, the high folic acid supplementation may have induced negative effects because significant effects on increased body weight and daily weight gain were observed only with low folic acid supplementation and not with high folic acid supplementation. Further studies may be required to maximize the beneficial effects of folic acid focusing on the relationship between folate and vitamin B12 nutritional status.
To further increase the effectiveness of rumen-unprotected folic acid, focusing on other nutrients may be important. It was reported that rumen-protected folic acid or rumen-protected riboflavin inclusion increased average daily gain and their combination increased it more in beef cattle17. On the other hand, ruminally protected blend of folic acid, pantothenic acid, pyridoxine, biotin, and vitamin B12 had no effect on growth performance while the treatment altered carcass muscularity and rib fat accumulation affecting the overall yield grade distribution in finishing steers18. Taking these into consideration, in the case of rumen-unprotected folic acid used in the present study, effects of the combination with some vitamins, will be also worth evaluating in beef cattle.
IGF-1, retinol, albumin, aspartic acid, ornithine, kynurenine, leucine, phenylalanine, and tryptophan levels in serum or plasma, which could be linked to growth, were affected by the supplementation. Therefore, the mechanisms by which folic acid supplementation increases body weight may be related to these parameters. We focused on the effects of IGF-1, ornithine, and retinol.
IGF-1 is known to affect growth19, and several studies have focused on the contribution of IGF-1 to the growth of beef cattle20,21,22. As IGF-1 has been reported to be increased by feeding rumen-protected ornithine to sheep23, it can be hypothesized that elevated ornithine levels may contribute to the increase in serum IGF-1; consequently, body weight is increased by folic acid supplementation. For interpretation, the differential dose-specific effects on body weight, IGF-1, and ornithine should be considered; increased body weight and serum IGF-1 levels were observed only with low folic acid supplementation, whereas increased ornithine was confirmed only with high folic acid supplementation. One of our speculations is that if low folic acid supplementation increases ornithine synthesis in the liver and/or rumen microbiota, it might stimulate hepatic IGF-1 secretion, but it was not sufficient to increase plasma ornithine levels. To clarify this hypothesis, it is important to focus on metabolism in both the liver and rumen microbiota.
Serum retinol levels were decreased by folic acid supplementation, but not in a dose-dependent manner. To the best of our knowledge, the relationship between retinol and folate has not been clarified in detail in any animal model. Adequate serum retinol levels are important for animal growth. However, the low folic acid supplementation group, in which treatment reduced serum retinol levels, did not experience growth retardation. Increased IGF-1 secretion may compensate for the negative effects of low serum retinol levels on cell growth. In contrast, control of retinol levels in the blood (systematic decrease and recovery during the fattening period) is important for effective marbling of Japanese Black beef cattle. However, notably, decreased retinol levels due to folic acid supplementation were not linked to marbling in the present study. The relationships among folate, retinol, growth, and marbling should be investigated in future studies.
In the present study, we used methylmalonic acid and total homocysteine levels in the plasma as biomarkers for folate and/or vitamin B12 deficiency. Even though usefulness of these markers were well known in various animals, it will be also effective to check related bioactive metabolites simultaneously, for example, succinic acid (for methylmalonic acid), and taurine (for total homocysteine) levels in the plasma. We will evaluate these levels in the future study for more precise evaluation.
In conclusion, folic acid supplementation can increase body weight, and the mechanism of action may be linked to growth-related hormones and/or the metabolism of some nutrients, including folate. Further studies focusing on both the body and rumen microbiota are required to confirm our findings.
Materials and methods
Animals and dietary treatment
The animal experiments were approved by the Animal Care Committee of the ZEN-NOH Central Research Institute for Feed and Livestock (Tsukuba, Ibaraki, Japan) (experimental number 2024-K6). All animal experiments were conducted following the ethical guidelines of the Institute of Livestock and Grassland Science24. All animal studies followed the ARRIVE guidelines (https:// arriveguidelines.org). The experiments were conducted at the ZEN-NOH Research Farm (Kasama, Ibaraki, Japan). Japanese Black Steers aged 16 months (n = 18) were divided into three groups (n = 6 per one group) based on their bodyweights: the group not supplemented with a rumen-unprotected folic acid product (control), the group supplemented with a low dose of rumen-unprotected folic acid product (Scientific Feed Laboratory Co., Ltd., Takasaki, Gunma, Japan) at 25 g/day/head (low folic acid supplementation group; LFA group), or the group supplemented with a high dose of rumen-unprotected folic acid product at 50 g/day/head (high folic acid supplementation group; HFA group). The animals were housed in covered concrete pens (1 or 2 steers/pen). We determined the amount of folic acid supplementation to be 25 or 50 g/day/head because a preliminary study indicated that supplementation with this folic acid product at 15 g/day/head for a week did not significantly affect the serum folic acid concentration in steers (data not shown). Therefore, we speculate that more folic acid will be necessary to increase serum folic acid concentration. As the folic acid product contains 2% folic acid and 98% defatted rice bran, the actual folic acid supplementation for treatment steers was 0.5 g (0.43 g dry matter (DM)) or 1.0 g (0.86 g DM) /head per day, respectively. During morning feeding, a folic acid product was mixed by hand into the top third of the concentrate feed to ensure complete consumption by the steers.
The chemical compositions of the basal diet and feeding schedule are shown in Tables 1 and 2, respectively. All feed samples were dried at 60 °C for 48 h in a forced-air oven to determine DM content, ground to pass a 1-mm screen of a Wiley mill, and sent to Dairy One Forage Laboratory Services (Ithaca, NY) for wet chemistry analysis. Composites were analyzed for DM (method 942.05; AOAC International, 2006); CP (method 990.03; AOAC International, 2006); NDF25, determined using α-amylase and sodium sulfite adapted for an Ankom A200 digestion unit (Ankom Technology, Macedon, NY); ADF (method 973.18; AOAC International, 2006), adapted for an Ankom A200 digestion unit (Ankom Technology); ether extract (method 2003.05; AOAC International, 2006); and cobalt using an inductively coupled plasma radial spectrometer (Thermo Fisher Scientific Inc., Waltham, MA) after microwave digestion (CEM Corp., Matthews, NC) of the samples in a mixture of nitric and hydrochloric acid. Folate content was determined in feed samples using a microbiological assay with folate assay medium (Shimadzu Diagnostics Co., Tokyo, Japan) and a microplate reader (SH-1300 microplate reader, Corona Electric Co., Ltd., Ibaraki, Japan). The net energy for growth was calculated based on the National Academies of Sciences, Engineering, and Medicine (2016)26, which has reported the net energy for gain values of feedstuffs (Table 3).
All steers were fed commercial concentrate feed (Hitachi Kouki 2, JA Higashinihon Kumiai Shiryou, Ota, Japan) in progressively increasing amounts each month from 16 to 18 months of age and had ad libitum access to concentrate feed from 19 to 28 months of age. Because cobalt is used by rumen microorganisms to synthesize vitamin B12, and to ensure that vitamin B12 deficiency did not affect the response to folic acid supplementation, a cobalt supplement of 272 mg cobalt/kg DM was used to supplement all steers to achieve a range of 1.5–2.6 mg/kg DM of cobalt throughout the experiment (data not shown). This concentration of supplemental cobalt is well above the NASEM (2016)26 recommendation of 0.15 mg/kg DM, but well below the maximum tolerable concentration of 25 mg/kg DM.
These animals were also fed 0.2 kg/day/head of alfalfa hay from 23 to 28 months of age,2.0 kg/day/head of rice straw from 16 to 17 months of age, and 1.5 kg/day/head from 19 to 28 months of age. Feed was provided in two equal portions, at 09.30 and 16.30 h.
Feed intake, growth parameters, and carcass traits
Feed intake was calculated by measuring the residual quantities of roughage and concentrate and subtracting them from the feed supply at 09.00 h daily. All steers were slaughtered at 28 months of age in a certified slaughterhouse, where detailed carcass data were subsequently collected. The animals were initially stunned using a captive bolt pistol, inducing temporary unconsciousness through brain damage. Immediately following stunning, the cervical blood vessels were severed to facilitate exsanguination, resulting in death within 30 s, with bleeding as the primary cause. Carcass traits were graded in the slaughterhouse by the Japan Meat Grading Association (JMGA) for 6th to 7th intercostal carcass cross-sections according to beef carcass trading standards (JMGA, 1988)27.
Collection of the plasma and serum
Blood samples were collected from the jugular vein at 13.00 h at 16, 18, 20, 22, 24, 26, and 28 months of age using EDTA-2 K tubes and serum separator Vacutainer tubes, and the samples were immediately cooled on ice. The plasma and serum were separated via centrifugation (2,000 × g, 4 ℃, 20 min) and stored at -80 ℃ until further analyses.
Serum biochemical parameters, hormones, and vitamins
Concentrations of serum albumin (ALB), total cholesterol (TCHO), non-esterified fatty acids (NEFA), activity of aspartate aminotransferase (AST), γ-glutamyl transpeptidase (γ -GTP), and blood urea nitrogen (BUN) were measured using an automatic analyzer (JCA-BM8060, JEOL Ltd, Tokyo, Japan) with a bromocresol green method (Albumin HR II: Wako Pure Chemical Industries, Osaka, Japan), with an enzymatic method (Determiner L TC II: Kyowa Medex Co., Tokyo, Japan; NEFA HR II: Wako Pure Chemical Industries, Osaka, Japan), with the Japan Society of Clinical Chemistry (JSCC) transferable method (L-type Wako AST J2, L-type Wako γ-GTP J: Wako Pure Chemical Industries, Osaka, Japan), and with a urease and glutamate dehydrogenase method (L-type Wako UN: Wako Pure Chemical Industries, Osaka, Japan), respectively. The concentration of glucose (GLU) was determined using an automatic analyzer (JCA-BM9130, JEOL Ltd., Tokyo, Japan) and an enzymatic method (L-type Wako Glu2: Wako Pure Chemical Industries, Osaka, Japan). Serum IGF-1 levels were assayed using an immunoradiometric assay kit (IGF-1 IRMA Daiichi, Fujirebio Inc., Tokyo, Japan). Serum concentrations of vitamin B12 and folate were measured using a chemiluminescent enzyme immunoassay (CLEIA) on a UniCel DxI 800 immunoassay system (Beckman Coulter, Inc., CA, USA).
Plasma total homocysteine and methylmalonic acid
The total homocysteine and methylmalonic acid levels in cattle plasma were determined using gas chromatography-mass spectrometry (GC/MS) with SPL-M100, an online solid-phase derivatization system for GC (AiSTI SCIENCE, Wakayama, Japan). Homocysteine pre-treatment was performed as follows: 100 μL of plasma sample or a 100 μL of standard solution of homocysteine, 20 μL of 50 μM internal standards (DL-homocystine-3,3,3′,3′,4,4,4′,4′-d8, C/D/N Isotopes, Inc (Pointe-Claire, Quebec, Canada), 160 μL of distilled water, 700 μL of acetonitrile, and 20 μL of 100 g/L Tris(2-carboxyethyl) phosphine hydrochloride (TCEP, Wako Pure Chemical Industries, Osaka, Japan) for the reduction of disulfide bonds was vortexed at 1200 rpm for 30 min at 40 °C. Subsequently, the sample was centrifuged at 20,000 × g for 3 min at 4 °C, and 500 μL of the supernatant was mixed with 500 μL of distilled water. The mixture was then subjected to GC/MS to determine the homocysteine content. Pretreatment with methylmalonic acid was performed as follows: 100 μL of plasma sample or a 100 μL standard solution of methylmalonic acid, 20 μL of 33.3 μM internal standards (methylmalonic acid-d3, Cambridge Isotope Laboratories, MA, USA), 80 μL of distilled water, and 800 μL of acetonitrile was vortexed at 1200 rpm for 30 min at 37 °C. The sample was then centrifuged at 20,000 × g for 3 min at 4 °C, and 500 μL of the supernatant was mixed with 500 μL of distilled water. The mixture was then subjected to gas chromatography-mass spectrometry (GC/MS). GC/MS analysis was performed using a GCMS-TQ8050 instrument (Shimadzu, Kyoto, Japan). The analysis was performed using a previously reported method28. Sample preparation from extraction to injection was performed automatically using the SPL-M100. Solid-phase cartridges, flash-SPE CXs, and flash-SPE AXs (containing 5 mg of adsorbent) were purchased from AiSTI SCIENCE. The CX solid phase contains a polymer-based resin with sulfonic acid functional groups, whereas the AX solid phase contains a polymer-based resin with quaternary alkylammonium functional groups. The solid-phase cartridge was conditioned with 250 μL of 50% (v/v) acetonitrile in ultra-pure water (flow rate: 10 μL/s). Next, 25 μL of the sample and 175 μL of 50% (v/v) acetonitrile in ultra-pure water (flow rate: 3 μL/s), 250 μL of acetonitrile (flow rate: 10 μL/s), and 250 μL of acetonitrile (flow rate: 20 μL/s) were passed through the cartridge, in order. After drying the resin in the cartridge using nitrogen gas, 3 μL of methoxyamine hydrochloride (5 g/L in pyridine) was loaded, and the cartridge was left for 3 min. After drying using nitrogen gas again, 8 μL of 77% (v/v) N-tert-Butyldimethylsilyl-N-methyltrifluoroacetamide (Thermo Scientific, Waltham, MA, USA) in toluene was loaded, and the cartridge was left for 1 min. Finally, the analytes were eluted using 25 μL of hexane (flow rate: 2 μL/s) and directly injected into the GC/MS.
Plasma levels of free amino acids and their metabolites
The plasma levels of free amino acids and their metabolites were quantified using GC/MS29.
Statistical analysis
Data were analyzed using repeated-measures multivariate analysis of variance or one-way analysis of variance (JMP®13.2.1 software; SAS Institute Inc., Cary, NC, USA). A multiple comparison test was performed using the Tukey–Kramer test. Differences of P < 0.05 were considered significant. Before these analyses, outliers were eliminated by identifying data points beyond 1.5 times the interquartile range (IQR) from the quartiles.
Data availability
Data is provided within the manuscript or supplementary information files.
References
-
Bechdel, S. I., Honeywell, H. E., Dutcher, R. A. & Knutsen, M. H. Synthesis of vitamin B in the rumen of the cow. J. Biol. Chem. 80, 231–238 (1928).
Google Scholar
-
Campbell, J. R., Greenough, P. R. & Petrie, L. The effects of dietary biotin supplementation on vertical fissures of the claw wall in beef cattle. Can. Vet. J. 41, 690–694 (2000).
Google Scholar
-
Girard, C. L. & Duplessis, M. Review: State of the knowledge on the importance of folates and cobalamin for dairy cow metabolism. Animal 17(Supplement 3), 100834 (2023).
Google Scholar
-
Majee, D. N., Schwab, E. C., Bertics, S. J., Seymour, W. M. & Shaver, R. D. Lactation performance by dairy cows fed supplemental biotin and a B-vitamin blend. J. Dairy Sci. 86, 2106–2112 (2003).
Google Scholar
-
Takemoto, S., Funaba, M. & Matsui, T. Effect of niacin supplementation in long-distance transported steer calves. Anim. Sci. J. 89, 1442–1450 (2018).
Google Scholar
-
Wang, C. et al. Effects of rumen-protected folic acid on ruminal fermentation, microbial enzyme activity, cellulolytic bacteria and urinary excretion of purine derivatives in growing beef steers. Anim. Feed Sci. Technol. 221, 185–194 (2016).
Google Scholar
-
Wang, C. et al. Effects of biotin and coated cobalamin on lactation performance, nutrient digestion and rumen fermentation in Holstein dairy cows. J. Anim. Physiol. Anim. Nutr. 108, 635–645 (2024).
Google Scholar
-
Bailey, L. B. & Gregory, J. F. III. Folate metabolism and requirements. J. Nutr. 129, 779–782 (1999).
Google Scholar
-
Choi, S. W. & Mason, J. B. Folate and carcinogenesis: An integrated scheme. J. Nutr. 130, 129–132 (2000).
Google Scholar
-
Schwab, E. C. et al. Dietary forage and nonfiber carbohydrate contents influence B-vitamin intake, duodenal flow, and apparent ruminal synthesis in lactating dairy cows. J. Dairy Sci. 89, 174–187 (2006).
Google Scholar
-
Zinn, R. A., Owens, F. N., Stuart, R. L., Dunbar, J. R. & Norman, B. B. B-vitamin supplementation of diets for feedlot calves. J. Anim. Sci. 65, 267–277 (1987).
Google Scholar
-
Wang, C. et al. Effects of different dietary protein levels and rumen-protected folic acid on ruminal fermentation, degradability, bacterial populations and urinary excretion of purine derivatives in beef steers. J. Agric. Sci. 155, 1477–1486 (2017).
Google Scholar
-
Girard, C. L. & Duplessis, M. The importance of B vitamins in enhanced precision nutrition of dairy cows: The case of folates and vitamin B12. Can. J. Anim. Sci. 102, 201–210 (2022).
Google Scholar
-
Girard, C. L. & Matte, J. J. Effects of intramuscular injections of vitamin B12 on lactation performance of dairy cows fed dietary supplements of folic acid and rumen-protected methionine. J. Dairy Sci. 88, 671–676 (2005).
Google Scholar
-
Word, A. B. et al. Evaluation of feeding ruminal-protected folate and cobalt pectinate on growth performance, carcass characteristics and plasma vitamin B12 and folate status in finishing beef steers. Transl. Anim. Sci. 6, 116 (2022).
Google Scholar
-
Deters, E. L. et al. Investigating the effects of a novel rumen-protected folic acid supplement on feedlot performance and carcass characteristics of beef steers. Transl. Anim. Sci. 5, 093 (2021).
Google Scholar
-
Wang, C. et al. Effects of folic acid and riboflavin on growth performance, nutrient digestion and rumen fermentation in Angus bulls. Br. J. Nutr. 129, 1–9 (2023).
Google Scholar
-
Ribeiro, T. L. M. et al. Evaluation of a ruminally protected blend of pantothenic acid, pyridoxine, folic acid, biotin, and vitamin B12 on finishing steer growth performance, efficiency of dietary net energy utilization, carcass trait responses, and liver abscess prevalence and severity. Transl. Anim. Sci. 7, 084 (2023).
Google Scholar
-
Suda, Y. et al. Change of plasma insulin-like growth factor-1 (IGF-1) concentration with early growth in Japanese beef cattle. Anim. Sci. J. 74, 205–210 (2003).
Google Scholar
-
Reyna, X. F. D. R. et al. Polymorphisms in the IGF1 gene and their effect on growth traits in Mexican beef cattle. Genet. Mol. Res. 9, 875–883 (2010).
Google Scholar
-
Pagano, G. T., Lazzaroni, C., Pagano, P. G., Galeazzi, D. & Biagini, D. A study on muscular hypertrophy in cattle: Serum concentrations of IGF-1, cortisol, insulin and testosterone. Livest. Prod. Sci. 70, 235–239 (2001).
Google Scholar
-
Pereira, A. P., Alencar, M. M. D., Oliveira, H. N. D. & Regitano, L. C. A. Association of GH and IGF-1 polymorphisms with growth traits in a synthetic beef cattle breed. Genet. Mol. Biol. 28, 230–236 (2005).
Google Scholar
-
Davenport, G. M., Boling, J. A. & Schillo, K. K. Growth and endocrine responses of lambs fed rumen-protected ornithine and arginine. Small Rumin. Res. 17, 229–236 (1995).
Google Scholar
-
NARO. Guideline for the Institute of Livestock and Grassland Science. (Japan Livestock Industry Association, 2011).
-
Van Soest, P. J., Robertson, J. B. & Lewis, B. A. Methods for dietary fiber, neutral detergent fiber, and nonstarch polysaccharides in relation to animal nutrition. J. Dairy Sci. 74, 3583–3597 (1991).
Google Scholar
-
National Academies of Sciences. Engineering, and Medicine—NASEM Nutrient Requirements of Beef Cattle 8th edn. (The National Academies Press, 2016).
-
Japan Meat Grading Association. Beef Carcass Grading Standard. (Japan Meat Grading Association, 1988).
-
Yamamoto, K. et al. Metabolomic investigation of differences in components and taste between hon-mirin and mirin-like-seasoning. J. Biosci. Bioeng. 132, 599–605 (2021).
Google Scholar
-
Do, H. et al. Gas chromatography–mass spectrometry-based quantitative method using tert-butyldimethylsilyl derivatization for plasma levels of free amino acids and related metabolites in Japanese Black cattle. Anim. Sci. J. 95, e13896 (2024).
Google Scholar
Acknowledgements
We would like to thank Prof. Emeritus Tohru Matsui and Prof. Masayuki Funaba of the Kyoto University for their constructive suggestions. We also would like to thank Dr. Shoya Arakawa, Dr. Tomonori Asai, and Dr. Ryoichi Sasano in AiSTI SCIENCE for their technical support. This study was supported by JSPS KAKENHI (grant number: 21K05891). We would like to thank Editage (www.editage.jp) for English language editing.
Author information
Authors and Affiliations
Contributions
H.D. contributed to sample analysis, data analysis, and writing. S.T. (ZEN-NOH) contributed to experimental design, sample collection, data analyses and writing. S.T. (Kyoto University) contributed to experimental design, data interpretation, writing, and revision. All authors read and approved the final manuscript.
Corresponding authors
Ethics declarations
Competing interests
The authors declare no competing interests.
Additional information
Publisher’s note
Springer Nature remains neutral with regard to jurisdictional claims in published maps and institutional affiliations.
Supplementary Information
Supplementary Information.
Rights and permissions
Open Access This article is licensed under a Creative Commons Attribution-NonCommercial-NoDerivatives 4.0 International License, which permits any non-commercial use, sharing, distribution and reproduction in any medium or format, as long as you give appropriate credit to the original author(s) and the source, provide a link to the Creative Commons licence, and indicate if you modified the licensed material. You do not have permission under this licence to share adapted material derived from this article or parts of it. The images or other third party material in this article are included in the article’s Creative Commons licence, unless indicated otherwise in a credit line to the material. If material is not included in the article’s Creative Commons licence and your intended use is not permitted by statutory regulation or exceeds the permitted use, you will need to obtain permission directly from the copyright holder. To view a copy of this licence, visit http://creativecommons.org/licenses/by-nc-nd/4.0/.
Reprints and permissions
About this article
Cite this article
Do, H., Takemoto, S. & Tomonaga, S. Folic acid supplementation during fattening period affects growth and nutritional metabolism in Japanese Black beef cattle.
Sci Rep 14, 24653 (2024). https://doi.org/10.1038/s41598-024-75592-x
-
Received: 13 July 2024
-
Accepted: 07 October 2024
-
Published: 21 October 2024
-
DOI: https://doi.org/10.1038/s41598-024-75592-x
Keywords
- Folic acid
- Vitamin B12
- Homocysteine
- Methylmalonic acid
- Growth
- Japanese Black cattle