Reliability analysis
An overall Cronbach’s alpha coefficient of 0.909 was obtained from the reliability analysis. In the questionnaire, internal consistency was determined for obtaining, understanding, and evaluation and application of dietary nutrition information on the questionnaire with Cronbach’s alpha values of 0.887, 0.899, and 0.837, respectively. These values were all above 0.8, suggesting that the instrument had good reliability at these three levels [34]. The item-total correlations coefficients among the three levels on the questionnaire were all higher than 0.75 (Table 1).
Validity analysis
Construct validity
Exploratory factor analysis showed that the KMO, χ2, and P values were 0.9, 6233.912, and < 0.001, with a cumulative variance contribution rate of 71.878%. The factor loadings of each item were consistent with the theoretical assumptions after the oblique rotation. Factors 1, 2, and 3 correspond to understanding information, obtaining information, and the evaluation and application information. Further, the factor loading of each item ranged from 0.667 to 0.880 (Supplementary file 3). Confirmatory factor analysis revealed that the values of χ2 / df, GFI, NFI, CFI, and RMSEA were 6.16, 0.9, 0.939, 0.948, and 0.082, respectively. All these indicators met the statistical requirements.
Convergent validity
The convergent validity test of the NLAQ among college students showed that the λ values were greater than 0.7 except for Q1_4 (0.694) and the θ values were lower than 0.5 except for Q1_4 (0.518). The AVE and CR of each indicator were greater than 0.6 and lower than 0.8, indicating that the questionnaire had good convergence validity. All potential variables at different levels passed the convergence validity test. The λ, θ, AVE, and CR values are shown in Table 2.
Subjects characteristics
Table 3 presents the different characteristics of the included students. Regarding the personal characteristics, of the 774 participants, 57.5% were male, 89% were of Han nationality, and their mean age was mostly concentrated between 18–23 years old. For their academic characteristics, the participants consisted of 518 college students with online learning time > 3 h, accounting for 66.93% of the sample. Most students were sophomores (51.7%) and science and engineering students (49.6%). In terms of family environment characteristics, students with residences in county-level cities and average annual household income of 50,000–100,000 CNY accounted for 28.04% and 37.08% of participants, respectively. The parents’ education levels and occupational types of the respondents were similar, and most of them were had education of junior high school and below and were engaged in individual businesses or employed as general staff. The detailed data of other features are shown in Table 3.
Nutrition literacy level and classification
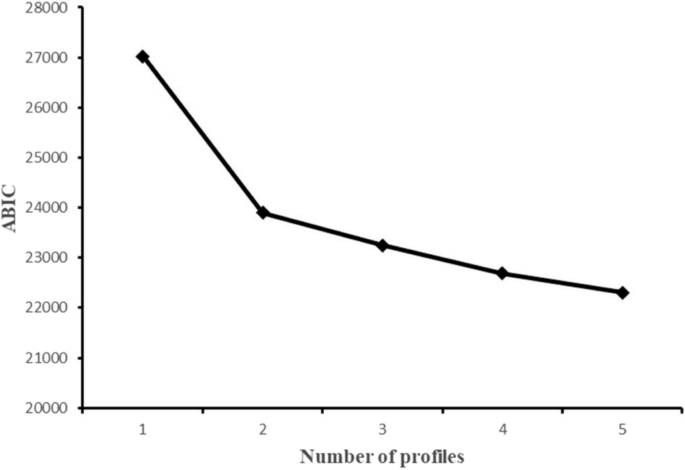
Table 2 indicates that the scores of the total dimension and the sub-dimension did not exceed 3.5 points. This study used LPA to optimally classify the level of nutrition literacy. The LPA results showed that the models converged in up to five profiles. The fit indices for the one- to five-profile solutions (Table 4) were subsequently compared. First, we observed that the value of entropy in each model was above 0.90, except for the four-profile solution (0.881); thus, all models could provide high classification accuracy. Second, the BLRT and LMRT results were significant for every model comparison, and these two indicators were non-informative for the current model selection. Third, as the number of profiles increased, the AIC, BIC and ABIC values continued to decrease across the five profiles. Fourth, the proportion of Model 5 after classification was 4%, which failed to meet the minimum requirement of 5%. Fifth, we found an “elbow” point at the two-profile solution from the scree plot, which indicated a considerably improved fit when the number of latent profiles increased from 1 to 2 (Fig. 2). The proportions of students in Model 2 were 35.8% and 64.2%. Moreover, the scores of each item in Group 1 were lower than those in Group 2, with statistically significant differences (Fig. 3). Therefore, Group 1 was regarded as the “weak nutrition literacy” group and Group 2 as the “strong nutrition literacy” counterpart.

Scree plot of ABIC from LPA analysis based on nutrition literacy assessment questionnaire

Three profiles of the best-fitting three-class pattern based on nutrition literacy assessment questionnaire 13 items
Analysis of differences in variables according to different characteristics
Univariate analysis revealed that general personal characteristics (specifically, gender, nationality, and age) had no effect on the dietary health literacy of college students, but academic characteristics (specifically, discipline) and family characteristics such as family address, family income, parents’ education level and occupation type had different nutrition literacy levels (Table 3).
All the significant predictors of nutrition literacy in the univariate analysis were incorporated into the binary logistic regression model, and the results are presented in Table 5. Multivariate analysis revealed that disciplines, mothers’ education level, and fathers’ occupation type showed significant results in the final model. Medical students (vs humanities and social science students, OR [95%CI] = 1.475[0.946–2.301]), mothers with higher education level, and the father’s occupation type for workers or business service personnel (vs unemployed, semi-unemployed or agricultural workers, OR [95%CI] = 1.714[1.072–2.740]) were more likely to belong to the strong nutrition literacy group.
