Abstract
Distinct metabolic susceptibilities (beta-cell dysfunction, insulin resistance (IR), and impaired incretin response) underlie type 2 diabetes (T2D). However, their relationships with habitual lifestyle behaviors are underexplored. This study integrated high-resolution lifestyle data from wearable devices, continuous glucose monitoring, and smartphone-based food logs with gold-standard physiological tests in 36 individuals at risk for T2D (ClinicalTrials.Gov; NCT03919877; 2019-04-18). Over 6400 timestamped records of diet, sleep, and physical activity were analyzed with in participants with measures of beta-cell function, tissue-specific IR (muscle, hepatic, adipose), and incretin response. We found that lifestyle timing and variability were strongly associated with metabolic subphenotypes: (1) eating timing was associated with muscle IR and incretin function; (2) irregular sleep correlated to IR and incretin function; and (3) Time-of-day effects of physical activity varied by subphenotype. These findings were validated in an independent cohort. Our results highlight novel physiological links between daily behaviors and metabolic risk, informing potential lifestyle modifications for T2D prevention.
Introduction
Type 2 diabetes (T2D) continues to rise globally, affecting 589 million adults worldwide and 38 million people in the U.S. alone1. Moreover, 88 million U.S. adults have prediabetes, with up to 70% expected to develop T2D within four years2. Preventing this transition in at-risk individuals remains a critical public health priority. Many studies have shown that lifestyle modification is a powerful and cost-effective means to prevent and manage T2D3. However, to maximize the effectiveness of such interventions, a deeper understanding of how daily lifestyle behaviors interact with physiological mechanisms that precede hyperglycemia is needed.
Diet, sleep, and physical activity are core modifiable lifestyle behaviors essential to metabolic health. Despite extensive research on their effects on glucose levels, our current understanding of their influence on metabolic disease development remains incomplete. One major gap lies in the limited investigation into how these behaviors relate to diverse physiological underpinnings of T2D, such as beta-cell dysfunction, insulin resistance (IR), and impaired incretin response. These traits often precede clinical glycemic dysregulation4,5, yet their relationships with habitual lifestyle patterns remain largely unknown. Another challenge is the difficulty of capturing these behaviors with sufficient temporal resolution in real-world settings. Traditional questionnaire-based assessments of lifestyle behaviors often lack the granularity to detect subtle but meaningful patterns. In contrast, advances in digital health technologies such as wearable sensors and smartphone applications now enable 24-hour, real-time tracking of lifestyle behaviors6,7.
A growing body of epidemiological and physiological evidence points to close interactions between lifestyle behaviors and the circadian clock system. The circadian clock is a timekeeping system that regulates thousands of genomic activities and metabolic processes at different times of the day8,9,10. Light, food, and exercise can serve as external signals to synchronize the internal clock11, which itself regulates glucose control and sleep. Moreover, sleep deprivation has been shown to adversely impact glucose levels12,13. Therefore, circadian desynchronization induced by inappropriate timing of lifestyle behaviors could disrupt physiological responses and may increase risks for T2D. Nonetheless, most prior studies have explored the effect of only one or two lifestyle domains at a time, leaving the simultaneous and integrative effects on metabolic physiology largely unexplored.
In this study, we leveraged high-resolution digital monitoring and gold-standard physiological tests to investigate how habitual lifestyle behaviors are related to metabolic physiology in individuals at risk for T2D. Specifically, we hypothesized that lifestyle factors would be associated not only with glycemic outcomes but also with distinct metabolic subphenotypes such as IR, beta-cell function, and incretin function. Our goals were (1) to deeply profile temporal patterns of diet, sleep, and physical activity in free-living individuals; (2) to examine the inter-relationships among these lifestyle domains; (3) to quantify their associations with glucose levels using both laboratory tests and continuous glucose monitoring; and (4) to identify lifestyle features predictive of core metabolic subphenotypes, including tissue-specific IR, beta-cell dysfunction, and impaired incretin response. By integrating behavioral data with physiological phenotyping, this work aims to inform precision prevention strategies for T2D.
Results
Cohort characteristics and data collection
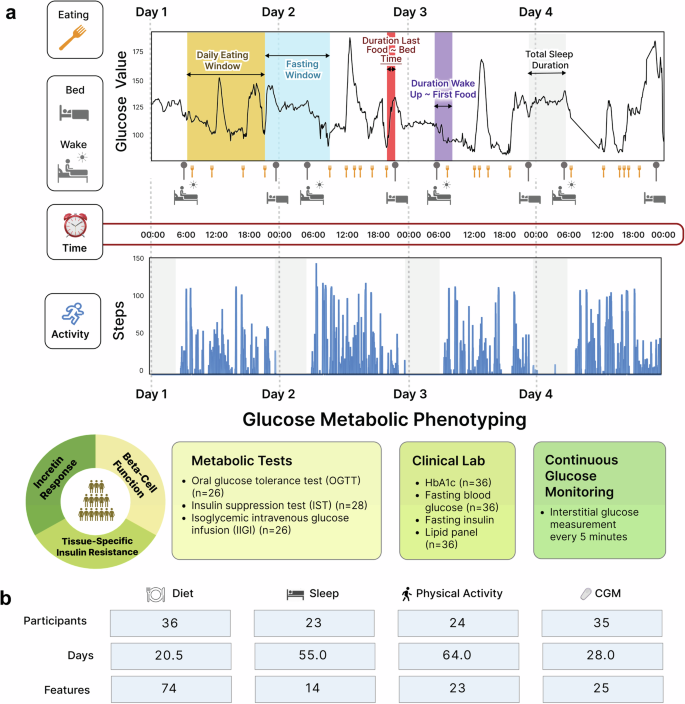
This study included two cohorts: (1) a main cohort (n = 36) for model training, fine-tuning, and testing, and (2) an independent validation cohort (n = 10). The main cohort comprised 36 healthy adults (>18 y of age; median 56.2 y; 17 males and 19 females) whose habitual lifestyle data were collected (2298 meals, 1661 days of sleep, 2447 days of physical activity, and 231,206 CGM readings). Figure 1 summarizes the study overview and the data structure and availability across different data modalities. Baseline characteristics and clinical labs are shown in Table 1. The participants were grouped by HbA1c into prediabetes/T2D (n = 20; 19 prediabetes and one with T2D) or normoglycemia (n = 16), based on American Diabetes Association criteria (normoglycemia (HbA1c < 5.7%; HbA1c < 39 mmol/mol), prediabetes (5.7% <HbA1c < 6.5%; 39 mmol/mol <HbA1c 6.5%; HbA1c > 48 mmol/mol). Demographic variables, including age, sex, BMI, ethnicity, statin use, smoking, season at study entry, self-reported exercise in minutes, and systolic/diastolic blood pressure, were not statistically different between prediabetes/T2D and normoglycemia. However, fasting plasma glucose (P = 0.002), fasting insulin (P = 0.009), and triglyceride (P = 0.014) were higher in the prediabetes/T2D group (Table 1). A separate validation cohort of 10 participants was also analyzed, and their characteristics are summarized (mean age of 52 years, BMI 24, 90% Caucasian and 10% Asian ethnicity, and HbA1c of 5.5%) in Supplementary Table 1, and their baseline demographics and clinical labs did not significantly differ from the main cohort.

a Study design. Two cohorts were included in this study: (1) a main cohort (n = 36) for model training, fine-tuning, and testing, and (2) an independent validation cohort (n = 10). We collected 24 hours of real-time data on the lifestyle behaviors and glucose levels of all study participants for at least 14 days using wearable devices, smartphone applications, and continuous glucose monitors. In addition, participants underwent gold-standard deep glucose metabolic tests (i.e., OGTT, IST, and IIGI tests) to determine their physiologic phenotypes contributing to T2D, such as beta-cell dysfunction, incretin dysfunction, and tissue-specific insulin resistance. b Lifestyle data structure and availability across different data modalities in the main cohort. The “Features” indicate the number of variables derived and extracted from each lifestyle data type. Details are found in Supplementary Table 2.
Individualized differences in metabolic subphenotypes
Participants underwent gold standard metabolic tests after 10-h overnight fasting, including an oral glucose test (OGTT), insulin suppression test (IST), and isoglycemic intravenous glucose infusion test (IIGI)14,15. The metabolic test results determined participants’ metabolic subphenotypes, such as IR, beta-cell dysfunction, and incretin dysfunction. Details are presented in the Methods section and Metwally et al.5.
Participants with prediabetes and T2D showed significantly higher 24 h mean sensor-glucose, higher 24 h max sensor-glucose value (from CGM), more time spent in hyperglycemic range (>140 mg/dL), and higher sensor-glucose variation than the normoglycemic group (P < 0.05; Supplementary Fig. 2). Additionally, participants were categorized: (1) muscle insulin sensitive (IS) when steady-state plasma glucose (SSPG) /= 120 mg/dL (193 ± 51.1 mg/dL). Our determination of IR aligns with the 50% of the SSPG distribution among 490 healthy volunteers that include moderate elevations of SSPG16; (2) normal beta-cell function when the disposition index (DI) >/= 1.58 (2.47 ± 0.512) and dysfunction when DI /= 53.4% (65.1 ± 8.59) and dysfunction when IE < 53.4% (33.4 ± 12.4); (4) adipose IS when an average of free fatty acid (FFA) levels at 90, 100, and 110 min from IST /= 0.22 (0.524 ± 0.204); and (5) hepatic IS when hepatic insulin resistance (HIR)-index /=4.35 (4.65 ± 0.197).
Habitual meal timing patterns are associated with hyperglycemia, muscle IR, and incretin response
To our knowledge, the relationship between meal timing and different metabolic subphenotypes has not been explored previously. Briefly, the meal timing profiles for each of the 36 participants were determined by segmenting the food and beverage consumption (hereafter referred to as “meal”) periods into six windows: 1) 05:00 and 08:00; 2) 08:00 and 11:00; 3) 11:00 and 14:00; 4) 14:00 and 17:00; 5) 17:00 and 21:00; and 6) 21:00 and the next day 05:00. These intervals reflect the major periods of food consumption. Subsequently, the energy intake contribution from each meal timing period relative to the total daily energy intake was determined.
Participants had highly variable inter-individual meal timing patterns enabling an investigation between meal timing and glucose dysregulation (Fig. 2a). We used a principal component analysis (PCA) based on six meal timing features to identify hidden dietary patterns of the food consumption timing and their relationship to physiological processes. Notably, the cohort clearly separated into two clusters by their HbA1c levels based on the meal timing features (Fig. 2b). Specifically, individuals with lower HbA1c levels are positioned at the top left of the PCA plot, whereas those with higher HbA1c levels are located at the bottom right indicating distinct behavior patterns in their timing of food consumption. Multiple linear regression (MLR) analysis identified daily time intervals where the separation arises, further substantiating this conclusion. Relative to participants with lower HbA1c, participants with higher HbA1c had lower energy consumption from the meal consumed between 14:00 and 17:00 (PBH = 0.021), as well as higher energy consumption from the meals 17:00–21:00 (PBH = 0.033) and 5:00–8:00 (PBH = 0.031) (Fig. 1c). Similarly, the cohort also clustered by incretin function based on meal timing (Fig. 2d). Regression showed that those with reduced incretin function consumed less energy at 14:00–17:00 (PBH = 0.026) and 21:00–5:00 (PBH = 0.031) and more at 11:00–14:00 (PBH = 0.044) and 17:00–21:00 (PBH = 0.018) (Fig. 2e). Muscle insulin sensitivity showed similar patterns in PCA and regression (Fig. 2f, g; PBH = 0.037 for 17:00–21:00). No clustering was observed for beta-cell function (disposition index), indicating no association.
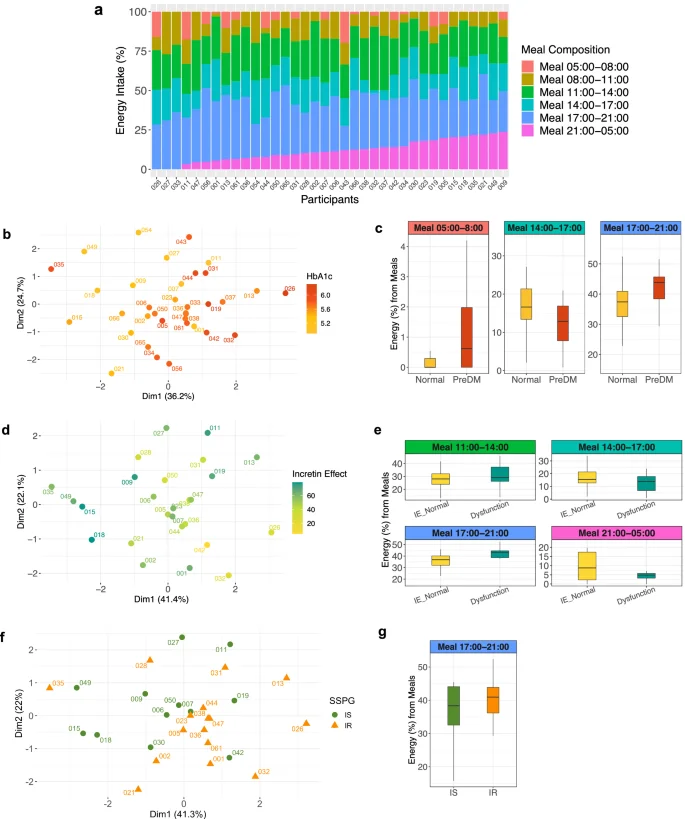
a Heterogeneity in meal timing profiles between persons (n = 36). The food and beverage consumption (referred to as “meal”) periods were segmented into six windows. 1) 05:00 and 08:00; 2) 08:00 and 11:00; 3) 11:00 and 14:00; 4) 14:00 and 17:00; 5) 17:00 and 21:00; and 6) 21:00 and the next day 05:00. The energy intake contribution from each meal timing window relative to the total daily energy intake was determined. A bar indicates each participant. Different colors comprising the bar represent six meal timings. The length of the color corresponds to the contribution (%) of each meal to the total daily energy intake (100%). b PCA plot showing the cohort separation by the six meal timing features. A circle-shaped point indicates each participant. The color gradation represents one’s HbA1c level, ranging from low (yellow) to high (red). c Box plots showing statistically significant differences (BH-adjusted P value < 0.05) in energy contribution from six meal timings by glycemic status (normoglycemia when HbA1c < 5.7% (HbA1c < 39 mmol/mol) and prediabetes when 5.7% ≤HbA1c < 6.5% (39 mmol/mol ≤HbA1c < 48 mmol/mol)). Statistical significance was derived from the covariate-adjusted multiple linear regression models including HbA1c, age, sex, BMI, and ethnicity. The central line inside the box represents the median, and the error bars indicate 1.5 times the IQR from the lower and upper quartiles. PreDM, prediabetes. d PCA plot showing the cohort separation by the six meal timing features. A circle-shaped point indicates each participant. The color represents one’s incretin effects, ranging from low (yellow to light green) to high (dark green). e Box plots showing statistically significant differences (BH-adjusted P value < 0.05) in energy contribution from six meal timings by incretin effects. Statistical significance was derived from the covariate-adjusted multiple linear regression models including incretin effects %, age, sex, BMI, and ethnicity. The central line inside the box represents the median, and the error bars indicate 1.5 times the IQR from the lower and upper quartiles. IE, incretin effect. f PCA plot showing the cohort separation into two clusters by the six meal timing features. A point indicates each participant, and the different shapes and colors of the points represent muscle insulin sensitivity status (green circle for IS and orange triangle for IR). g Box plots showing statistically significant differences (BH-adjusted P value < 0.05) in energy contribution from six meal timings by muscle insulin sensitivity. Statistical significance was derived from the covariate-adjusted multiple linear regression models including insulin sensitivity (SSPG), age, sex, BMI, and ethnicity. The central line inside the box represents the median, and the error bars indicate 1.5 times the IQR from the lower and upper quartiles. IS insulin sensitive, IR insulin resistant.
The distribution of timing-related diet data is shown in Fig. 3a, where violin plots represent both summary statistics and data density. Sleep-related diet parameters were derived through time-matching, meaning that the diet and sleep data were collected concurrently. Then, we comprehensively assessed associations of diet parameters (i.e., nutrients, food groups, eating timing; Supplementary Table 2) with metabolic and CGM outcomes (Fig. 3). Most relevant diet features were selected through the least absolute shrinkage and selection operator (LASSO) (Supplementary Table 3), followed by building MLR models that included potential confounders such as age, sex, ethnicity, and BMI. This combined approach reduces the data dimensionality and improves overall model performance.
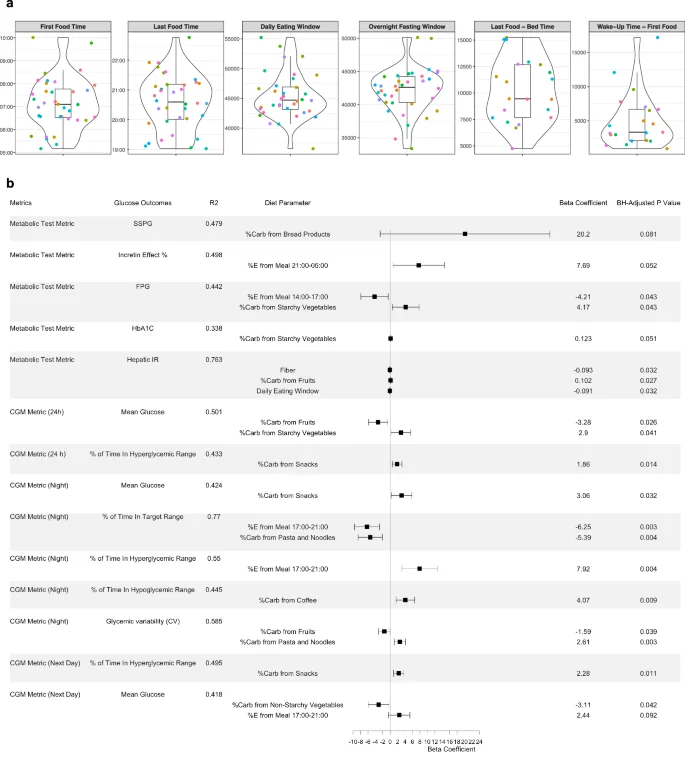
a Violin plots showing timing-related diet features in the cohort. The violin plots illustrate kernel probability density of the data at different values and the horizontal bar depicts the median of the distribution. The error bars represent the data within 1.5 times the IQR from the lower and upper quartiles. First food time (am), time of eating the first food of the day; last food time (pm), time of eating the last food of the day; daily eating span (sec), eating time window between the first food and the last food; last food ~ bed time (sec), time spent from the last food till the bed time; wake-up time ~ first food (sec), time spent from wake-up in the morning till eating the first food. Sleep-related diet parameters were derived through time-matching. b Forest plot showing individual associations of diet parameters with glucose metabolic outcomes using LASSO feature selection combined with multiple linear regression. A horizontal panel in the plot represents each glucose outcome model (i.e., metrics comprising metabolic tests and CGM). Associations that achieved statistical significance (BH-adjusted P 140 mg/dL, and for night time as >100 mg/dL. Time in target range for 24 h was defined as 70–140 mg/dL and for night time as 70–100 mg/dL.
In the forest plot (Fig. 3b), each horizontal panel corresponds to a specific glucose outcome with the point estimate (beta coefficient) and confidence intervals for each diet parameter. This visualization provides a concise summary of multiple regression results and highlights significant associations (Benjamini–Hochberg (BH)-adjusted P 100 mg/dL), and higher mean glucose levels the next day.
Carbohydrate sources also showed distinct associations. Greater carbohydrate intake from non-starchy vegetables was related to lower next-day mean glucose, while carbohydrates from starchy vegetables were associated with higher fasting glucose, HbA1c, and 24-hour mean glucose. Additionally, higher carbohydrate intake from snacks was associated with more time spent in the hyperglycemic range (>140 mg/dL) over 24 hours, increased nighttime mean glucose, and more time in hyperglycemic range the following day.
Variation in sleep timing is associated with hyperglycemia and incretin function
To investigate the relationship of sleep parameters with glucose control and metabolic characteristics, real-time sleep monitoring data were estimated from participants using a Fitbit Ionic band (Fitbit, Inc., San Francisco, CA). We extracted and derived 14 sleep features and observed considerable between-person variability for each sleep parameter (Fig. 4a). Using feature selection via LASSO and 10-fold cross-validation (Supplementary Table 4), as well as the MLR (Fig. 4b), we found that day-to-day variability of sleep features was significantly associated with glucose outcomes. Specifically, higher variability in sleep efficiency was associated with higher nighttime mean glucose values, more time spent in the night-time hyperglycemic range (>100 mg/dL), and higher next-day mean glucose values. Moreover, greater variabilities in WASO (wake-up duration after sleep onset) and bedtime were linked to higher 2-hour OGTT glucose and higher next-day max glucose, respectively. Earlier wake-up time was associated with lower incretin effects.
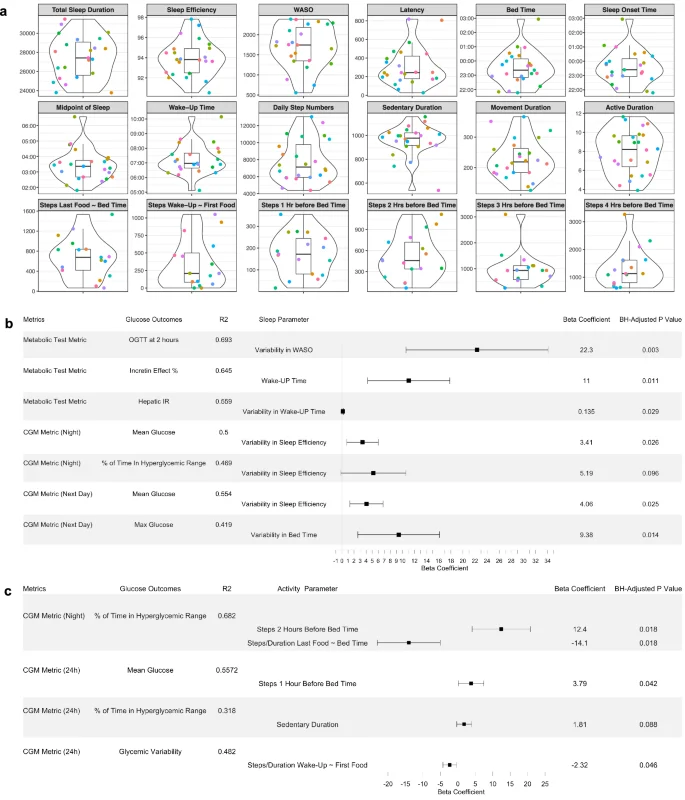
a Violin plots showing sleep and physical activity habits and related timing features in the cohort. The violin plots illustrate kernel probability density of the data at different values and the horizontal bar depicts the median of the distribution. The error bars represent the data within 1.5 times the IQR from the lower and upper quartiles. Total sleep duration is the actual time spent asleep, and latency duration is the time spent to accomplish the transition from full wakefulness to sleep onset. Sleep efficiency is determined by wake-up after sleep onset (WASO) divided by the total sleep duration. The midpoint of sleep is the clock time between sleep onset and wake-up. Sedentary duration is the duration of “0” step count per day (minutes), and movement duration is the duration of non-zero step count per day (minutes). Active duration is the hours per day for which the step count >250. Units for each panel are as follows: sec for total sleep duration, WASO, and latency; % for sleep efficiency; AM for the midpoint of sleep and wake-up time; PM (22:00, 23:00) and AM (00:00, 01:00, 02:00, 03:00) for bed time and sleep onset time. “Steps Last Food ~ Bed Time” and “Steps Wake-Up ~ First Food” features were derived by aligning the times of diet, sleep, and physical activity behaviors of each individual. b Forest plot showing individual associations of sleep parameters with glucose metabolic outcomes using LASSO feature selection combined with multiple linear regression. A horizontal panel in the plot represents each glucose outcome model (i.e., glucose metrics comprising metabolic tests and CGM). Associations that achieved statistical significance (BH-adjusted P 100 mg/dL. WASO, wake-up after sleep onset. c Forest plot showing individual associations of physical activity parameters with glucose metabolic outcomes using LASSO feature selection combined with multiple linear regression. A horizontal panel in the plot represents each glucose outcome model. Associations that achieved statistical significance (BH-adjusted P < 0.1) between activity parameters and glucose outcomes are listed in this figure. The coefficient of each activity feature (a point of estimate depicted as the central marker) was derived from the covariate-adjusted multiple linear regression models (all activity features, age, sex, BMI, and ethnicity). The error bars represent the 95% confidence interval for the point estimate. Time in target range for night time was defined as 70–100 mg/dL.
Physical activity habits profiling and the time-dependent association with glucose values
We obtained real-time step count and heart rate data from the Fitbit Ionic band. Using feature selection via LASSO and 10-fold cross-validation (Supplementary Table 5), as well as the MLR, we observed that more steps near bedtime was associated with poor nighttime CGM outcomes in the overall cohort (Fig. 4c). A longer sedentary duration of the day was associated with more time spent in hyperglycemic range. Interestingly, a higher step density after having last food was associated with less time in the nighttime hyperglycemic range.
Next, we quantified how physical activity is related to glucose levels by splitting the time-series step count and CGM data into 7 circadian windows: 1) 05:00–8:00; 2) 8:00–11:00; 3) 11:00–14:00; 4) 14:00–17:00; 5) 17:00–21:00; 6) 21:00–24:00; and 7) 24:00—the next day 05:00 (Supplementary Table 6). To visualize the interaction between step counts and insulin resistance status (IS and IR) with CGM values at different times of the day, we plotted the results from linear models across time window combinations (Fig. 5a). Significant interactions were found during 00:00–05:00, 08:00–11:00, 11:00–14:00, and 14:00–17:00 (denoted by asterisks in Fig. 5a). We then performed a shifted Pearson correlation with permutation to examine temporal associations between step counts and mean glucose by IR subgroup. A heatmap shows correlation coefficients at the designated combination of time windows (Fig. 5b–d). In the IS group, steps during the afternoon 14:00–17:00 were negatively correlated with CGM values over the following 48 hours (Fig. 5b). In contrast, in the IR group, steps during the morning 08:00–11:00 were linked to lower glucose values the next day (Fig. 5c). In addition, steps between 00:00 and 05:00 were positively correlated with higher glucose levels for up to the next 48 in both IS and IR groups, with stronger correlations in IR.
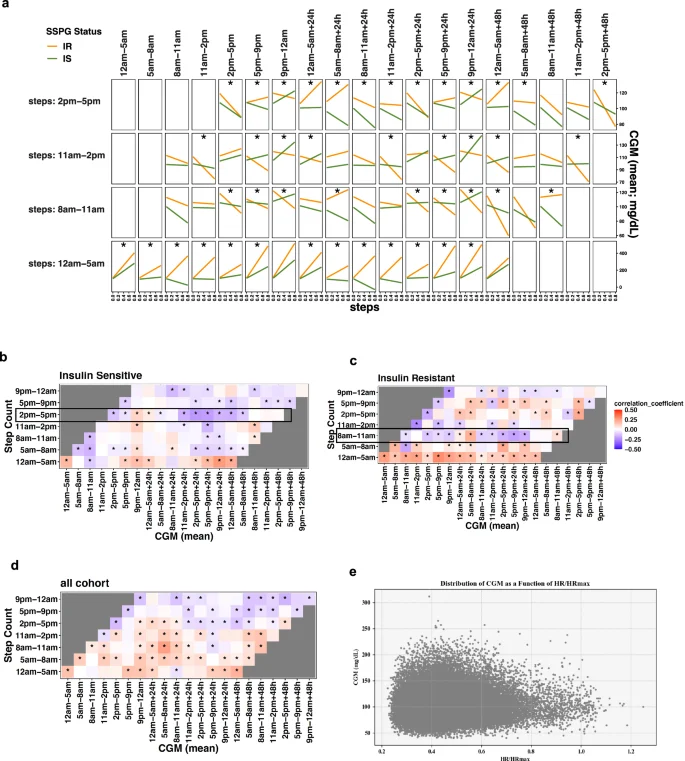
a Interaction effects plot for step counts and SSPG status (IS/IR) on CGM. Effects of step count and SSPG status on mean glucose values were assessed through linear models at each time window, permuted as in the Pearson correlation analysis. We split the time-series of step counts into seven-time windows of the day. The X axis indicates the standardized step counts of a specific time window, and the Y axis represents the corresponding glucose values up to the next 48 hours. The orange line represents IR, and the green line IS, where interaction effects were considered significant (asterisk) if multiple testing-adjusted q value < 0.01. b–d Shifted correlation analysis plot between step count and CGM in different time windows of the day ((b) Insulin-sensitive, (c) Insulin-resistant; (d) overall cohort). The color gradation represents correlation coefficients ranging from −0.5 (negative correlation) to 0.5 (positive correlation). CGM continuous glucose monitoring. e 2D scatter plot that shows the distribution of CGM as a function of HR/HRmax for all participants over a shared period. Each point represents a data entry. The scatterplot shows a noticeable pattern between HR/HRmax and CGM values for all participants.
We also observed CGM peaks within the range of heart rate/heart rate max (HR/HRmax) 0.32 to 0.45, and the subsequent declines in CGM values when HR/HRmax surpassed 0.65 (Fig. 5e, Supplementary Fig. 1). This pattern highlights the importance of elevating HR/HRmax, which could be achieved by increasing activity such as aerobic training.
Permuted correlation network analysis between diet, sleep, and physical activity habits
Our diet-sleep-activity correlation network with permutation highlighted many significant correlations among diet, sleep, and activity features, and the diet factors (nutrients, food groups, eating timing) were central in the complex relationships (Fig. 6a). The network plot provides an intuitive visual representation of relationships among three lifestyle behaviors at a glance. In this analysis, all three lifestyle factors were time-matched. For food groups, higher rice consumption was correlated with lower sleep efficiency and longer latency duration. In contrast, higher legume consumption was correlated with shorter latency and longer total sleep duration. Higher fruit consumption was also correlated with longer sleep duration. For nutrients, higher fiber and potassium intakes were correlated to longer sleep duration. While higher saturated fat intake was correlated to longer sedentary duration, higher vitamin D intake was correlated to longer active duration. Interestingly, higher energy contribution from the meal between 8:00 and 11:00 am and longer fasting window were correlated with longer sleep duration, whereas late eating of the first meal of the day was correlated to lower sleep efficiency. Finally, a longer duration from waking up to first food eating was correlated to a longer latency.
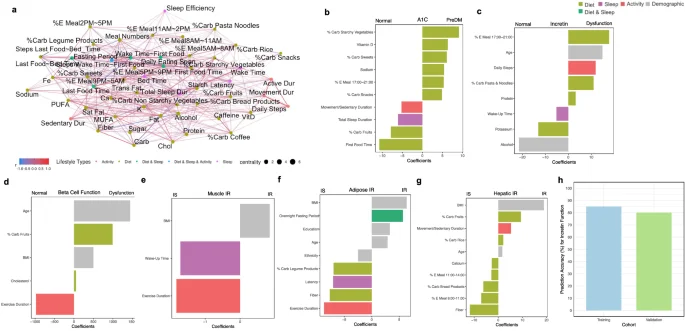
a Diet, sleep and physical activity correlation network analysis. Concurrent correlations between lifestyle features were calculated using Spearman correlation with permutation and considered significant if multiple testing-adjusted q value < 0.2. The color gradation represents correlation coefficients ranging from −1.0 to 1.0. Different colors of points indicate different types of lifestyle features: light green (diet); purple (sleep); red (activity); dark green (combined features from diet and sleep); blue (combined features from diet, sleep, and activity). b–g Integrated lifestyle prediction model of metabolic subphenotypes. The LASSO classification model was built upon all lifestyle features, and model coefficients of selected features were visualized. The classifications are for (b). Normoglycemia vs. PreDM/T2D. c Incretin normal vs. dysfunction; (d) beta-cell normal vs. dysfunction; (e) muscle IS vs. IR; (f) adipose IS vs IR; and g Hepatic IS vs. IR. Different colors indicate different types of lifestyle features. Sex (1 male, 0 female) and ethnicity (1 Caucasian, 0 non-Caucasian) are two levels of numerical values. Latency is the time spent to accomplish the transition from full wakefulness to sleep onset. %E Meal, energy proportion (%) of the meal timing to the total daily energy intake; %Carb, carbohydrate proportion (%) of the food group out of the total daily carbohydrate intake from all food groups; movement/sedentary duration, the ratio of movement duration to sedentary duration; education, the years of education, PreDM prediabetes, IS insulin sensitive, IR insulin resistance. Nutrients (e.g., fiber and sodium) are the daily dietary intakes of the corresponding nutrients. h Comparison of accuracy for predicting incretin function in training main cohort and validation cohort. The Y axis indicates classification accuracy (%).
Integrated lifestyle machine learning prediction models for metabolic subphenotypes
We built comprehensive, integrated machine learning models to predict different metabolic subphenotypes using a full feature set that included all three lifestyle domains and demographic variables. The model coefficients of top 10 selected features were visualized in all models (Fig. 6). First, for predicting prediabetes versus normoglycemia, a high proportion of carbohydrate intake from starchy vegetables and sweets (relative to the total daily carbohydrate intake) as well as greater energy intake during 5:00–9:00 pm, were associated with HbA1c levels and prediabetes. In contrast, higher carbohydrate intake from fruits was linked to normoglycemia. Additional predictors of normoglycemia included longer total sleep duration and a later time of first food intake. Incretin dysfunction was predicted by several variables including older age, higher energy intake between 5:00–9:00 pm, greater carbohydrate intake from pasta and noodles, and higher protein intake. Normal beta-cell function was predicted by longer exercise duration, and muscle insulin sensitivity was also associated with longer exercise duration and later wake-up time. For adipose insulin sensitivity, predictors included longer exercise duration, higher fiber intake, greater carbohydrate intake from legumes, and longer sleep latency. Finally, hepatic insulin sensitivity was associated with higher fiber intake and greater energy consumption during the morning and midday periods (8:00–11:00 am and 11:00 am–2:00 pm). Performance of each model are found in Supplementary Table 7.
Validation of the metabolic subphenotypes prediction models in an independent cohort
To evaluate the reproducibility of our prediction models for metabolic subphenotypes, we conducted an independent validation study in a cohort of 10 individuals matched for age, sex, BMI, ethnicity, HbA1c, fasting blood glucose, and other characteristics (Supplementary Table 1). All participants underwent the same gold-standard metabolic tests including OGTT, IST, and IIGI in the CTRU, along with continuous lifestyle monitoring via wearable devices (Fig. 6). We focused on incretin function for validation because the other metabolic subphenotypes (beta-cell function and muscle IR) exhibited highly skewed and shifted distributions. In the independent cohort, incretin status was evenly split (normal, n = 5; dysfunction, n = 5), providing a robust test set. Application of the final model trained on the main cohort to this independent cohort yielded 80% accuracy and a misclassification error of 0.20, compared to a baseline error of 0.5. In the training cohort, the model had similar performance, yielding a misclassification error of 0.15 (85% accuracy), compared to a baseline error of 0.42. These results indicate the model’s consistent and robust predictive performance across cohorts (Fig. 6h).
Discussion
This study provides a novel and comprehensive characterization of how habitual lifestyle behaviors (i.e., diet, sleep, and physical activity) are associated with core physiological processes underlying metabolic susceptibility to T2D, such as beta-cell dysfunction, tissue-specific insulin resistance, and incretin dysfunction. While previous studies have primarily focused on glucose levels, our work moves beyond these conventional markers by linking lifestyle behaviors to distinct metabolic subphenotypes within the same individuals. This approach offers a deeper understanding of metabolic susceptibility to T2D in relation to lifestyle behaviors.
We integrated over 6,400 timestamped lifestyle data points collected using wearable biosensors, continuous glucose monitoring (CGM), and smartphone apps (meal intake n = 2298, sleep behavior n = 1661 days, physical activity n = 2447 days). These data were paired with gold-standard physiological assessments, including the OGTT, insulin suppression test, and isoglycemic intravenous glucose infusion test, to characterize beta-cell function, incretin response, and insulin resistance in muscle, adipose tissue, and liver5. To capture both domain-specific effects and cross-domain interconnectedness, we employed an individual-to-systemic analytical framework. We first examined each lifestyle domain independently in relation to metabolic subphenotypes and CGM outcomes. Then, we systematically integrated the most relevant features across domains in network analysis and predictive modeling. We also validated several findings in a separate independent cohort, confirming that our findings are reproducible.
We discovered novel associations between lifestyle timing and metabolic physiology. Notably, habitual meal timing was linked to hyperglycemia, insulin resistance (IR), and reduced incretin function in PCA analyses. Regression analyses further confirmed that participants with lower HbA1c and higher incretin effect consumed more calories between 14:00 and 17:00, whereas those with higher HbA1c, lower incretin effect, and greater muscle IR consumed more calories between 17:00–21:00. However, nutrient intake and food group features did not show these associations (Supplementary Figs. 3–6). In our integrated prediction model, incorporating all three lifestyle domains and demographics, evening caloric intake remained the strongest variable for impaired incretin function. These associations were not due to total caloric intake, which was similar between the two groups, implicating circadian misalignment rather than caloric excess. These findings are consistent with previous work showing associations of night-time meals with poor glycemic control such as glucose intolerance in both healthy and individuals with diabetes17,18. Mechanistically, this may reflect desynchrony between central and peripheral circadian clocks following high-calorie evening meals, as found in animal studies19,20. Our results extend these observations by directly linking meal timing to core physiological traits relevant to diabetes development, such as incretin function and insulin sensitivity.
In addition, the significant association of higher caloric intake from 14:00 to 17:00 with lower fasting plasma glucose and greater incretin effect suggest potential metabolic benefits of afternoon snacks or early dinners. These associations remained significant regardless of later meal caloric intakes (meals 17:00–21:00 and 21:00–5:00 next day). Prior work also indicates that pre-dinner snacking may enhance beta cell responsiveness21, supporting the plausibility of this timing effect. Taken together, our findings highlight that in the context of T2D risk, not just what we eat but when we eat can influence not only glycemic control but also susceptibility to broader metabolic impairments.
Similarly, we found associations between habitual sleep patterns and metabolic physiology that extend beyond glycemic control (Fig. 4, Supplementary Fig. 7). In addition to total sleep duration, irregular sleep timing and efficiency were linked to higher IR and elevated glucose levels, as captured by CGM. These findings build on prior studies in shift workers22,23, and extend them to non-shift-working, free-living individuals. Additionally, greater night-to-night variability in sleep fragmentation, measured by WASO (wake after sleep onset), was associated with higher OGTT glucose levels. This result emphasizes the significance of maintaining both consistent sleep timing and stable sleep continuity, in line with previous work showing the negative impact of sleep fragmentation on glucose control24,25,26.
Beyond glucose regulation, we found in regression analyses that later wake-up times were associated with improved incretin function, irrespective of total sleep duration. This association remained robust in our integrated prediction models, where later wake-up time emerged as one of the strongest variables, along with other lifestyle factors, positively associated with both incretin normal function and higher muscle insulin sensitivity. Given the cohort’s median wake-up time of 6:58 am, these results suggest that waking after ~7:00 am may confer metabolic benefits via enhanced incretin response. This is biologically plausible, as incretin secretion exhibits diurnal patterns, with slower release at night27. Additionally, a randomized controlled trial28 showed the major effects of nocturnal light exposure on baseline and postprandial glucagon-like peptide-1 (GLP-1) levels, independent of sleep deprivation, suggesting light-mediated circadian disruption. Future studies are needed to clarify the mechanisms linking sleep timing and continuity to these distinct metabolic subphenotypes, including incretin response and insulin sensitivity.
Our time-series analyses revealed significant interactions between step counts and muscle IR status affecting CGM values (Fig. 5a, Supplementary Fig. 8). Specifically, participants with muscle IR (higher SSPG values) showed subsequent lower CGM glucose levels following morning activity (i.e., increasing steps between 8:00–11:00), while those with muscle insulin sensitivity (IS) benefited more from afternoon activity (14:00–17:00). This pattern held, to a lesser extent, for other dysfunctional subgroups (prediabetes and beta-cell dysfunction) who benefited from morning activity, compared to normoglycemic individuals who responded better to afternoon activity (Supplementary Fig. 9).
These findings refine previous studies reporting mixed results when modifying the timing of exercise on glycemic control. While one RCT found morning moderate-intensity exercise beneficial for individuals with diabetes29, others reported stronger effects from afternoon or evening moderate-to-vigorous activity, or no timing effect at all among people with or without T2D30,31,32,33. Such inconsistencies may reflect differences in exercise intensity and types, which we could not extract from step counts alone. Nevertheless, our results suggest that the optimal timing of physical activity may vary by metabolic phenotype. One possible mechanism for the observed morning activity benefit in insulin-resistant individuals involves the circadian peak in catecholamines34, which may promote free fatty acids uptake and improve lipid-induced insulin signaling in skeletal muscle.
Post-meal activity patterns were also important. Higher step density after the last meal (steps/hour) was linked to better nighttime glucose outcomes, whereas increased steps 1-2 hours before bedtime were associated with poorer glycemic control. This suggests that while postprandial movement may be beneficial, late-night activity before bedtime may interfere with metabolic recovery during sleep. In our integrated prediction models, longer exercise duration was strongly associated not only with better glycemic control (A1C) but also with improved beta-cell function and insulin sensitivity in muscle and adipose tissues. Future studies should explore how activity timing, intensity, and type of activity interact with individual metabolic phenotypes to guide personalized exercise strategies for diabetes intervention35,36.
This study has several limitations. First, due to the high cost and labor-intensive nature of these gold-standard tests, the sample size was modest. To address this, we employed rigorous statistical techniques, including permutation testing, cross-validation, and multiple testing correction to enhance validity and minimize overfitting and bias. We also used an individual-to-systemic framework to address complex interactions across lifestyle and metabolic features. Second, the study cohort was recruited in the San Francisco Bay area, which may limit generalizability to other geographic or demographic populations. Third, as the data is observational rather than intervention-based, causal inference is limited. Finally, our study did not genotype participants for common SNPs related to diabetes. Therefore, we cannot exclude the possibility that some associations observed in our study may be influenced by certain genetic variants. However, large studies showed that a healthy lifestyle mitigated genetic risk by over 60%37, and individuals with high genetic risk benefited more from lifestyle intervention38. These findings support the significance of lifestyle interventions, even in genetically predisposed individuals.
In summary, this study provides a unique, physiologically grounded characterization of how habitual lifestyle patterns are related to metabolic susceptibility to T2D. Unlike prior research that has primarily focused on glycemic markers alone, we evaluated multiple physiological processes within the same individuals (e.g., beta-cell function, incretin function, and tissue-specific insulin resistance) using rigorous, gold-standard physiological tests. Our results consistently showed that the timing and variability of behaviors are linked to core metabolic processes. The inclusion of an independent validation cohort supports the reproducibility of these findings. Taken together, these findings highlight the need for future studies aiming to tailor behavioral recommendations to individual metabolic physiology. By identifying how distinct lifestyles intersect with specific diabetes pathophysiology, this work supports the development of precision prevention strategies for T2D.
Methods
Study design, participants, and sample collection
Participants were recruited from the San Francisco Bay Area, California. Inclusion criteria were general health, with no prior diabetes diagnosis, no uncontrolled hypertension or major organ disease, and no use of diabetes medication. Participants underwent evaluations and screening tests at the Clinical and Translational Research Unit after overnight fasting (e.g., HbA1c, fasting plasma glucose, insulin, lipid panel, and creatinine at baseline). The study protocol was reviewed and approved by the Institutional Review Board at Stanford University School of Medicine Human Research Protection Office (Institutional Review Board #43883). All participants provided written informed consent. This trial is registered on ClinicalTrials.Gov (NCT03919877; “Precision Diets for Diabetes Prevention”; 2019-04-18). Participants underwent gold standard metabolic tests (as described in detail in the following sections) after 10-h overnight fasting, including an oral glucose test (OGTT), insulin suppression test (IST), and isoglycemic intravenous glucose infusion test (IIGI). The metabolic test results determined participants’ metabolic subphenotypes, such as IR, beta-cell dysfunction, and incretin dysfunction.
Main cohort
36 healthy adults were included in the final analyses as the main study cohort (also called training cohort) (Table 1).
Validation cohort
An independent cohort of 10 individuals completed metabolic tests and provided lifestyle data. The demographics, labs, and metabolic test results are summarized in Supplementary Table 1.
Lifestyle deep profiling using wearable biosensors and feature extraction
By leveraging the power of real-time digital health monitoring technologies, we monitored participants’ dietary intake, sleep characteristics, physical activity, and glucose levels in real-time throughout the study period (at least 14 consecutive days). Participants were asked not to change their sleep and activity habits during the study. Moreover, participants were required to maintain their normal eating, sleep, and physical activity habits without change during the study.
For dietary data collection, participants were required to log all food and beverage items consumed in real-time on the Cronometer food tracking app (Cronometer Software, Inc., Revelstoke, BC, Canada). A median of 20.5 days of food logs were collected from 36 participants. Over 92% of participants provided more than 10 days of diet data during the study period. To enhance the accuracy of the diet data, days with a reported daily caloric intake of less than 500 kcal as well as those reporting an overnight fasting period exceeding 24 hours were excluded. Registered dietitians monitored participants’ food log entries (food items, calories, and nutrient compositions) throughout the study. It was also ensured that all participants could record dietary intake data for at least two weekdays and one weekend day to capture a more accurate and representative understanding of their typical dietary habits. There was no missing dietary data for all 36 participants. A total of 74 diet features (51 energy-adjusted nutrient levels, 10 food groups, and 13 meal timings) were extracted (Fig. 1 and Supplementary Table 2).
For sleep and physical activity data collection, participants wore a Fitbit Ionic band (Fitbit, Inc., San Francisco, CA) for the study period. The Fitbit data was available for 24 out of 36 participants due to a product recall of Fitbit Ionic for potential burn hazards during the study period. As such, a median of 55 nights of sleep data and 64 days of physical activity data were collected from 24 participants. To ensure data accuracy, only days with 4–12 hours of overnight sleep data were considered, and days with less than 500 steps were excluded. 14 sleep features (1 quantity, 9 qualities, 4 timings) and 23 physical activity features (4 activity levels, 19 timings) were extracted (Fig. 1 and Supplementary Table 2). This study did not use the duration for each sleep stage because we did not have access to open-source Fitbit data to independently validate the algorithm predicting sleep structure in our population. Finally, heart rate (HR) data were also extracted.
For continuous glucose monitoring, participants wore a Dexcom G4 CGM device (Dexcom Inc., San Diego, CA) for the study period. Of note, readings from glucose monitoring devices were not made available to the participants until the study-end, therefore, lifestyle habits were not affected by the recordings. CGM data were collected for a median of 28 days from 35 participants (Fig. 1).
Gold-standard metabolic physiological tests
Participants underwent glucose metabolic tests after 10-h overnight fasting to determine metabolic characteristics, such as tissue-specific IR, beta-cell dysfunction, and incretin dysfunction. The details of the physiologic tests are described in Metwally et al.5, and are summarized as follows.
Muscle IR was quantified through an insulin suppression test (IST). In a validated IST39,40, participants were infused with octreotide (0.27 μg m−2 min−1), insulin (32 mU m−2 min−1), and glucose (267 mg m2 min−1) for 240 min. In this test, participants showed different levels of SSPG, indicating the individual’s ability to insulin-mediated glucose disposal14.
Beta cell function was assessed during an oral glucose tolerance test (OGTT). Specifically, plasma glucose levels were measured at 16 timepoints (−10, 0, 10, 15, 20, 30, 40, 50, 60, 75, 90, 105, 120, 135, 150, and 180 min) following a 75 g oral glucose load, while insulin and C-peptide were measured at 7 timepoints (0, 15, 30, 60, 90, 120, 180 min) using Millipore radioimmunoassay assay at the Core Lab for Clinical Studies, Washington University School of Medicine in St. Louis (WashU). The insulin secretion rate was calculated from C-peptide levels during the OGTT test using the Insulin SECretion (ISEC) software. Then, a disposition index (DI; (pmol*dL)/(kg*ml))15, was calculated as the area under the insulin secretion rate, divided by the SSPG. Based on the DI, the beta cell function was determined.
Incretin function was quantified using an IIGI test. In this test, participants were continuously infused with dextrose via an intravenous catheter. The incretin effect (IE%) can be quantified by comparing plasma glucose and C-peptide profiles responding to the dextrose load either orally (OGTT) or intravenously (IIGI).
The HIR index equation, using insulin, BMI, body fat%, and HDL cholesterol levels, was validated against endogenous glucose production measured during euglycemic–hyperinsulinemic clamp41. Adipose tissue IR was calculated based on the average plasma FFA measured at 90, 100, and 110 min during the modified IST.
Data analyses
All data analyses, corresponding key findings, and interpretations are described in detail in Supplementary Table 8. To test for differences in baseline demographics, labs, and metabolic test results between normoglycemia and prediabetes/T2D groups, as well as between the main and validation cohorts, the Wilcoxon rank-sum test was used for non-normally distributed continuous variables, and the χ2 test or Fisher’s exact test was used for categorical variables.
To identify dietary patterns and their relationship to metabolic characteristics in the cohort, PCA was performed on meal timing features. They were classified/color-coded by HbA1c, IR SSPG, incretin effect, or beta-cell function Disposition Index. Then, we used covariate-adjusted multiple linear regression (MLR) models to examine differences in the energy contribution of each meal timing between metabolic groups while adjusting for age, sex, BMI, and ethnicity. P values were BH-adjusted for multiple testing.
Individual-to-systemic analytical framework: linear regression analysis (individual) and training machine learning prediction models (systemic)
To assess individual associations of diet, sleep, and activity features with glucose outcomes (CGM and metabolic test results), we used the LASSO combined with regression models. For each glucose outcome, we performed a grid search (values ranging from λ = 1010 to λ = 10-2) to optimize the hyperparameter, λ, and selected the model that minimizes test misclassification error (MSE). The LASSO models selected lifestyle features associated with glucose outcomes and provided an estimate of the predictive values of the feature individually (Supplementary Tables 3–5). Then, we used regression analyses to examine individual associations of diet, sleep, and activity with glucose outcomes. P values were BH-adjusted for multiple testing.
We built integrated, comprehensive prediction models based on all three lifestyle modalities and demographic information to predict metabolic characteristics. Since many features are highly dependent on each other, we removed obvious dependencies and kept a total of 47 features to start with (e.g., baseline BMI was kept, and height and weight were removed). Features were then centered and scaled. Since we needed to include all three lifestyle factors simultaneously for building the prediction models, and there were missing values for individuals without Fitbit data, we chose to use the cohort mean to replace these NA values, as MICE-imputed data failed to predict all metabolic classes. Next, the LASSO approach selected relevant features, and then models with no regularization were built39. The hyperparameter lambda was selected, and the model was selected through leave-one-out and MSE. The plot (model coefficients of the top 10 selected features) was visualized in all analyses (Fig. 6 and Supplementary Fig. 6). P values were adjusted for multiple testing.
Time series analysis of activity and CGM
To examine the effects of the time series interaction between step counts and SSPG status on CGM mean values, linear models with permutation were fit at the 7-time windows of 24 hours (05:00–8:00, 8:00–11:00, 11:00–14:00, 14:00–17:00, 17:00–21:00, 21:00–24:00, and 24:00–the next day 05:00). Then, a shifted Pearson correlation analysis with permutation was performed between step counts and CGM mean values by SSPG status subgroups through the 7-time windows.
Correlation network analysis among time-matched lifestyle behaviors
To identify intercorrelations among the three lifestyles, we used Spearman correlation with permutation. All correlation and interaction analyses were adjusted for multiple testing.
Model validation on an independent validation cohort
Lifestyle and metabolic test data from the independent validation cohort were first preprocessed to extract the same lifestyle (diet, sleep, and physical activity) features and metabolic subtypes as used in the main cohort. Beta-cell function (all 10 normal) and muscle IR (9 insulin-sensitive and 1 insulin-resistant) were highly skewed in distribution. Therefore, we focused on the incretin function for validation, which was evenly split (normal, n = 5; dysfunction, n = 5), providing a robust test set. Then, we applied the final trained prediction model derived from the main cohort to this independent dataset. This yielded a MSE, which was compared against a random baseline error by selecting the largest group as the prediction.
Data availability
The datasets generated and/or analyzed during the current study are available from the corresponding author on reasonable request. The de-identified lifestyle data, gold-standard metabolic test results, continuous glucose monitoring data, along with other data types in this study can be downloaded from the study data repository (https://cgmdb.stanford.edu/data/) at the time of publication. The study protocol is shared as Supplementary Information.
Code availability
The underlying code for this study is available and can be accessed via this link (https://github.com/mikeaalv/lifestyle_glucose_control).
References
-
International Diabetes Federation. IDF Diabetes Atlas 11th Edition (2025).
-
Tabák, A. G., Herder, C., Rathmann, W., Brunner, E. J. & Kivimäki, M. Prediabetes: a high-risk state for diabetes development. Lancet 379, 2279–2290 (2012).
Google Scholar
-
Diabetes Prevention Program Research Group. Reduction of the incidence of type 2 diabetes with lifestyle intervention or metformin. N. Engl. J. Med. 34, 162–163 (2002).
-
Legaard, G. E. et al. Effects of different doses of exercise and diet-induced weight loss on beta-cell function in type 2 diabetes (DOSE-EX): a randomized clinical trial. Nat. Metab. 5, 880–895 (2023).
Google Scholar
-
Metwally, A. A. et al. Prediction of metabolic subphenotypes of type 2 diabetes via continuous glucose monitoring and machine learning. Nat. Biomed. Eng. 1–18 (2024).
-
Schüssler-Fiorenza Rose, S. M. et al. A longitudinal big data approach for precision health. Nat. Med. 25, 792–804 (2019).
Google Scholar
-
Li, X. et al. Digital health: tracking physiomes and activity using wearable biosensors reveals useful health-related information. PLoS Biol. 15, e2001402 (2017).
Google Scholar
-
Eckel-Mahan, K. & Sassone-Corsi, P. Metabolism and the circadian clock converge. Physiol. Rev. 93, 107–135 (2013).
Google Scholar
-
Gerhart-Hines, Z. & Lazar, M. A. Circadian metabolism in the light of evolution. Endocr. Rev. 36, 289–304 (2015).
Google Scholar
-
Dollet, L. & Zierath, J. R. Interplay between diet, exercise and the molecular circadian clock in orchestrating metabolic adaptations of adipose tissue. J. Physiol. 597, 1439–1450 (2019).
Google Scholar
-
Manoogian, E. N. C., Chow, L. S., Taub, P. R., Laferrère, B. & Panda, S. Time-restricted eating for the prevention and management of metabolic diseases. Endocr. Rev. 43, 405–436 (2022).
Google Scholar
-
Światkiewicz, I., Woźniak, A. & Taub, P. R. Time-restricted eating and metabolic syndrome: current status and future perspectives. Nutrients 13, 1–24 (2021).
-
Sondrup, N. et al. Effects of sleep manipulation on markers of insulin sensitivity: A systematic review and meta-analysis of randomized controlled trials. Sleep Med. Rev. 62, 101594 (2022).
-
Pei, D., Jones, C. N. O., Bhargava, R., Chen, Y. D. I. & Reaven, G. M. Evaluation of octreotide to assess insulin-mediated glucose disposal by the insulin suppression test. Diabetologia 37, 843–845 (1994).
Google Scholar
-
Hovorka, R., Soons, P. A. & Young, M. A. ISEC: a program to calculate insulin secretion. Comput. Methods Prog. Biomed. 50, 253–264 (1996).
Google Scholar
-
Yeni-Komshian, H., Carantoni, M., Abbasi, F. & Reaven, G. M. Relationship between several surrogate estimates of insulin resistance and quantification of insulin-mediated glucose disposal in 490 healthy nondiabetic volunteers. Diab. Care 23, 171–175 (2000).
Google Scholar
-
Díaz-Rizzolo, D. A. et al. Late eating is associated with poor glucose tolerance, independent of body weight, fat mass, energy intake and diet composition in prediabetes or early onset type 2 diabetes. Nutr. Diabetes 14, 90 (2024).
Google Scholar
-
Chellappa, S. L. et al. Daytime eating prevents internal circadian misalignment and glucose intolerance in night work. Sci. Adv. 7, eabg9910 (2021).
Google Scholar
-
Wu, T. et al. Differential roles of breakfast and supper in rats of a daily three-meal schedule upon circadian regulation and physiology. Chronobiol. Int. 28, 890–903 (2011).
Google Scholar
-
Fuse, Y. et al. Differential roles of breakfast only (one meal per day) and a bigger breakfast with a small dinner (two meals per day) in mice fed a high-fat diet with regard to induced obesity and lipid metabolism. J. Circadian Rhythms 10, 1 (2012).
Google Scholar
-
Henry, C. J., Kaur, B. & Quek, R. Y. C. Chrononutrition in the management of diabetes. Nutr. Diabetes 10, 6 (2020).
-
Reutrakul, S., Punjabi, N. M. & Van Cauter, E. Impact of sleep and circadian disturbances on glucose metabolism and type 2 diabetes. Diabetes 1, 44 (2018).
-
Leproult, R., Holmbäck, U. & Van Cauter, E. Circadian misalignment augments markers of insulin resistance and inflammation, independently of sleep loss. Diabetes 63, 1860–1869 (2014).
Google Scholar
-
Reutrakul, S. & Van Cauter, E. Sleep influences on obesity, insulin resistance, and risk of type 2 diabetes. Metabolism 84, 56–66 (2018).
Google Scholar
-
Lee, S. W. H., Ng, K. Y. & Chin, W. K. The impact of sleep amount and sleep quality on glycemic control in type 2 diabetes: a systematic review and meta-analysis. Sleep. Med. Rev. 31, 91–101 (2017).
Google Scholar
-
Huang, T. et al. Association between accelerometer-measured irregular sleep duration and type 2 diabetes risk: a prospective cohort study in the UK biobank. Diab. Care 46, 1408–1416 (2023).
-
Poggiogalle, E., Jamshed, H. & Peterson, C. M. Circadian regulation of glucose, lipid, and energy metabolism in humans. Metabolism 84, 11–27 (2018).
Google Scholar
-
Gil-Lozano, M. et al. Short-term sleep deprivation with nocturnal light exposure alters time-dependent glucagon-like peptide-1 and insulin secretion in male volunteers. Am. J. Physiol. Endocrinol. Metab. 310, E41–E50 (2015).
Google Scholar
-
Gomez, A. M. et al. Effects of performing morning versus afternoon exercise on glycemic control and hypoglycemia frequency in type 1 diabetes patients on sensor-augmented insulin pump therapy. J. Diab. Sci. Technol. 9, 619–624 (2015).
Google Scholar
-
Savikj, M. et al. Afternoon exercise is more efficacious than morning exercise at improving blood glucose levels in individuals with type 2 diabetes: a randomised crossover trial. Diabetologia 62, 233–237 (2019).
Google Scholar
-
Williams, R. et al. Impact of lifestyle moderate-to-vigorous physical activity timing on glycemic control in sedentary adults with overweight/obesity and metabolic impairments. JAMA Intern. Med. 180, 789–797 (2021).
-
Smith, J. et al. Association of timing of moderate-to-vigorous physical activity with changes in glycemic control over 4 years in adults with type 2 diabetes from the look AHEAD trial. Diab. Care 45, 123–130 (2023).
-
Teo, S. Y. M., Kanaley, J. A., Guelfi, K. J., Marston, K. J. & Fairchild, T. J. The effect of exercise timing on glycemic control: a randomized clinical trial. Med. Sci. Sports Exerc. 52, 323–334 (2020).
Google Scholar
-
Mancilla, R., Krook, A., Schrauwen, P. & Hesselink, M. K. C. Diurnal regulation of peripheral glucose metabolism: potential effects of exercise timing. Obesity 28, S38–S45 (2020).
Google Scholar
-
Remchak, M. M. E. et al. Considerations for maximizing the exercise “drug” to combat insulin resistance: role of nutrition, sleep, and alcohol. Nutrients 13, 1–19 (2021).
Google Scholar
-
Di Murro, E. et al. Physical activity and type 2 diabetes: In search of a personalized approach to improving β-cell function. Nutrients 15, 4202 (2023).
Google Scholar
-
Martinez, L. et al. Genetic predisposition, modifiable lifestyles, and their joint effects on human lifespan: evidence from multiple cohort studies. Nat. Commun. 10, 1234 (2020).
-
Johnson, M. et al. Effects of genetic risk on incident type 2 diabetes and glycemia: the T2D-gene lifestyle intervention trial. Lancet Diab. Endocrinol. 11, 456–465 (2022).
-
Greenfield, M. S., Doberne, L., Kraemer, F., Tobey, T. & Reaven, G. Assessment of insulin resistance with the insulin suppression test and the euglycemic clamp. Diabetes 30, 387–392 (1981).
Google Scholar
-
Shen, S. W., Reaven, G. M. & Farquhar, J. W. Comparison of impedance to insulin-mediated glucose uptake in normal subjects and in subjects with latent diabetes. J. Clin. Invest. 49, 2151–2160 (1970).
Google Scholar
-
Vangipurapu, J. et al. A novel surrogate index for hepatic insulin resistance. Diabetologia 54, 540–543 (2011).
Google Scholar
Acknowledgements
The authors thank the participants and investigators of the CGM 1.0 study. We thank Susan Kirkpatrick and Monika Avina for their efforts in conducting the research. We would like to thank artist Lettie McGuire for her help in creating the graphical abstract for this manuscript. This study was funded by the National Institutes of Health (NIH)/NIDDK1R01 DK110186-01 (M.P.S. and T.M.), the Stanford PHIND award (M.P.S.), and the American Diabetes Association 11-23-PDF-76 (Y.W.). This study is part of the Precision Diets for Diabetes Prevention clinical trial (NCT03919877). H.P. was supported by the NIH institutional research training grant NIH 2T32HL09804911 and the Stanford Lifestyle Medicine grant. Y.W. is supported by Accelerate Innovation in Diabetes LeVeraging Unique PAthways iN Asians Program (ADVANCE). C.M. is supported by the NIH institutional research training grant (2T32AR007422-41). We also acknowledge the support of the Stanford Diabetes Research Center (P30DK116074).
Author information
Authors and Affiliations
Contributions
H.P., A.A.M., and M.P.S. conceptualized and designed the research; A.A.M., D.P., and A.C. conducted the research including sample collection; H.P., A.A.M., A.D., Y.W., M.R., C.M., and C.M. analyzed and visualized the data; T.M., E.M., and M.S.P. advised interpretation of the data analysis and discussion; A.C. and D.P. administered research project administration; H.P. wrote the original draft of the manuscript; A.A.M., A.D., Y.W., C.M., C.M., D.P., M.R., T.M., E.M., and M.P.S. reviewed and edited the manuscript. All authors have read and approved the final version of the manuscript. M.P.S. is the guarantor of this work and, as such, has full access to all the data in the study and takes responsibility for the integrity of the data and the accuracy of the data analysis.
Corresponding author
Ethics declarations
Competing interests
A.A.M. is currently an employee of Google, and A.D. is an employee of Calico Life Sciences. D.P. and T.M. are members of the scientific advisory board of January AI. M.P.S. is a co-founder and a member of the scientific advisory board of Personalis, Qbio, January AI, SensOmics, Protos, Mirvie, RTHM, and Iollo. He is on the scientific advisory board of Danaher, Neuvivo, and Jupiter. The remaining authors declare no competing interests.
Additional information
Publisher’s note Springer Nature remains neutral with regard to jurisdictional claims in published maps and institutional affiliations.
Supplementary information
Supplementary Information
Rights and permissions
Open Access This article is licensed under a Creative Commons Attribution-NonCommercial-NoDerivatives 4.0 International License, which permits any non-commercial use, sharing, distribution and reproduction in any medium or format, as long as you give appropriate credit to the original author(s) and the source, provide a link to the Creative Commons licence, and indicate if you modified the licensed material. You do not have permission under this licence to share adapted material derived from this article or parts of it. The images or other third party material in this article are included in the article’s Creative Commons licence, unless indicated otherwise in a credit line to the material. If material is not included in the article’s Creative Commons licence and your intended use is not permitted by statutory regulation or exceeds the permitted use, you will need to obtain permission directly from the copyright holder. To view a copy of this licence, visit http://creativecommons.org/licenses/by-nc-nd/4.0/.
Reprints and permissions
About this article
Cite this article
Park, H., Metwally, A.A., Delfarah, A. et al. High-resolution lifestyle profiling and metabolic subphenotypes of type 2 diabetes.
npj Digit. Med. 8, 352 (2025). https://doi.org/10.1038/s41746-025-01728-6
-
Received: 08 March 2024
-
Accepted: 13 May 2025
-
Published: 11 June 2025
-
DOI: https://doi.org/10.1038/s41746-025-01728-6