Abstract
In cis and trans geometrical configurations of the polyacetylene molecule, one-dimensional chain is constructed by attaching a number of identical –HC=CH– units one-by-one. We attach as many units as required to obtain the chain of the desired length. In case of a very long polyacetylene chain, which is practically considered infinite in length, a periodic unit is defined, so that its band structure would be calculable. Then, the electronic properties and topological properties of the chain can be predicted. Since experimental synthesis of single-layer polyacetylene chain has lots of limitations, in an alternative approach, emulation of a tight-binding model is used to describe the electron transfer in polyacetylene polymer chain. In case of either synthesis or testing the polyacetylene molecule, it is necessary to improvise a one-to-one correspondence between polyacetylene polymer and topological circuit, which is introduced for the first time in the present study. To this aim, the outputs of density functional theory calculations alongside with the calculations based on the physical chemistry formalisms are used. Here, we observed that the electronic response of the circuit is topologically sustained at frequencies where the coupling was pre-determined via high precision quantum system equivalent topolectrical circuit, as an alternative classical system, to study electron transfer of trans-polyacetylene polymer quantum chain by the precision of one-electron.
Introduction
Edge-state of quantum materials was first discovered via finding of soliton formation in long-chain of polyenes1, and followed by studying quantized Hall resistance in two-dimensional electron gas in metal-oxide semiconductor field-effect transistor2. The last two decades was a glorious time of this field when attention was made on topological systems3,4 and also opening research field in photonics, cold-atom, microwave, phonon and magnon systems5,6,7,8,9.
Shortly after introducing the Berry phase in quantum systems, J. H. Hannay determined that similar geometrical effects can be described using classical mechanics’ Hamiltonian equation (Supplementary information—Sect. 1)10. In other words, the topological states that are studied in quantum systems, could be studied in the classical systems as well. Considering the fact that the “Berry-phase” is as an index of showing how the material has topological properties in quantum terms10, one can tell the created “frequency-gap” in the phonon spectrum of a simple tensegrity structure (as a model for a classical meta-material with topological properties) could be considered as the classification index in classical terms as well. Then it is checked how the “frequency-gap” is correlated to the edge states. Previous analysis indicates the existence of newly known mechanical phases, which are topologically distinct. The protected edge states could be described by one-dimensional modeling, expressed in the form of SSH model (Su, Schrieffer, Heeger), for mapping of polymer’s equivalent electrical circuit (Supplementary information—Sect. 2–3)11.
The relation between the various parameters in non-self-consistent semi-empirical tight binding (TB) calculations and self-consistent density functional theory (DFT), relies on either TB energy expression or the short-range and transferable matrix elements12. Prediction of the energy gap and other parameters of interest related to the band structure is mapped in the tight-binding Hamiltonian system12. In order to screen out the Coulomb interaction, one can solve the Schrodinger-like “Kohn–Sham” equations for the valence electrons. By this simplified method, one can ignore the core electron potential in favor of the valence pseudopotential12. The Kohn–Sham approach over the past decades has led to the development of more than a hundred software packages (including Quantum Espresso) with default numerical implementations of DFT13,14,15,16,17. The wave function attributed to real atomic orbitals, results in the creation of artificial orbitals known as “Kohn–Sham orbitals”13,16. The DFT calculations have been very efficient for systems with a large number of electrons18.
Study of topological electrical circuits is a nascent and rapidly developing scope that analyzes the electronic structures of materials, based on the topological characteristics of their eigenstates9. This scope of science is inspired by extensive studies that were previously conducted in the field of dense matter physics, which used to focus on the relationship between topology and various phenomena19. Further, in the last decade, obtaining new findings resulted in extension of the concept of topology from solid state electronic structures to other structures with similar dynamics, such as photonic and acoustic systems19,20.
Due to the laboratory limitations of the synthesis and testing of polyacetylene polymer, it is necessary to construct an electrical circuit with the same topolectrical properties as polyacetylene polymer, which is the main discussed approach in the present study. Here, experimental monitoring of the polyacetylene’s topological behavior was obtained according to the Hamiltonian matrix of the circuit. Here, We introduce a one-dimensional (1D) model that illustrates this phenomenon in its simplest form and maps directly to the SSH model for the electronic excitations of polyacetylene ((CH2)n)11. Our analysis allows us to predict the existence of new topologically distinct bulk mechanical phases and to characterize the protected modes that occur on their boundary.
Results
In this study, numerical values of ({t}_{1}) and ({t}_{2}) couplings were fitted to the band structures calculated using Quantum Espresso software13. It should be noted that the geometrically optimized bond lengths, are in absolute agreement with experimental values21,22. Using plane waves as the basis set for expanding the wave function, the QE package is suitable for the calculations of systems that are alternating periodic in all three dimensions. We set the kinetic energy cutoff 30 Ry. The self-consistent cycle is looped until the total energy converges, i.e. when the change in energy in two consequent cycles falls below 0.0001 atomic units (2.7 meV). Then, the numerical values of Cb, Ca, and L were obtained from Eq. (1). By using these values, the equivalent electrical circuit was designed and built according to the one-dimensional one-layer structure of polyacetylene polymer. In this regard, the correspondence of the performance of the constructed topolectrical circuit with the electrical properties of polyacetylene polymer was studied. The details of which are given below (Also see Supplementary information—Sect. 4).
Outputs of Quantum Espresso software
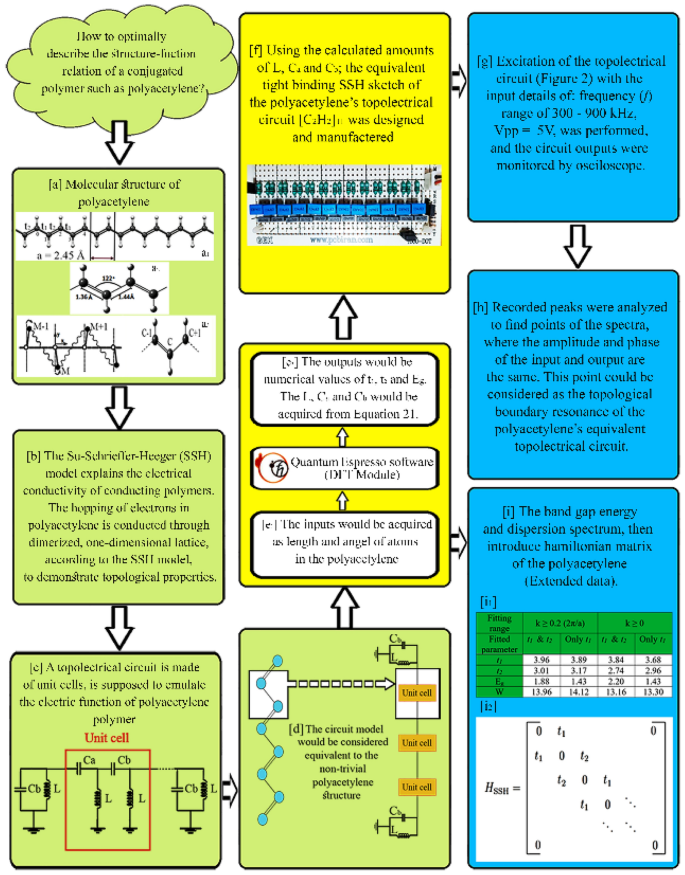
Using the hybrid B3LYP functional, available in Quantum Espresso software, the energy gap of polyacetylene in the trans configuration is 1.43 eV. The obtained band structure includes six energy bands. The five lowest energy bands are occupied by the 10 electrons of the unit cell. One electron for each hydrogen atom and 4 electrons for each carbon atom occupy the 2 s and 2p orbitals in the calculations. Since each unit cell has two hydrogen atoms and two carbon atoms, a total of 10 electrons per unit cell have been included in the calculations, which, including the upper and lower spins, finally fill the lower five states23. Energy dispersion in the last occupied band and the first unoccupied band, especially close to the edge of the Brillouin zone (i.e. (k=0.5 (frac{2pi }{a}))), where a direct energy gap with a width of 1.43 eV, is the most important result of DFT calculations. The parameters of the tight-binding model are determined by fitting this part of the band structure, which is explained in Fig. 1 (panel—i1).

Visual outline of all steps performed in the present study. The green, yellow, and blue panels indicate the conceptual design, method, and results, respectively. (a1) Trans configuration of polyacetylene chain in one-dimensional periodic structure. The meaning of “a”, which is indicated in the figure, is the lattice constant with angstrom (Å) unit. (a2) Stable structure of polyacetylene molecule with trans configuration (zigzag), where the single and double bond lengths are 1.44 Å and 1.36 Å, respectively. The angle between three consecutive carbon atoms is 122 degrees. (a3) (Left side) is a part of the network of coupled gyrators, which is the classical equivalent (right side) of a part of the quantum chain of the polyacetylene polymer. (b) The SSH model describes how electron hopping occurs in a semi-finite chain of the conducting polymer polyacetylene. (c) Unit cell structure of the polyacetylene equivalent topolectrical circuit, as the building units of the circuit. (d) Schematic profile of the one-to-one correspondence of the constituent parts of the polymer and the equivalent topolectrical circuit of polyacetylene. (e1–e2) DFT module inputs and outputs of Quantum Espresso software. (f) Designing and building a topolectrical circuit, based on the outputs of Quantum Espresso software. (g) Excitation and recording conditions of the equivalent topolectrical circuit of polyacetylene. (h) Analysis of the recorded outputs of the topolectrical circuit, in search of the edge-effect. (i) Comprehensive characterization of the conductivity of polyacetylene polymer as a topological system, using dispersion spectrum. (i1) Electron’s hopping parameters, energy gap and bandwidth W = 2(t1 + t2), obtained from fitting the dispersion relation to DFT calculation data. The unit of all values is in electron volt (eV). (i2) The SSH model is a tight binding 1D chain with conjugating hopping parameters.
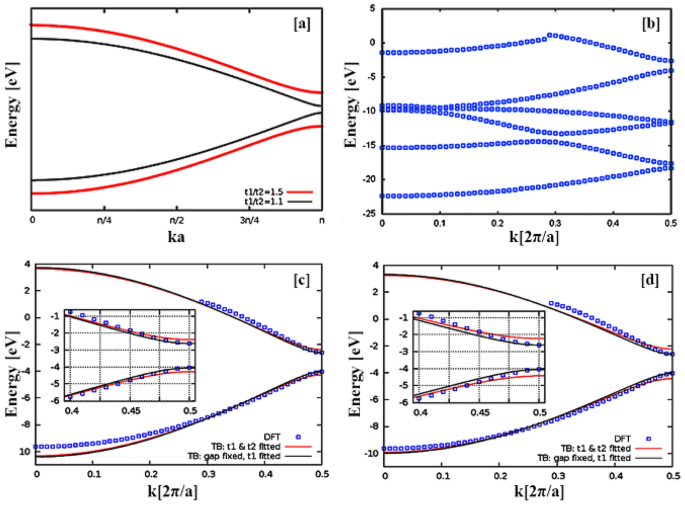
The band structure for two different ratios of hopping parameters is shown in Fig. 2 (Panels c and d). The results of both fitting methods are shown in Fig. 2 (Panels c and d), and the fitted values are listed in Fig. 1i1. The numerical results are somewhat dependent on the fitting method and the intervals, which used to fit the data, but the pattern is consistent with the prediction of the tight-binding model.

Dispersion spectrum of polyacetylene polymer. (a) the band structure of the polyacetylene chain in the tight-binding model for two different ratios of hopping parameters. In each case, the lower band (conduction) is occupied by electrons and the upper band (valence) is unoccupied. (b) the band structure of polyacetylene obtained from DFT calculations using the B3LYP function. Up to the fifth band (counting from bottom to top) is occupied by electrons and the sixth band is remained unoccupied. Only the highest two bands are used for fitting of the two-state tight-binding model. (c) Fitted tight-binding dispersion relation to the energy bands of the DFT framework. When both parameters (red solid line) or only one of them (black solid line) are fitted to the data in the interval (i.e. k ∈ [0.2,0.5] × 2π/a), the results would be the ones in the Fig. 1i1. (d) Like Panel c, the fitting is done, but to the entire data interval (i.e. k ∈ [0,0.5] × 2π/a). The fitting results are listed in Fig. 1i1.
Experimental outputs resulting from the equivalent electric circuit
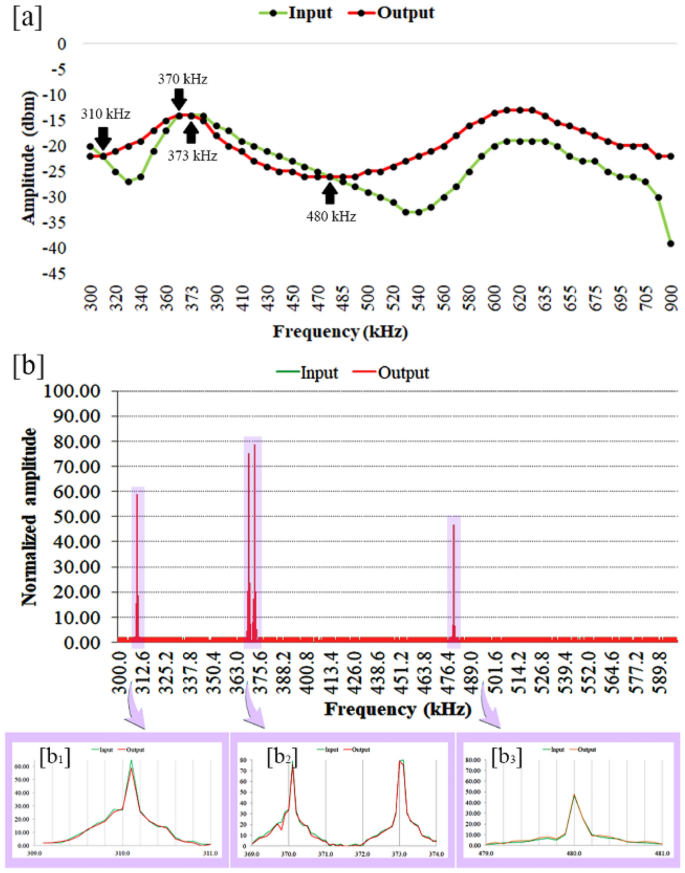
The topolectrical circuit, equivalent to polyacetylene, was stimulated with two topological and non-topological modes and the resulting outputs were recorded with an oscilloscope. By recording the inputs and outputs, it was shown that the input and output amplitudes were found to be equal at four frequencies (310, 370, 373 and 480 kHz). Further, at one out of four recording frequencies, it was observed that the input and output states were in the same phase in addition to being of the same amplitude (Fig. 3a).

Amplitude and phase profiles obtained from input and output records taken with an (a) oscilloscope. (b) The input and output signals recorded with a spectrum analyzer and represented as normalized amplitude. Since the input and output amplitudes are completely matched, only the output peaks are demonstrated here. The peaks that emerge with the same amplitude are highlighted in b1 to b3 panels, respectively.
In this way, at the recording frequency of 373 kHz, the absolute electrical conduction occurs in the equivalent polyacetylene polymer electrical circuit.
Discussion
Unlike the energy of the ground state, the energy of the unoccupied states, and therefore the energy gap, may have a significant difference in reality and laboratory results. Many efforts have been made to solve these shortcomings, and nowadays so-called hybrid density functional have been designed to estimate the effects of electron exchange–correlation, which then impose more computational cost, have provided high-accuracy energy gap prediction.
Fortunately, hybrid DFT calculations that reproduce experimental results with high accuracy are nowadays feasible for even much more complex structures than polyacetylene24. Our results show that in the band structure of polyacetylene, obtained from DFT calculations with the B3LYP functional, only two higher energy bands (Fig. 2b) are used to fit the tight-binding two-state model. Note that, in contrast to the DFT calculations, only two bands are considered in the tight-binding model. In particular, for the highest energy band, the data-points from DFT calculations for k 0.28 [2π/a] from the DFT band structure in order to fit the corresponding segment of the energy band of the tight-binding model. The fitting results, based on the two applied ranges (k ∈ [0.2,0.5] × 2π/a and k ∈ [0,0.5] × 2π/a) show that the obtained Eg (1.88 electron volts—Fig. 1il) is completely consistent with the prediction of experimental findings23,25, while the Eg obtained from Supplementary information—Eq. (17c) was consistent with the theoretical expectation26 (1.43 electron volts—Fig. 1il).
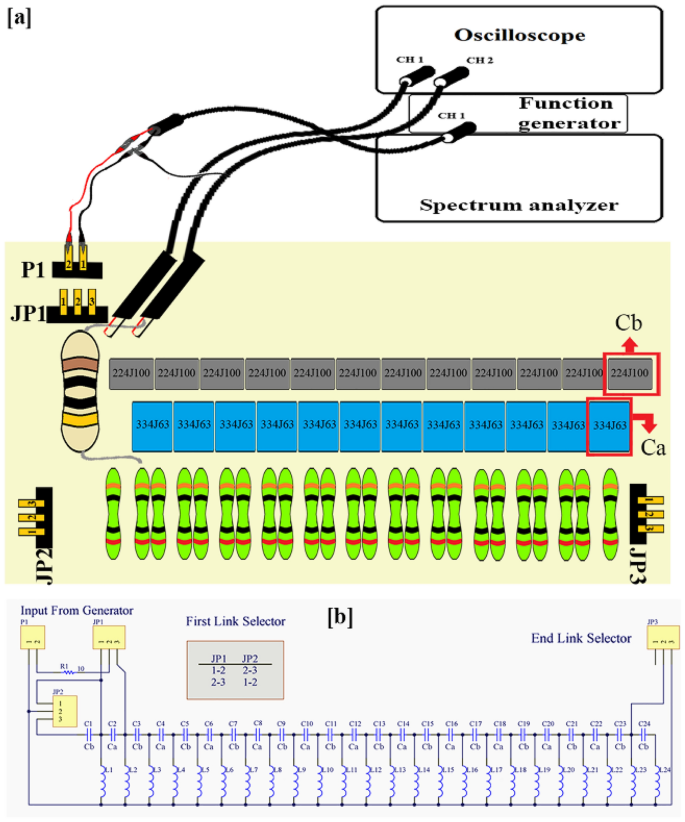
The topolectrical circuit that is designed based on the SSH model, must have a row of capacitors (i.e. Cb and Ca), which are separated from each other by inductors (i.e. L), and each of them is connected to the ground (Fig. 1c). When the Cb/Ca ratio becomes less than one, a topological boundary mode appears9. Apparently, there must be a “fingerprint frequency”, in which formation of a topological boundary mode is expected. It might be where that the polyacetylene’s equivalent circuit has maximum conductivity. To assay the accuracy of the aforementioned conclusion, polyacetylene’s equivalent topolectrical circuit, was electrically stimulated with a voltage of 5 Vpp and the output was recorded with an oscilloscope (Fig. 4). It was observed that at a frequency of 373 kHz, both the amplitude and phase of the input and output modes were the same (Fig. 3a), which confirms that at certain frequencies the polyacetylene’s equivalent circuit has the absolute electrical conductivity, which are named as “fingerprint frequency” (Fig. 3b).

Experimental set-up for stimulating and recording the polyacetylene’s equivalent topolectric circuit. (a) The schematic profile of the set-up is demonstrated. The circuit was excited with function generator and its output recorded by oscilloscope. (b) Topolectrical equivalent circuit map of polyacetylene polymer.
Conclusion
In the present study, we studied the polyacetylene polymer lattice with two independent approaches (classical and quantum physics). Based on what is mentioned in the Eq. (1) and Supplementary information—Eqs. 6, 16, the variables λ, t and C were extracted, respectively. Aligning the aforementioned equations, one can find out that the λ, t and C variables are replaceable. Since, the t-parameter explains electron hopping in the quantum chain of the polyacetylene polymer, the other two parameters (i.e. λ and C) could give the same description in classical models. By these means, the polyacetylene’s equivalent topolectrical circuit, could be considered as an accurate classical model to study the electrical behavior of the polyacetylene quantum chain. This emulated and low-cost setup (i.e. polyacetylene’s equivalent topolectric circuit), not only enables us to study the electron quantum hopping in the polymer lattice on a macroscopic and laboratory scale, but also facilitates assay of other similar quantum phenomena in the same way. Further, the polyacetylene’s equivalent topoelectrical circuit, introduces promising approaches in molecular electronics and topological material studies.
Methods
In Fig. 1, all the steps performed in the current study, from conceptual design to recording the results, are depicted. In the following sections, each of these steps is explained separately and in detail.
Experiment
Equivalent experimental electrical circuit
As we know, different physical systems show the same behavior if they are described by the same dynamic equations. Therefore, for a mechanical system, an equivalent electrical system (e.g. equivalent electrical circuit) could be simulated as well. Then, for a 1D electric circuit (Fig. 1, panels c and d), the network dispersion relation could be rewritten in Eq. (1), according to Supplementary information—Eq. (16):
where the coupling ({t}_{1}) and ({t}_{2}) coefficients are equivalent to Cb and Ca capacitors in the circuit (Eq. (2)), respectively (Fig. 1 panels c and d).
The one-dimensional (1D) model exactly maps to the SSH model for the electronic excitations of the polyacetylene polymer (left({left({CH}_{2}right)}_{n}right)), as a linear polymer with conjugated single and double bonds between carbon atoms.
The equivalent electrical circuit of polyacetylene is made of alternating capacitors (i.e. Ca and Cb), among which there are a number of same inductors L, all of which are connected to the ground. The variable that is the index of topological edge formation in the circuit, is obtained from the Ca/Cb ratio, in the condition that t < 19. If the mentioned conditions are met and the polyacetylene’s equivalent circuit was electrically excited with a voltage of 5 Vpp, it would be expected that the excitation and recording voltage ranges coincide in some frequencies, during mapping the recording spectrum. If the points of interest are matching at the exciting and recording voltages at different frequencies of the spectrum have the same phase, we can expect to see formation of an edge effect at the excitation frequency9. As shown in Fig. 1 – f, an electrical circuit that was previously designed based on the SSH model, is implemented on a printed circuit board. To build such a circuit, according to the Supplementary information—Eq. (17c), in which the numerical value of Eg was equal to 1.43 eV, the values of the variables ({t}_{1}) and ({t}_{2}) were adapted from the “Only ({t}_{1})” column (Fig. 1i1). Accordingly, ({t}_{1}) and ({t}_{2}) will have values equal to 3.89 and 3.17 eV, respectively, and the ({t}_{1 }/{t}_{2}) ratio will be equal to 0.82. Now, by using the Eq. (2), the numerical values of the capacitors Ca and Cb would be obtained equal to 0.33 and 0.22 micro-Farad, respectively; and the inductors (L) would be equal to 10 micro-Henry. Then, the topolectrical circuit would be arranged according to the aforementioned parameters9. In order to obtain the exact capacity that is expected from the capacitors and inductors used in the electrical circuit, it is necessary to test each one individually before placing them in the circuit arrangement. By this regard, all capacitors and inductors were placed in the circuit with 5% error. By connecting sockets at both ends of the circuit to the pins it was possible to have either the topological or non-topological circuits available, depending on the displacement of these connections (explained in Fig. 4—Panel b). In this regard, the electrical circuit was subjected to electrical stimulation by the function generator (GWINSTEK-MFG-2120MA) in the range of 300 to 900 kHz with 5 Vpp, and the output of the circuit was measured by both the oscilloscope (GWINSTEK-GDS-1072B) and spectrum analyzer (Agilent-E4407B).
The spectrum analyzer sweeps the area of interest with optimized intervals and both the input and output signals would be demonstrated with normalized amplitude.
Data availability
The study did not report any data.
References
-
Su, W. P., Schrieffer, J. & Heeger, A. J. Solitons in polyacetylene. Phys. Rev. Lett. 42, 1698 (1979).
Google Scholar
-
Klitzing, K. V., Dorda, G. & Pepper, M. New method for high-accuracy determination of the fine-structure constant based on quantized Hall resistance. Physical Review Letters 45, 494 (1980).
Google Scholar
-
Budich, J. C. & Bergholtz, E. J. Non-Hermitian topological sensors. Phys. Rev. Lett. 125, 180403 (2020).
Google Scholar
-
Yuan, H. et al. Non-Hermitian topolectrical circuit sensor with high sensitivity. Adv. Sci. 10, 2301128 (2023).
Google Scholar
-
Haldane, F. D. M. & Raghu, S. Possible realization of directional optical waveguides in photonic crystals with broken time-reversal symmetry. Phys. Rev. Lett. 100, 013904 (2008).
Google Scholar
-
Lu, L., Joannopoulos, J. D. & Soljačić, M. Topological photonics. Nat. Photon. 8, 821–829 (2014).
Google Scholar
-
Yang, Z. et al. Topological acoustics. Phys. Rev. Lett. 114, 114301 (2015).
Google Scholar
-
Goldman, N., Budich, J. C. & Zoller, P. Topological quantum matter with ultracold gases in optical lattices. Nat. Phys. 12, 639–645 (2016).
Google Scholar
-
Lee, C. H. et al. Topolectrical circuits. Commun. Phys. 1, 39 (2018).
Google Scholar
-
Hannay, J. H. Angle variable holonomy in adiabatic excursion of an integrable Hamiltonian. J. Phys. A: Math. Gen. 18, 221 (1985).
Google Scholar
-
Kane, C. L. & Lubensky, T. C. Topological boundary modes in isostatic lattices. Nat. Phys. 10, 39–45 (2014).
Google Scholar
-
Foulkes, W. M. C. & Haydock, R. Tight-binding models and density-functional theory. Phys. Rev. B 39, 12520 (1989).
Google Scholar
-
Giannozzi, P. et al. QUANTUM ESPRESSO: A modular and open-source software project for quantum simulations of materials. J. Phys.: Condens. Matter 21, 395502 (2009).
Google Scholar
-
Dreizler, R. & Gross, E. Density Functional Theory (Springer, Berlin, 1990).
Google Scholar
-
Patterson, J. D. Density-functional theory of atoms and molecules: Robert G. Parr and Weitao Yang. Oxford University Press, New York, and Clarendon Press, Oxford (Pergamon, 1989).
-
Kohn, W. & Sham, L. J. Self-consistent equations including exchange and correlation effects. Phys. Rev. 140, A1133 (1965).
Google Scholar
-
Schmitteckert, P., Thomale, R., Korytár, R. & Evers, F. Incommensurate quantum-size oscillations in acene-based molecular wires—Effects of quantum fluctuations. J. Chem. Phys. 146, 1 (2017).
Google Scholar
-
Saad, Y., Chelikowsky, J. R. & Shontz, S. M. Numerical methods for electronic structure calculations of materials. SIAM Rev. 52, 3–54 (2010).
Google Scholar
-
Zhang, X., Zangeneh-Nejad, F., Chen, Z.-G., Lu, M.-H. & Christensen, J. A second wave of topological phenomena in photonics and acoustics. Nature 618, 687–697 (2023).
Google Scholar
-
Su, Y. et al. Scalability of Large-Scale Photonic Integrated Circuits. (ACS Photonics, 2023).
-
Hudson, B. S. Polyacetylene: Myth and reality. Materials 11, 242 (2018).
Google Scholar
-
Yannoni, C. & Clarke, T. Molecular geometry of cis-and trans-polyacetylene by nutation NMR spectroscopy. Phys. Rev. Lett. 51, 1191 (1983).
Google Scholar
-
Heeger, A. J., Kivelson, S., Schrieffer, J. & Su, W.-P. Solitons in conducting polymers. Rev. Mod. Phys. 60, 781 (1988).
Google Scholar
-
Truong, M. A. et al. Tripodal triazatruxene derivative as a face-on oriented hole-collecting monolayer for efficient and stable inverted perovskite solar cells. J. Am. Chem. Soc. 145, 7528–7539 (2023).
Google Scholar
-
Chung, T. C., Feldblum, A., Heeger, A. & MacDiarmid, A. G. Experimental studies of sodium-doped polyacetylene: Optical and ESR results for metallic (CHNa y) x. J. Chem. Phys. 74, 5504–5507 (1981).
Google Scholar
-
Bredas, J., Silbey, R., Boudreaux, D. & Chance, R. Chain-length dependence of electronic and electrochemical properties of conjugated systems: Polyacetylene, polyphenylene, polythiophene, and polypyrrole. J. Am. Chem. Soc. 105, 6555–6559 (1983).
Google Scholar
Acknowledgements
The authors wish to thank Iman Rad for being partially involved with the manuscript revision process.
Funding
This study received no financial support.
Author information
Authors and Affiliations
Contributions
M.R.A. was involved data acquisition (theoretical, modeling and experimental) and data analysis. A.S. was involved with DFT modelling and interpretation, and S.M.M. was involved in concept development and experimental data analysis. All authors have read and agreed to the published version of the manuscript.
Corresponding author
Ethics declarations
Competing interests
The authors declare no competing interests.
Additional information
Publisher’s note
Springer Nature remains neutral with regard to jurisdictional claims in published maps and institutional affiliations.
Supplementary Information
Supplementary Information.
Rights and permissions
Open Access This article is licensed under a Creative Commons Attribution 4.0 International License, which permits use, sharing, adaptation, distribution and reproduction in any medium or format, as long as you give appropriate credit to the original author(s) and the source, provide a link to the Creative Commons licence, and indicate if changes were made. The images or other third party material in this article are included in the article’s Creative Commons licence, unless indicated otherwise in a credit line to the material. If material is not included in the article’s Creative Commons licence and your intended use is not permitted by statutory regulation or exceeds the permitted use, you will need to obtain permission directly from the copyright holder. To view a copy of this licence, visit http://creativecommons.org/licenses/by/4.0/.
Reprints and Permissions
About this article
Cite this article
Albooyeh, M.R., Sadeghi, A. & Mohseni, S.M. Topolectrical Circuit Correspondence Design of Polyacetylene.
Sci Rep 13, 20847 (2023). https://doi.org/10.1038/s41598-023-48278-z
-
Received: 16 October 2023
-
Accepted: 24 November 2023
-
Published: 27 November 2023
-
DOI: https://doi.org/10.1038/s41598-023-48278-z
Comments
By submitting a comment you agree to abide by our Terms and Community Guidelines. If you find something abusive or that does not comply with our terms or guidelines please flag it as inappropriate.