Abstract
The mosquito Anopheles gambiae s.s. is a primary malaria vector throughout sub-Saharan Africa including the islands of the Comoros archipelago (Anjouan, Grande Comore, Mayotte and Mohéli). These islands are located at the northern end of the Mozambique Channel in eastern Africa. Previous studies have shown a relatively high degree of genetic isolation between the Comoros islands and mainland populations of A. gambiae, but the origin of the island populations remains unclear. Here, we analyzed phylogenetic relationships among island and mainland populations using complete mitochondrial genome sequences of individual A. gambiae specimens. This work augments earlier studies based on analysis of the nuclear genome. We investigated the source population of A. gambiae for each island, estimated the number of introductions, when they occurred and explored evidence for contemporary gene flow between island and mainland populations. These studies are relevant to understanding historical patterns in the dispersal of this important malaria vector and provide information critical to assessing their potential for the exploration of genetic-based vector control methods to eliminate this disease. Phylogenetic analysis and haplotype networks were constructed from mitogenome sequences of 258 A. gambiae from the four islands. In addition, 112 individuals from seven countries across sub-Saharan Africa and Madagascar were included to identify potential source populations. Our results suggest that introduction events of A. gambiae into the Comoros archipelago were rare and recent events and support earlier claims that gene flow between the mainland and these islands is limited. This study is concordant with earlier work suggesting the suitability of these oceanic islands as appropriate sites for conducting field trial releases of genetically engineered mosquitoes (GEMs).
Introduction
The Comoros archipelago consists of the oceanic islands of Ngazidja (Grande Comore), Mwali (Mohéli), Ndzwani (Anjouan) and Mayotte. These volcanic islands are situated in the Mozambique Channel in the Indian Ocean, approximately 300 km off the coast of Mozambique and at a similar distance from the coast of Madagascar. There are nine species of anopheline mosquitoes reported on these islands1,2, but Anopheles gambiae is the principal malaria vector3. Human migration to the Comoros intensified in the late nineteenth century which is correlated with the appearance of malaria transmission4. Since then, numerous strategies have been employed to control malaria on these islands, including mass drug administration, indoor residual spraying (IRS), and the distribution of insecticide treated bed nets4. However, between 2020 and 2021 the Comoros experienced a 56.95% increase in malaria cases (World Malaria Report 2022, WHO). This trend underscores the limitations of currently available methods for controlling malaria and the need for new approaches to address the malaria problem5,6. Among new malaria control methodologies under development are genetic based strategies that propose to modify mosquito vector populations by the introduction of exogenous parasite blocking effector genes coupled with a Cas9-based gene drive7.
Recent advances in genetic engineering have the promise of providing a high-impact, sustainable and cost-effective method for the elimination of malaria using genetically engineered mosquitoes (GEM) with gene drive8. Field trials are a key phase of the World Health Organization (WHO) Guidance Framework for evaluating and regulating GEM use9. This Framework states that on completion of laboratory and insectary testing (phase 1), ecologically confined field-trials (phase 2) must be conducted prior to open-field deployment (phase 3).
Oceanic islands are among the most suitable sites for field trials due to the low biodiversity and genetic complexity of resident vector populations, their genetic and geographic isolation, and their small size10. Previously published studies suggested a high degree of genetic isolation between A. gambiae s.s. populations in the Comoros and neighboring mainland populations to the west11,12. However, little is known about the colonization routes and patterns of introduction of this malaria vector into the islands. Here, we focused on investigating the historical movement of A. gambiae across Africa and into the islands using phylogenetics and mitogenome analysis. For that purpose, we analyzed complete mitochondrial genomes of A. gambiae collected from the Comoros Islands, Madagascar, and six continental countries. We used haplotype profiles to determine: (i) the ancestral origin of island populations, (ii) the number of introductions, (iii) an estimate of when introductions occurred, and (iv) the level of ongoing contemporary gene flow among populations.
Results
Mitogenome assemblies and genetic diversity
In total, 370 complete mitochondrial genomes were used to investigate the origin of A. gambiae on the islands of Anjouan, Mayotte, Mohéli and Grande Comore (Fig. 1). Potential source populations were identified from six countries across sub-Saharan Africa, including Cameroon, Mali, Mozambique, Tanzania, Uganda, and Zambia, as well as the island nation of Madagascar. New A. gambiae mitochondrial genome sequences were generated through whole DNA sequencing of individual mosquito specimens from Mohéli, Grande Comore, and Madagascar, as described in the methods section. Grande Comore presented the lowest nucleotide diversity (π = 1.9 × 10⁻⁴), despite overrepresentation in sample size, followed by Mayotte (π = 4.2 × 10⁻⁴), Anjouan (π = 4.3 × 10⁻⁴), and Mohéli (π = 4.4 × 10⁻⁴) (Table 1).
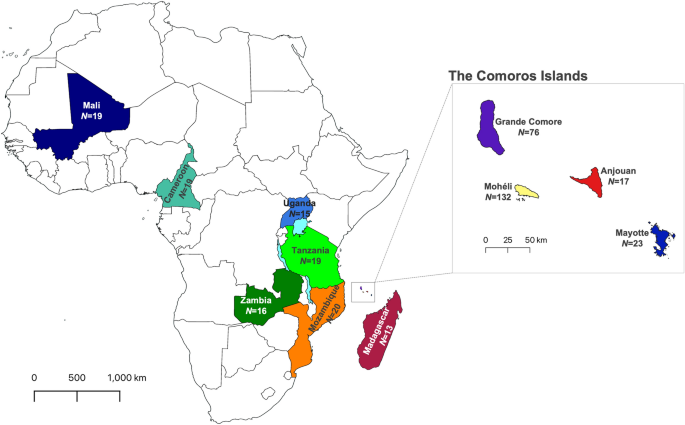
Overview of population sampling. Sampling of Anopheles gambiae locations in African mainland and oceanic islands. Main map includes colour-code continental countries and Madagascar. The insert map illustrates islands of the Comoros archipelago: Grande Comore, Mohéli, Anjouan and Mayotte. Sample size is displayed under each population country/island name. Maps were generated using QGIS v3.28 (available at www.qgis.org).
Phylogenetics
The complete phylogenetic analysis represents 370 terminals of A. gambiae s.s. from African islands and mainland populations and additional terminals representing two sister species within the A. gambiae complex: A. melas and A. merus (Fig. S1). A simplified phylogenetic tree was built with one representative of each unique haplotype (Fig. 2). All relationships between localities within mitogenome phylogenies were resolved with significant support using ML and BI analysis (ML > 70 and BI > 90; Fig. 2).
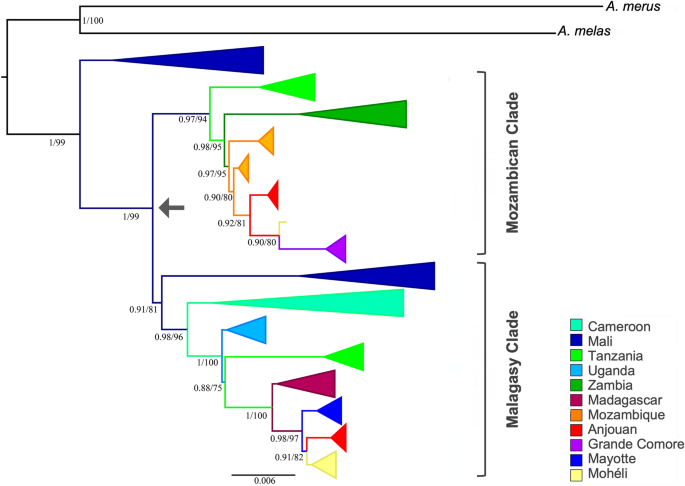
Phylogram of Anopheles gambiae using complete mitogenome of a subset of individuals with only unique sequences. Values > 0.7 for ML and 90% for BI are shown and represented by percentages to the left of nodes. Arrow indicates a divergence within A. gambiae occurring in West Africa.
Mali is recovered as the earliest branching lineage within A. gambiae and is sister to two clades: a Mozambican clade and a Malagasy clade. The Mozambican clade includes Tanzania, Zambia, Mozambique, Anjouan, Mohéli and Grande Comore. The Malagasy clade includes a second branch from Mali, Cameroon, Uganda, Tanzania, Madagascar, Mayotte, Anjouan, and Mohéli. Individuals from Tanzania are recovered as two distinct monophyletic clades: the Mozambican clade, as the earliest branch lineage sister to Zambia, and the Malagasy clade, preceeded by Cameroon and Uganda, and as sister to Madagascar (Fig. 2). Grande Comore is recovered as a monophyetic clade within the Mozambican clade and sister to one individual from Mohéli and monophyletic clades comprised of individuals from Anjouan and Mozambique (Fig. 2). The remaining individuals from Mohéli are recovered as a monophyletic clade within the Malagasy clade that is sister to monophyletic clades comprised of individuals from Anjouan, Mayotte and Madagascar. Both the Mozambican and Malagasy clades are recovered with strong support (Fig. 2).
Schematic representation of the two routes of A. gambiae introduction from West to East Africa is shown in Fig. 3. The Malagasy clade belongs to a lineage originating in Mali and Cameroon, and first appears in Uganda in East Africa before migrating to Tanzania and then Madagascar (Fig. 3a). The Mozambican clade also belongs to a Malian lineage, but it first arrived in Tanzania in East Africa before migrating to Zambia and then Mozambique (Fig. 3a). The two haplotypes on Mayotte appear to have diverged from a single Malagasy ancestral lineage (Fig. 3b). The haplotypes in Anjouan have their origins from both the Malagasy and Mozambican clades (Fig. 3b). The majority of individuals sampled from Mohéli appear to have diverged from the Malagasy clade, but a single individual had a haplotype originating from the Mozambican clade, and they all share lineages with Anjouan. Haplotypes present in Grande Comore originate from the Mozambican clade, which appear to be diverged from a single ancestral lineage and likely originated from Mohéli (Fig. 2; Fig 3b).
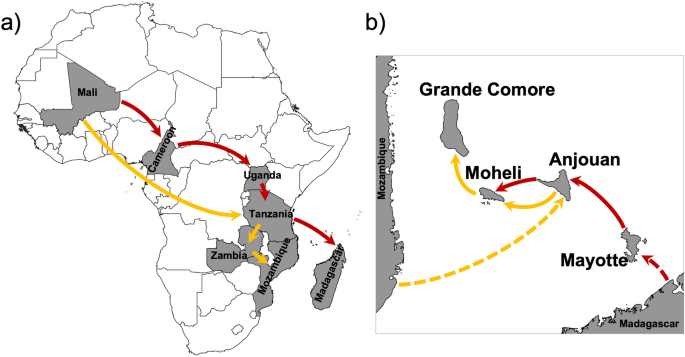
Schematic representation of the two routes of Anopheles gambiae dispersal from West to East Africa and subsequently into the Comoros archipelago. Arrows indicate the direction and routes of dispersal for the Malagasy clade (in red) and the Mozambican clade (in orange). (a) West to East dispersal of A. gambiae in continental Africa and Madagascar. (b) A. gambiae dispersal into the Comoros Islands. Distance between the islands and Mozambique and Madagascar not scaled. Maps were generated using QGIS v3.28 (available at www.qgis.org).
Haplotype network and migration
Haplotype network was performed separately for the two routes (Malagasy and Mozambican) of A. gambiae dispersal across continental Africa and into oceanic islands (Fig. 4). There are no shared haplotypes between populations of the Comoros islands and source populations represented by African mainland countries and Madagascar (Fig. 4). In the Malagasy clade route, haplotypes from Mayotte island are separated from the closest mainland haplotypes, Tanzania, by at least 20 mutations, and from Madagascar by 8 mutations (Fig. 4a). Haplotypes from Anjouan Island, in the Mozambican clade route, are seperated from Mozambique, the closest mainland haplotypes, by at least 10 mutations (Fig. 4b). In the Malagasy clade route, Anjouan island haplotypes are separated by 12 mutations from Madagascar (Fig. 4a).
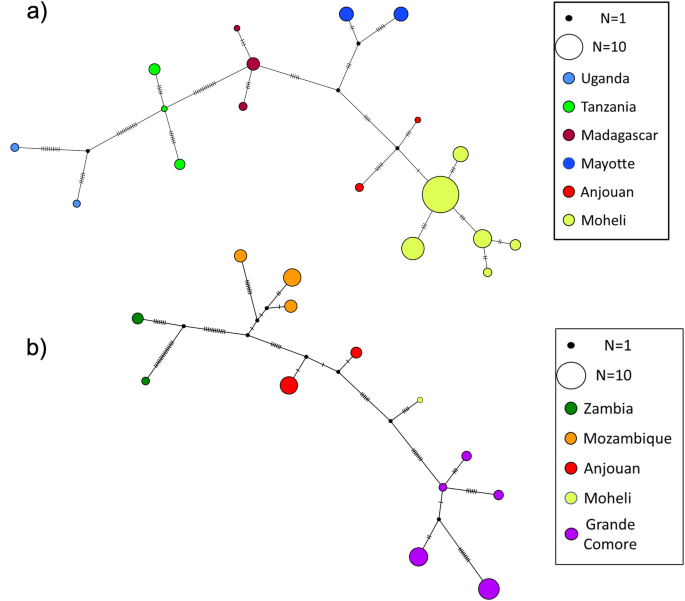
Haplotype networks of A. gambiae clades present in the Comoros Islands and their ancestors. (a) Haplotype network for the Malagasy clade. (b) Haplotype network for the Mozambican clade.
Migrate-n analysis are illustrated as chord diagrams in Fig. 5. Migration of A. gambiae occurred also along two routes from West Africa to East Africa. The Malagasy route from Mali → Cameroon → Uganda → Tanzania → Madagascar → Mayotte → Anjouan → Mohéli (Fig. 5a); and the Mozambican route from Mali → Tanzania → Zambia → Mozambique → Anjouan → Mohéli → Grande Comore (Fig. 5b). Migration estimates result in similar rates of A. gambiae dispersal from West Africa to East Africa, and slightly decreased in rates as A. gambiae migrated to the islands (Fig. 5). Our analysis indicates migration along a largely unidirectional gradiatent from east to west among island populations with negligible migration occuring in the opposite direction (Fig. 5). Migration from any island population to any continental population, or to Madagascar, also appears to be highly unlikely (Fig. 5).
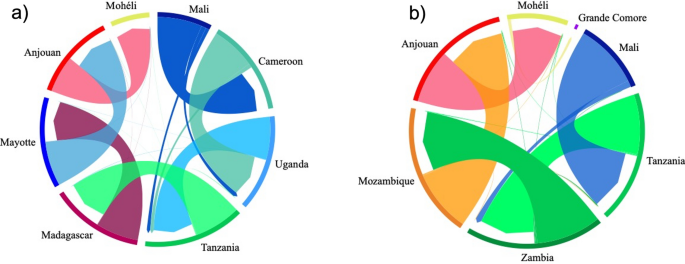
Migration pattern of A. gambiae populations using Migrate-n analysis. The color of each arrow corresponds to the color of the source population locality listed outside of the circle. The width of each arrow is proportional to the estimated migration rate. The arrows indicate the direction of migration, the arrow base indicates the source population and the arrowhead the recipient population. (a) Migration of the Malagasy clade. (b) Migration of the Mozambican clade.
Divergence time estimates
We recovered a well-supported phylogeny generated in BEAST2 that is concordant with ML and BI mitogenomic phylogenetic trees (Fig. 6). The annotated BEAST2 tree supports a recent divergence of populations of the four Comoros islands from ancestral mainland African populations (Fig. 6). We assumed a substitution rate of 1.87 × 10⁻⁸ mutations per site per year, and a generation time of three weeks. Divergence time estimates reveal that these island populations began differentiating from ancestral populations around 1600 years before present and suggest that populations on Grande Comore and Mohéli represent the most contemporary divergences begining around 600–1000 years before present respectively. Furthermore, these phylogenetic trees support introductions into Anjouan from Mayotte and Mozambique, two introductions from Anjouan into Mohéli, and a single introduction from Mohéli into Grande Comore (Fig. 6).
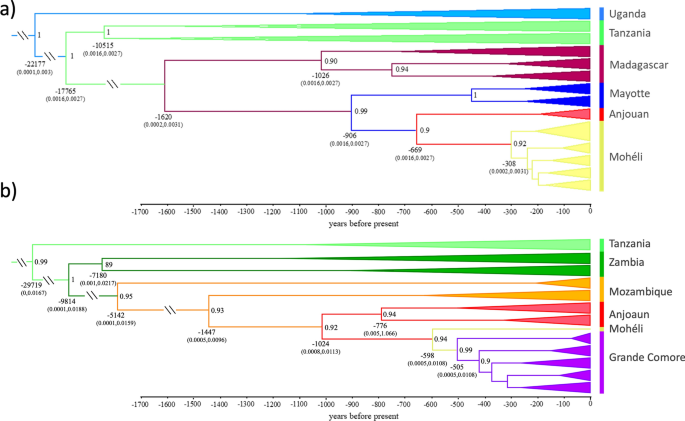
Divergence time estimates (x axis in years before present) of Anopheles gambiae populations from the oceanic islands, Madagascar, and mainland African populations calculated using the complete mitogenome coalescent model in BEAST2; outgroups not shown. (a) For the Malagasy clade. (b) For the Mozambican clade. Label colors correspond to haplotypes in Fig. 3. Posterior probability values > 0.9 are to the right of nodes, mean node ages are listed below nodes and the values within brackets are the 95% HPC intervals.
Discussion
Here we report the results of an analysis of the A. gambiae mitogenomes among populations sampled from six continental African countries, the island of Madagascar and the four islands comprising the Comoros archipelago. The results provide evidence for two independent A. gambiae clades going from West to East Africa and ultimately into the Comoros Islands.
This study expands on and refines our earlier work on the origins of A. gambiae in the Comoros archipelago11. Here we have increased the number of geographic locations sampled adding sites in Tanzania and including sites in Madagascar, Mayotte, Mozambique, and Uganda, not included in our earlier study (Fig. 1). The addition of these sites revealed the second route of A. gambiae introduction into the Comoros islands originating from Madagascar (Fig. 4b). Our findings agree with Schmidt et al.11 on the timeline for divergence of West and East African clades, but our results support a more recent timeline of A. gambiae dispersal into East Africa (Fig. 6). The difference between the timeline presented here and that of Schmidt et al.11 is likely to be the consequence of our use of mitochondrial, rather than nuclear DNA11,13. When interpreting results generated by analysis of mitochondrial (mtDNA) versus nuclear DNA it is important to consider how these genomes differ, e.g., in size, mutation rate, ploidy, recombination rates and number of introns14,15. However, despite their smaller size, mitochondrial genomes have proven useful to the evaluation of the ancestry and demographic history of populations16,17,18.
We identified multiple haplotypes, after removing singletons, on each of the Comoros Islands as well as Madagascar and Mozambique (Table 1, Fig. 4). Haplotypes clustered into two major clades, both sharing ancestry with populations in Mali (Fig. 2). We refer to these as the Malagasy clade and the Mozambican clade with reference to the immediate ancestors of A. gambiae populations in the Comoros archipelago. The small number of haplotypes on each island compared to populations of A. gambiae in mainland Africa and the absence of haplotype divergence among subpopulations within each island is consistent with a recent colonization of the Comoros islands resulting in the observed founder effect (population bottleneck) of A. gambiae as previously reported11.
Applying a molecular clock analysis, the initial introduction into the islands of the Comoros archipelago appears to have been from Madagascar into the island of Mayotte (1.6 Ka), subsequently into Anjouan (0.9 Ka) and then Mohéli (0.7 Ka). The Malagasy clade has not arrived in Grande Comore, or if it did it has become extinct. The Mozambican clade was introduced from the west slightly later, first into Anjouan Island (1.5 Ka), subsequently moving westward into Mohéli (1.0 Ka) and finally Grande Comore (0.6 Ka). The invasion of the Comoros Islands by A. gambiae is almost certainly anthropogenic. Historical records suggest that A. gambiae was introduced into Madagascar and Anjouan during the first major wave of human migration to the islands between 500–4000ya and 1000–1100ya respectively19,20,21,22. Interisland dispersal (Anjouan → Mohéli, and Mohéli → Grande Comore) coincides with the establishment of trade between islands (600–1000 ya) and the arrival of the Portuguese, around 1500AD4,22. The introduction of A. gambiae into Grande Comore is the most recent and its introduction occurred from unidirectional migration from East to West (Fig. 5b).
Lastly, this study supports earlier work suggesting that contemporary genetic exchange between mainland Africa or Madagascar and the Comoros Islands is limited, and that these islands are well-suited for field trials of genetically engineered mosquitoes for malaria eradication9.
Materials and methods
Sampling and DNA extraction
For this study we included both newly generated and publicly available mitochondrial genome sequence data of A. gambiae s.s. from the Comoros Islands (Anjouan, Grande Comore, Mayotte and Mohéli), Madagascar, and six continental African countries (Fig. 1, Supplementary Table S1). The new sample set included immature stages of A. gambiae collected from 2 localities in Anjouan, 11 in Grande Comore, 16 in Mohéli and 4 in Madagascar. These sequences were obtained from the UC Davis Vector Genetics Laboratory (VGL) archive and from the publicly available data from the Ag1000G database (AG1000G)23, accession numbers are provided in Supplementary Table S1. A total of 370 samples were included in our analyses. Samples from islands included: Anjouan, N = 17; Grande Comore, N = 86; Mayotte, N = 23; Mohéli, N = 132, Madagascar N = 17; and samples from continental African sites were Cameroon, N = 19; Mali, N = 17; Mozambique, N = 20; Tanzania N = 18; Uganda, N = 15; Zambia, N = 6.
Whole DNA from individual mosquito specimens from the VGL archive were extracted using our established protocol on a Qiagen Biosprint24. Species identification was conducted using species-specific SNPs included in the DIS assay25. Methods used for species identification, DNA extraction and genomic sequencing of individuals from the Ag1000G database were performed as described by AG1000G (2020)23.
Mitogenome sequencing and assembly
Individual library preparation was performed with 10 ng of genomic DNA as input and using KAPA HyperPlus Kit (Roche Sequencing Solutions, Indianapolis, Indiana, USA) following our protocol26. A dsDNA high sensitivity assay kit on a Qubit instrument (Thermo Fisher Scientific, Waltham, MA, USA) was used to quantify the initial input DNA. Library size selection (~ 500 bp) and clean-up were done with AMPure SPRI beads (Beckman Coulter Life Sciences, Indianapolis, Indiana, USA). Sequencing was performed on an Illumina HiSeq 4000 instrument at the UC Davis DNA Technologies Core facility for a pooled library of equal amounts of individual indexed libraries. Reads were demultiplexed and adapters were removed.
Raw-sequencing reads were used to assemble the mitochondria contig using NOVOPlasty version 2.6.727 with 33 as K-mer’s value and default settings. Samples from the Ag1000G were downloaded as binary alignment map (BAM) files from the European Nucleotide Archive (ENA). BAM files were converted to FastQ format using BEDTools28 which were then used for mitochondria assembly as described above.
Data analysis
De novo assembled mitochondrial genomes were imported into Geneious (2023.0.4) and aligned with a reference mitogenome sequence of Anopheles gambiae (NC_002084) acquired from GenBank. The alignment was visually inspected to confirm that no missing data, singletons, or polymorphic/ambiguities were present in the sequences. Genetic diversity indices such as nucleotide diversity (π) and haplotype diversity (Hd) were assessed for each geographic population using DnaSP 6.12.0329.
Phylogenetic analysis
The annotated mitogenome of A. gambiae reference was used to partition the aligned mitogenomes by coding region. A partition test of heterogeneity was conducted to determine if the complete mitogenome was appropriate to use for phylogenetic analysis, as implemented in PartitionFinder230. The best fitting models of evolution for each partition were determined using PartitionFinder2. The A. gambiae sequence was aligned with Anopheles mitogenome sequences A. melas (KT382823), A. merus (NC_028220), to use as outgroups for phylogenetic analyses using MAFFT v7.45031,32. Maximum likelihood (ML) and Bayesian inference (BI) analyses were conducted following the method in Ditter et al.33. An initial phylogeny was constructed using all available sequences, followed by a simplified phylogeny that included only individuals representing unique haplotypes from all localities (N = 135).
Haplotype networks and migration patterns
Unique haplotypes were identified and corrected for ambiguities and singletons using Poppr 2.0 and DnaSP 6.12.0329,34. A TCS haplotype network that included haplotypes was generated using POPArt 1.735,36. Individuals from mainland Africa that differed by > 30 mutations from Madagascar or Mozambique were removed from dispersal route haplotype networks.
Investigation of migration between the Comoro Islands, Madagascar and mainland Africa were conducted using a Bayesian approach compiled in Migrate-n v. 5.0.337,<a data-track="click" data-track-action="reference anchor" data-track-label="link" data-test="citation-ref" aria-label="Reference 38" title="Beerli, P. & Felsenstein, J. Maximum likelihood estimation of a migration matrix and effective population sizes in n subpopulations by using a coalescent approach. Proc. Natl. Acad. Sci. 98, 4563–4568.
https://doi.org/10.1073/pnas.081068098
(2001).” href=”https://www.nature.com/articles/s41598-023-44501-z#ref-CR38″ id=”ref-link-section-d358732135e1934″>38 on the University of California Davis Genome Center High Performance Computational Cluster. Parameters were estimated under a full migration model allowing for gene flow to occur among all populations and their most recent common ancestral populations and conducted using default parameters with 4 independent runs sampling every 200 steps for 200,000 recorded steps and a burn-in of 20,000. Comparison of migration models were conducted based on their marginal likelihood and probability using thermodynamic integration with Bezier approximation as implemented in Migrate-n39. Migration patterns inferred from Migrate-n analyses was visualized using the Migest package in R40.
Divergence time estimates
To reflect the dispersal of A. gambiae across Africa and into the Comoros Islands using a mitogenome-based timeline, phylogenetic trees were estimated. To this end, a multi-locus coalescent model was applied using BEAST2 v 2.6.741. Intraspecific divergence times were concurrently estimated using a substitution rate of 1.87 × 10⁻⁸ mutations per site per year, assuming a generation time of three weeks42,43. Analyses were performed in triplicate on the University of California Davis Genome Center High Performance Computational cluster with Markov chains for 100 million generations or until convergence, with the first 10% of generations of each discarded as burn-in and chains sampled every 10,000 generations. As indicated by results from PartitionFinder230 the HKY substation model was tested in combination with gamma site-specific rate variation and a proportion of invariant sites parameters and both a relaxed clock and a strict clock. A strict clock was selected over a relaxed clock by comparing the likelihood of results after 10,000,000 generation calibration runs. Tracer v1.7.2 was used to assess convergence of trees44. LogCombiner 2.6.7 was used to resample 10,000 subtrees from BEAST2 analyses, TreeAnnotator 2.6.4 was used to generate Maximum Clade Credibility trees using mean node heights, and FigTree 1.4.4 was used to visualize trees41,45.
Data availability
The datasets presented in this study can be found in online repositories. The names of the repository/repositories and accession number(s) can be found in Table S1. Newly sequence samples were deposited in NCBI GenBank under BioProject PRJNA971625.
References
-
Irish, S. R., Kyalo, D., Snow, R. W. & Coetzee, M. Updated list of Anopheles species (Diptera: Culicidae) by country in the Afrotropical Region and associated islands. Zootaxa 4747(3), 401–449. https://doi.org/10.1646/zootaxa.4747.3.1 (2020).
Google Scholar
-
Jacques, B. Les moustiques de l’archipel Comores. Série Entomologie Médicale et Parasitologie 15(2), 153–170 (1977).
-
Blanchy, S., Julvez, J. & Mouchet, J. Epidemiological stratification of malaria in the Comoro archipelago. Bull. Soc. Pathol. Exot. 92, 177–184 (1999).
Google Scholar
-
Chakir, I., Said, A. I., Affane, B. & Jambou, R. Control of malaria in the Comoro Islands over the past century. Malar. J. 16, 387. https://doi.org/10.1186/s12936-017-2027-1 (2017).
Google Scholar
-
Walker, P. G. T., Griffin, J. T., Ferguson, N. M. & Ghani, A. C. Estimating the most efficient allocation of interventions to achieve reductions in Plasmodium falciparum malaria burden and transmission in Africa: A modelling study. Lancet Global Health 4, e474–e484. https://doi.org/10.1016/s2214-109x(16)30073-0 (2016).
Google Scholar
-
Griffin, J. T. et al. Reducing Plasmodium falciparum malaria transmission in Africa: A model-based evaluation of intervention strategies. PLoS Med. https://doi.org/10.1371/journal.pmed.1000324 (2010).
Google Scholar
-
Carballar-Lejarazú, R. & James, A. A. Population modification of Anopheline species to control malaria transmission. Pathog. Glob. Health 111, 424–435. https://doi.org/10.1080/20477724.2018.1427192 (2017).
Google Scholar
-
James, S. et al. Pathway to deployment of gene drive mosquitoes as a potential biocontrol tool for elimination of malaria in sub-Aharan Africa: Recommendations of a scientific working group. Am. J. Trop. Med. Hyg. 98, 1 (2018).
Google Scholar
-
FNIH, W. Guidance Framework for Testing of Genetically Modified Mosquitoes Framework (2014).
-
Lanzaro, G. C. et al. Selection of sites for field trials of genetically engineered mosquitoes with gene drive. Evol. Appl. 14, 2147–2161. https://doi.org/10.1111/eva.13283 (2021).
Google Scholar
-
Schmidt, H. et al. Transcontinental dispersal of Anopheles gambiae occurred from West African origin via serial founder events. Commun. Biol. 2, 473. https://doi.org/10.1038/s42003-019-0717-7 (2019).
Google Scholar
-
Marsden, C. D. et al. An analysis of two island groups as potential sites for trials of transgenic mosquitoes for malaria control. Evol. Appl. 6, 706–720. https://doi.org/10.1111/eva.12056 (2013).
Google Scholar
-
Wolfe, J. M. et al. A phylogenomic framework, evolutionary timeline and genomic resources for comparative studies of decapod crustaceans. Proc. R. Soc. B Biol. Sci. 286, 20190079. https://doi.org/10.1098/rspb.2019.0079 (2019).
Google Scholar
-
IE, S. Mitochondria. (Wiley, UK, 1999).
-
Ballard, J. W. O. & Whitlock, M. C. The incomplete natural history of mitochondria. Mol. Ecol. 13, 729–744. https://doi.org/10.1046/j.1365-294X.2003.02063.x (2004).
Google Scholar
-
Avise, J. C. Mitochondrial DNA polymorphism and a connection between genetics and demography of relevance to conservation. Conserv. Biol. 9, 686–690. https://doi.org/10.1046/j.1523-1739.1995.09030686.x (1995).
Google Scholar
-
Avise, J. C. Molecular Markers, Natural History and Evolution (Springer, 1994).
Google Scholar
-
Timm, L. & Bracken-Grissom, H. D. The forest for the trees: Evaluating molecular phylogenies with an emphasis on higher-level decapoda. J. Crustacean Biol. 35, 577–592. https://doi.org/10.1163/1937240x-00002371 (2015).
Google Scholar
-
Dewar, R. E. & Wright, H. T. The culture history of Madagascar. J. World Prehist. 7(4), 417–466. https://doi.org/10.1007/bf00997802 (1993).
Google Scholar
-
Burney, D. A. et al. A chronology for late prehistoric Madagascar. J. Hum. Evol. 47(1–2), 25–63. https://doi.org/10.1016/j.jhevol.2004.05.005 (2004).
Google Scholar
-
Crowley, B. E. A refined chronology of prehistoric Madagascar and the demise of the megafauna. Quat. Sci. Rev. 29(19–20), 2591–2603 (2010).
Google Scholar
-
Cheke, A. The timing of arrival of humans and their commensal animals on Western Indian Ocean oceanic islands. Phelsuma 18, 38–69 (2010).
-
Consortium, A. G. G. Genome variation and population structure among 1142 mosquitoes of the African malaria vector species Anopheles gambiae and Anopheles coluzzii. Genome Res. 30, 1533–1546 (2020).
Google Scholar
-
Nieman, C. C., Yamasaki, Y., Collier, T. C. & Lee, Y. A DNA extraction protocol for improved DNA yield from individual mosquitoes. F1000Research 4, 1314. https://doi.org/10.12688/f1000research.7413.1 (2015).
Google Scholar
-
Lee, Y., Weakley, A. M., Nieman, C. C., Malvick, J. & Lanzaro, G. C. A multi-detection assay for malaria transmitting mosquitoes. J. Vis. Exp. 96, e52385. https://doi.org/10.3791/52385 (2015).
Google Scholar
-
Yamasaki, Y. K. et al. Improved tools for genomic DNA library construction of small insects. F1000Research https://doi.org/10.7490/f1000research.1111322.1 (2016).
Google Scholar
-
Dierckxsens, N., Mardulyn, P. & Smits, G. NOVOPlasty: De novo assembly of organelle genomes from whole genome data. Nucleic Acids Res. 45, e18. https://doi.org/10.1093/nar/gkw955 (2017).
Google Scholar
-
Quinlan, A. R. & Hall, I. M. BEDTools: A flexible suite of utilities for comparing genomic features. Bioinformatics 26, 841–842 (2010).
Google Scholar
-
Rozas, J. et al. DnaSP 6: DNA sequence polymorphism analysis of large data sets. Mol. Biol. Evol. 34, 3299–3302. https://doi.org/10.1093/molbev/msx248 (2017).
Google Scholar
-
Lanfear, R., Frandsen, P. B., Wright, A. M., Senfeld, T. & Calcott, B. PartitionFinder 2: New methods for selecting partitioned models of evolution for molecular and morphological phylogenetic analyses. Mol. Biol. Evol. 34, 772–773. https://doi.org/10.1093/molbev/msw260 (2016).
Google Scholar
-
Katoh, K., Misawa, K., Kuma, K. I. & Miyata, T. MAFFT: A novel method for rapid multiple sequence alignment based on fast Fourier transform. Nucleic Acids Res. 30, 3059–3066. https://doi.org/10.1093/nar/gkf436 (2002).
Google Scholar
-
Katoh, K. & Standley, D. M. MAFFT multiple sequence alignment software version 7: Improvements in performance and usability. Mol. Biol. Evol. 30, 772–780. https://doi.org/10.1093/molbev/mst010 (2013).
Google Scholar
-
Ditter, R. E. et al. Mitogenome analyses reveal limited introduction of anopheles coluzzii into the Central African Islands of São Tomé and Príncipe. Front. Trop. Dis. https://doi.org/10.3389/fitd.2022.855272 (2022).
Google Scholar
-
Kamvar, Z. N., Tabima, J. F. & Grünwald, N. J. Poppr: An R package for genetic analysis of populations with clonal, partially clonal, and/or sexual reproduction. PeerJ 2, e281. https://doi.org/10.7717/peerj.281 (2014).
Google Scholar
-
Clement, M., Snell, Q., Walke, P., Posada, D. & Crandall, K. in Proceedings 16th International Parallel and Distributed Processing Symposium. Pp. 7.
-
Leigh, J. W. & Bryant, D. popart: Full-feature software for haplotype network construction. Methods Ecol. Evol. 6, 1110–1116. https://doi.org/10.1111/2041-210X.12410 (2015).
Google Scholar
-
Beerli, P., Mashayekhi, S., Sadeghi, M., Khodaei, M. & Shaw, K. Population genetic inference with MIGRATE. Curr. Protoc. Bioinform. 68, e87. https://doi.org/10.1002/cpbi.87 (2019).
Google Scholar
-
Beerli, P. & Felsenstein, J. Maximum likelihood estimation of a migration matrix and effective population sizes in n subpopulations by using a coalescent approach. Proc. Natl. Acad. Sci. 98, 4563–4568. https://doi.org/10.1073/pnas.081068098 (2001).
Google Scholar
-
Beerli, P. & Palczewski, M. Unified framework to evaluate panmixia and migration direction among multiple sampling locations. Genetics 185, 313–326. https://doi.org/10.1534/genetics.109.112532 (2010).
Google Scholar
-
Abel, G. J. & Sander, N. Quantifying global international migration flows. Science 343, 1520–1522. https://doi.org/10.1126/science.1248676 (2014).
Google Scholar
-
Bouckaert, R. et al. BEAST 2.5: An advanced software platform for Bayesian evolutionary analysis. PLoS Comput. Biol. 15(4), e1006650 (2019).
Google Scholar
-
Rashid, I. et al. Spontaneous mutation rate estimates for the principal malaria vectors Anopheles coluzzii and Anopheles stephensi. Sci. Rep. 12, 226. https://doi.org/10.1038/s41598-021-03943-z (2022).
Google Scholar
-
Jones, C. M. et al. Complete Anopheles funestus mitogenomes reveal an ancient history of mitochondrial lineages and their distribution in southern and central Africa. Sci. Rep. 8, 9054. https://doi.org/10.1038/s41598-018-27092-y (2018).
Google Scholar
-
Rambaut, A., Drummond, A. J., Xie, D., Baele, G. & Suchard, M. A. Posterior summarization in Bayesian phylogenetics using tracer 1.7. Syst. Biol. 67, 901–904. https://doi.org/10.1093/sysbio/syy032 (2018).
Google Scholar
-
Drummond, A. J. & Rambaut, A. BEAST: Bayesian evolutionary analysis by sampling trees. BMC Evolut. Biol. 7, 214 (2007).
Google Scholar
Acknowledgements
We thank the National Malaria Control Program personnel from the Union of the Comoros for facilitating field collections in the islands. We thank the team of the Medical Entomology Unit of the Institut Pasteur de Madagascar for collecting and processing specimens from Madagascar.
Funding
This work was supported by grants from the UC Irvine Malaria Initiative Program (A17- 0209) and Open Philanthropy (A20-3521).
Author information
Authors and Affiliations
Contributions
R.E.D., M.C. design the experiment, methodology, formal analysis. A.J.C., Y.L., M.W.C., Y.A., A.T., L.M.T., R.G. sample collection, processing, and sequencing. G.C.L. supervision and project administration. R.E.D., M.C. writing—original draft preparation. M.C., M.W.C., Y.L., A.J.C., G.C.L. writing—review and editing. All authors have read and agreed to the published version of the manuscript.
Corresponding author
Ethics declarations
Competing interests
The authors declare no competing interests.
Additional information
Publisher’s note
Springer Nature remains neutral with regard to jurisdictional claims in published maps and institutional affiliations.
Supplementary Information
Supplementary Information.
Rights and permissions
Open Access This article is licensed under a Creative Commons Attribution 4.0 International License, which permits use, sharing, adaptation, distribution and reproduction in any medium or format, as long as you give appropriate credit to the original author(s) and the source, provide a link to the Creative Commons licence, and indicate if changes were made. The images or other third party material in this article are included in the article’s Creative Commons licence, unless indicated otherwise in a credit line to the material. If material is not included in the article’s Creative Commons licence and your intended use is not permitted by statutory regulation or exceeds the permitted use, you will need to obtain permission directly from the copyright holder. To view a copy of this licence, visit http://creativecommons.org/licenses/by/4.0/.
Reprints and Permissions
About this article
Cite this article
Ditter, R.E., Campos, M., Crepeau, M.W. et al. Anopheles gambiae on remote islands in the Indian Ocean: origins and prospects for malaria elimination by genetic modification of extant populations.
Sci Rep 13, 20830 (2023). https://doi.org/10.1038/s41598-023-44501-z
-
Received: 29 June 2023
-
Accepted: 09 October 2023
-
Published: 27 November 2023
-
DOI: https://doi.org/10.1038/s41598-023-44501-z
Comments
By submitting a comment you agree to abide by our Terms and Community Guidelines. If you find something abusive or that does not comply with our terms or guidelines please flag it as inappropriate.