
Washington, DC—The arts and cultural sector grew at more than twice the rate of the total economy between 2022 and 2023, according to new data from the Arts and Cultural Production Satellite Account (ACPSA), a product of the National Endowment for the Arts and the Bureau of Economic Analysis (BEA).
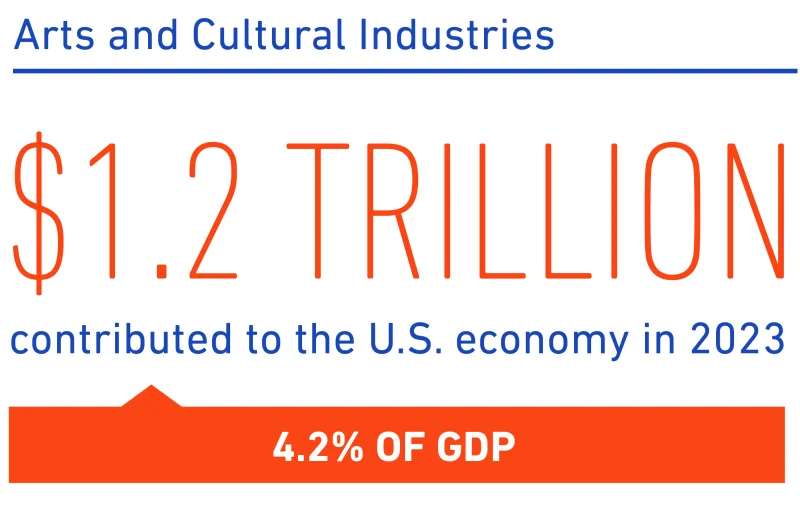
ACPSA tracks the annual economic value of arts and cultural production from 35 industry groups—including both commercial and nonprofit entities. In 2023, the most recent year for which data are available, arts and culture again surpassed its annual value added to the U.S. economy with $1.2 trillion, representing 4.2 percent of the nation’s GDP. Most of the arts and cultural industries have exceeded their pre-pandemic numbers for value added; however, several are at or below their 2019 levels.
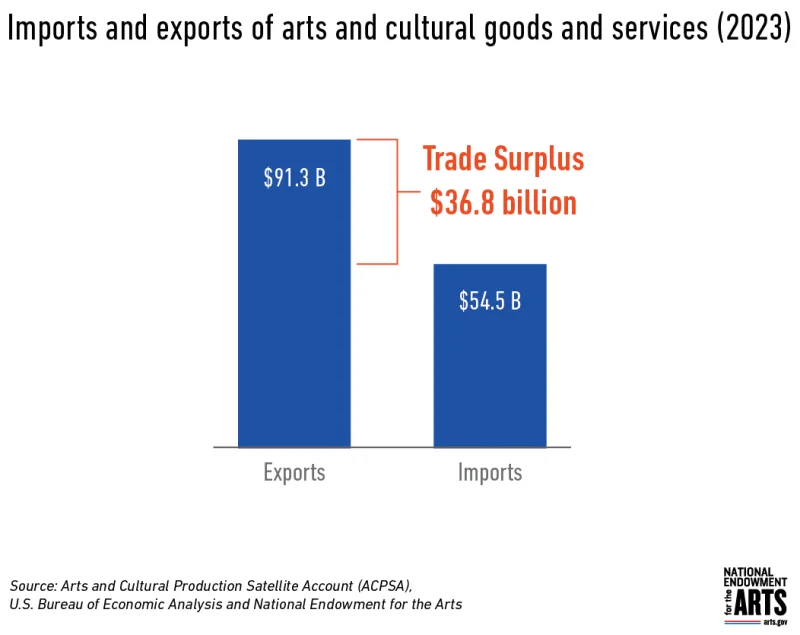
Beyond its contributions to GDP, the arts sector has yielded a growing trade surplus for the U.S. In 2023, the total value of the nation’s arts exports was nearly $37 billion greater than the value of arts imports from other countries.
National Highlights
- The real value added by arts and culture (i.e., in inflation-adjusted dollars) has doubled over a 25-year period. As in previous years, the arts added more to U.S. GDP than did the sectors of agriculture, forestry, fishing, and hunting; mining; outdoor recreation; and transportation and warehousing.
- The nation’s largest arts industry in 2023 was web publishing and streaming, which includes internet publishing and broadcasting, music and film archives, comic syndicates, and news photo distribution services. Other large arts industries by value to GDP include broadcasting, government services (including arts education in public schools), traditional and software publishing, and motion picture and video industries.
- By 2023, most arts and cultural industries were restored to or exceeded pre-pandemic levels of economic activity, with 27 out of 35 arts industries posting amounts above 2019 levels. This includes the value added by performing arts presenters and agents and managers.
- However, the value to GDP of independent artists, writers, and performers was roughly on par with the 2019 level, though it represented a decrease from the 2022 level.
- Performing arts organizations—which took a bigger hit from the 2020 recession than did many other industries—grew 31.6 percent between 2022 and 2023 but remained 12.3 percent below the 2019 level in value added.
- Six arts industries saw substantial declines between 2019 and 2023—custom architectural woodwork and metalwork manufacturing, printed goods manufacturing, rental and leasing, arts-related construction, museums (non-government), and arts facility construction firms. Each of these industries shed more than 10 percent of its economic value.
- Employment in the arts and cultural industries has increased, with nearly 5.4 million workers in 2023. More than half of industries had higher employment levels in 2023 than in 2019. Computer systems design showed the largest percentage growth over this period, followed by theatrical ticket agencies and web publishing and streaming. Ten arts industries employed fewer workers in 2023 than in 2019, including some manufacturing and audio/video industries. (Note: In its employment figures, the ACPSA does not count self-employed arts and cultural workers who retain no staff on payroll.)
- The ACPSA also tracks arts and cultural exports, which have continued to grow since 2020. The trade surplus rose from $21.5 billion to $36.8 billion between 2022 and 2023 (not adjusted for inflation), surpassing 2019 levels.
- Among the top imports in 2023 were jewelry and silverware, audio/visual production services for TV and movies, and other manufactured goods such as glass and china.
- The leading arts export commodities included information services such as audio/visual production for TV and movies, creative advertising, and arts-related software publishing.
State Highlights
- Over the five-year period from 2019 through 2023, all states saw increases in value added from arts and culture, with Arizona, South Carolina, Connecticut, North Carolina, and Tennessee showing the largest percent increases during this time. Between 2022 and 2023, all but three states experienced an increase in value added, with Nevada, Oklahoma, North Carolina, Tennessee, and Oregon showing the largest gains.
- Looking at employment levels, 23 states had reached or surpassed pre-pandemic (2019) employment levels in the arts in 2023, with largest percent gains in South Carolina, North Carolina, Utah, Alabama, and Florida. Between 2022 to 2023, 27 states saw arts employment levels grow or hold steady, with the largest percent gains in North Carolina, Arkansas, Oregon, Alabama, Florida, and Indiana.
NEA Director of Research & Analysis Sunil Iyengar said, “The Arts and Cultural Production Satellite Account is a key resource in demonstrating the sheer economic power of the arts, and in acknowledging the breadth of industries that make up this sector. While many arts and cultural industries have regained pre-pandemic levels of economic value, some are still struggling to return to their 2019 levels.”
National and state-level summary reports are both available at arts.gov, alongside interactive graphics that show the economic value and growth of different arts and cultural industries and the economic and employment impact of the arts in different states.
For information on specific states, BEA has available Arts and Cultural Production Satellite Account fact sheets for each state. In addition, the National Assembly of State Arts Agencies (NASAA), in partnership with the NEA, has created an interactive dashboard with information on value added to state economies through arts and cultural production, as well as employment and compensation figures for the creative workforce.