Abstract
Land-use change such as the conversion of natural habitat to agricultural land has been a major driver of global biodiversity loss, prompting efforts at biodiversity restoration. However, restoration measures in certain areas can shift the detrimental biodiversity impacts elsewhere through the outsourcing of agri-food supply chains to biodiverse regions. This study examines the link between biodiversity impacts from land-use change and shifts in global supply chains from 1995 to 2022 by introducing a marginal allocation into multiregional input–output analysis. Almost 80% of recent global land-use change impacts were associated with increased agri-food exports from Latin America, Africa and Southeast Asia + Pacific (excluding China). Conversely, increased imports to China, the United States, Europe and the Middle East accounted for almost 60% of recent global land-use change impacts from a consumption perspective, despite decreasing domestic impacts through restoration. Decreasing biodiversity impacts in temperate and arid regions have been partially achieved by outsourcing agri-food supply to tropical biodiversity hotspots. This results in a cumulated global extinction rate (1.4% global potential species loss since 1995), exceeding the planetary boundary by about fifty times, thus highlighting the need for policies incentivizing habitat protection in tropical regions and sustainable sourcing in agri-food supply chains.
Main
Land use is the primary driver of biodiversity loss with extinction rates higher than ever1,2,3. This primarily stems from converting natural habitats to agricultural land. Notable regions experiencing habitat destruction are concentrated in tropical regions, where land is also used for producing commodities exported and consumed abroad4,5. While land-use changes can lead to a decrease in biodiversity impacts, as observed in Europe through restoration measures6, it is crucial to avoid exacerbating impacts elsewhere through outsourcing agri-food supply chains to biodiversity hotspots. Key actions include: (1) assessing biodiversity impacts resulting from land-use changes globally with high spatial resolution and (2) identifying how shifts in supply and demand over time contribute to these impacts.
Environmentally extended multiregional input–output (MRIO) analysis is a top-down approach in life-cycle assessment (LCA) that breaks down the global economy into sectors and regions, recording monetary flows and environmental accounts such as biodiversity impacts of land-use change, and allows tracking of these impacts from producers to consumers of goods. The global potential species loss (PSLglo) indicator, recommended by UNEP-SETAC7,8,9, estimates the proportion of global species that may become extinct due to habitat conversion. It calculates ecoregion10-level extinctions using the countryside species–area relationships11 for five taxonomic groups8 and weights them with a factor considering species endemism and IUCN threat-level scores12. This factor approximates the probability that species lost in an ecoregion lead to global extinctions. Integrating PSLglo into MRIO analysis enables decision-makers to understand the potential impact of their activities on biodiversity and promote sustainable practices throughout supply chains.
However, limitations include limited spatial resolution, poor data quality for many countries with high endemic species richness and outdated time series2,13,14,15,16,17. Previous studies also assumed that biodiversity of abandoned habitat equals that of primary habitat, neglecting increased biodiversity impacts from primary habitat conversion and subsequent abandonment (that is, just net changes of human land use were considered). Moreover, MRIO studies allocated biodiversity impacts to total supply and demand, similar to attributional LCA that assesses the average impacts of a product or process18. However, they did not examine how land-use change impacts relate to shifts in supply and demand, as done in a marginal allocation to analyse which changes over time lead to a better or worse outcome compared with the baseline year19,20. While marginal allocation is also used in consequential LCA18, it has not been introduced to MRIO yet.
This study addresses these research gaps by: (1) assessing spatially resolved global biodiversity impacts resulting from land-use conversions between 1995 and 2022 and (2) identifying how shifts in supply chains contribute to these impacts over time. We combine the Land-Use Harmonization 2 (LUH2) dataset21,22,23, providing global land conversions from 1995 to 2022, with ecoregion10-specific global species loss factors from UNEP-SETAC8,9. This allows us to assess both increases in biodiversity impacts from natural habitat conversion (for example, deforestation or other natural habitat conversion for agriculture) and decreases in biodiversity impacts from restoration measures6 (for example, reforestation or abandonment of agricultural land) at a high spatial resolution (15 min-arc resolution, ~28 km). We account for the reduced quality of secondary habitats by assigning higher biodiversity impacts to land converted from primary habitats than to decreases from land abandonment. We integrate this regionalized impact assessment into Resolved EXIIOBASE3 (refs. 14,16,24) (REX3 (ref. 25)), a highly resolved MRIO database (189 countries × 163 sectors) and introduce a marginal allocation19,20 to better understand the dynamic relationship between shifts in global supply chains and recent land-use change impacts26.
Results
Hotspots of global biodiversity impacts from land-use change
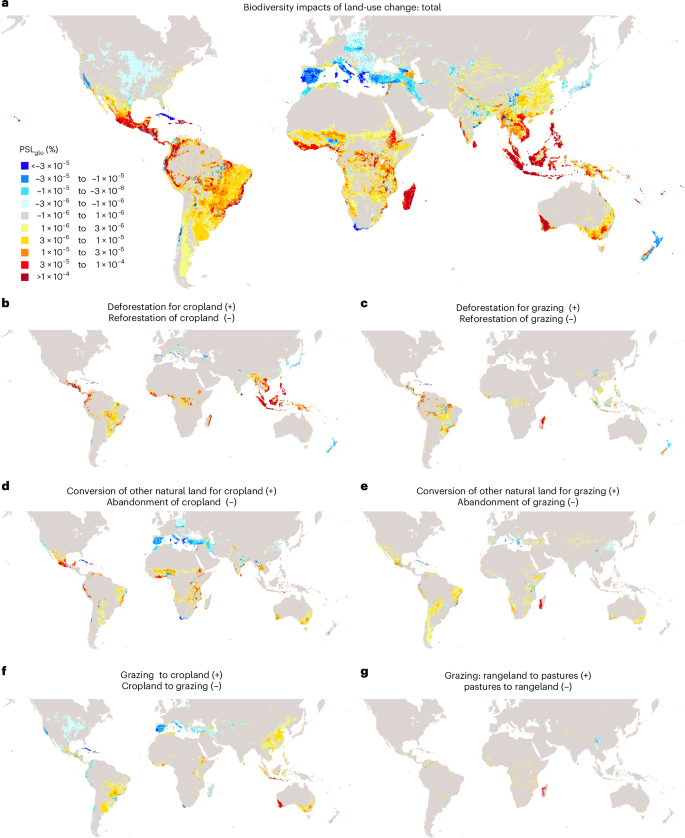
Figure 1a illustrates the total increases and decreases in biodiversity impacts resulting from land-use change from 1995 to 2022, while Fig. 1b–g and Extended Data Fig. 1 detail these changes by land conversion types. Positive values refer to increases in biodiversity impacts through deforestation, other natural habitat conversion and conversion of grassland to cropland. By contrast, negative values refer to decreases in biodiversity impacts through reforestation, abandonment of agricultural land, or conversion of cropland to grassland. Our findings reveal substantial increase in biodiversity impacts due to deforestation and natural land conversion, particularly in tropical regions27. In Latin America, hotspots of increasing impacts include eastern Brazil and the Amazonas region, western Colombia, southern Mexico and the Caribbean (for example, Belize, Guatemala, Haiti). In Africa, biodiversity impacts have increased in Madagascar, Ethiopia, the Democratic Republic of the Congo and West Africa (for example, Ghana, Ivory Coast, Liberia and Sierra Leone). In Southeast Asia and the Pacific, biodiversity impacts have most pronounced increases in Indonesia, the Philippines, Vietnam, Malaysia and Southwest Australia (Fig. 1a). Overall, the cumulative increase in biodiversity impacts due to land-use change amounts to 1.5% PSLglo since 1995, representing the sum of all increases in biodiversity impacts depicted in Fig. 1a. This suggests that 1.5% of global species are committed to extinction due to land-use change, with Southeast Asia and the Pacific (38%), Latin America and the Caribbean (36%) and Africa (23%) accounting for over 98% of these impacts.

a, Total. b–g, Split by land conversion at 15 min-arc resolution (~28 km). Conversion to urban land use is included in a, but separately shown in Extended Data Fig. 1. Land conversion data are taken from the LUH2 dataset21,22,23. Biodiversity impacts are assessed in percentages of global potential species loss (PSLglo) on the basis of ecoregion10-specific impact factors from UNEP-SETAC8,9. Positive percentages refer to increases in biodiversity impacts, while negative values refer to decreases in biodiversity impacts.
Conversely, reforestation, the abandonment of agricultural land and the conversion of cropland into rangeland have decreased biodiversity impacts, particularly in temperate and arid northern hemisphere regions (Fig. 1), which is in accordance with previous studies28,29. Hotspots of decreasing biodiversity impacts include Spain, Italy, Greece, the United States, Turkey, Iran, Russia, Kazakhstan, Georgia and Japan, as well as South Africa, Chile and New Zealand in the southern hemisphere. Our assessment reveals that also a few regions in the tropical regions have experienced decreases in biodiversity impacts. This includes Cuba and Nigeria, mainly due to reforestation measures, the abandonment of cropland and the conversion of cropland into rangeland. Overall, decreases in biodiversity impacts account for –0.11% PSLglo since 1995, representing the sum of all negative values in Fig. 1a. More than two-thirds of these decreased impacts have occurred in Europe, North America, Northwest Asia and the Middle East.
Combining both increases (1.5% PSLglo) and decreases (–0.11% PSLglo), net global biodiversity impacts resulting from land-use change have increased by 1.4% PSLglo from 1995 to 2022 (Fig. 1). This implies an additional 1.4% of global species are committed to extinction, as decreases in biodiversity impacts due to nature restoration measures, mostly in temperate and arid zones, were far exceeded by increases in biodiversity impacts due to deforestation and other natural habitat destruction, mostly in tropical regions. Nearly two-thirds of the global net biodiversity impacts have occurred in tropical regions. Four countries—Indonesia (22%), Brazil (11%), Madagascar (10%) and Mexico (8%)—account for half of global biodiversity losses through land-use change from 1995 to 2022. While deforestation for rice and oilseed cultivation drove biodiversity impacts in Indonesia, deforestation and other natural land conversion for animal farming contributed most to the increased biodiversity loss in Brazil and Madagascar. For Mexico, the conversion of natural land into cropland, mostly for vegetable, fruit and nut production, was the main cause of biodiversity loss. Overall, more than 90% of global biodiversity impacts of land-use change are due to agriculture, with crops cultivation (72%) and pastures (21%) being the main contributors, while mining, other industries and urban infrastructure have minor impacts. Forestry products are not considered here, as agriculture is the primary driver of deforestation, while timber is typically a by-product30.
Land-use change impacts driven by shifts in the supply chain
Figure 2 illustrates the temporal evolution of cumulated biodiversity impacts resulting from land-use change from different perspectives, including the different types of (a) land converted, (b) sectors using the land after conversion, (c) producer regions where conversion happened and (d) consumer regions of produced goods. The perspective of consumer regions includes the impacts caused abroad due to imports, but excludes domestic impacts of exported goods. The figure highlights countries contributing over 5% to global land conversion impacts and aggregates the remaining countries into main world regions (Extended Data Fig. 2). Figure 3 illustrates the global supply chain, connecting regions of land conversion, predominantly for agriculture, with increases and decreases in consumption of goods either domestically or abroad due to international trade. The net potential species loss of 1.4% PSLglo from 1995 to 2022, as shown in Fig. 2a–e, equals the sum of increases and decreases depicted in Fig. 3a–e. Using a marginal allocation framework, Fig. 3a–e illustrate shifts in the global supply chain, connecting changes in supply and demand with corresponding increases or decreases in biodiversity impacts. These increases and decreases in impacts are compared to the net global land-use change impact of 1.4% PSLglo. Further results are shown in Extended Data Figs. 3–8.
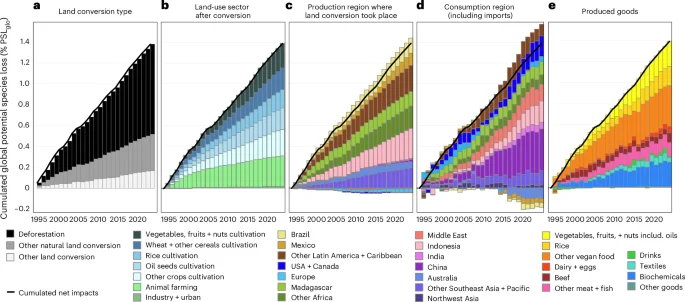
a–e, Different types of (a) land lost through conversion, (b) land-use sectors after conversion, (c) production regions where conversion has happened, and (d) consumption regions of (e) produced goods. Positive percentages refer to increases in biodiversity impacts, while negative values refer to decreases in biodiversity impacts. The global cumulated net biodiversity impact amounts to 1.4% PSLglo from 1995 to 2022 and is shown by the black line. The figure highlights countries contributing over 5% to global land conversion impacts, through production or consumption, and aggregates the remaining countries into main world regions (Extended Data Fig. 2). Further results on the temporal evolution of the biodiversity impacts from land use (in total) and land-use change are shown in Extended Data Figs. 3–6. A division by income and HDI group is shown in Extended Data Figs. 7 and 8.
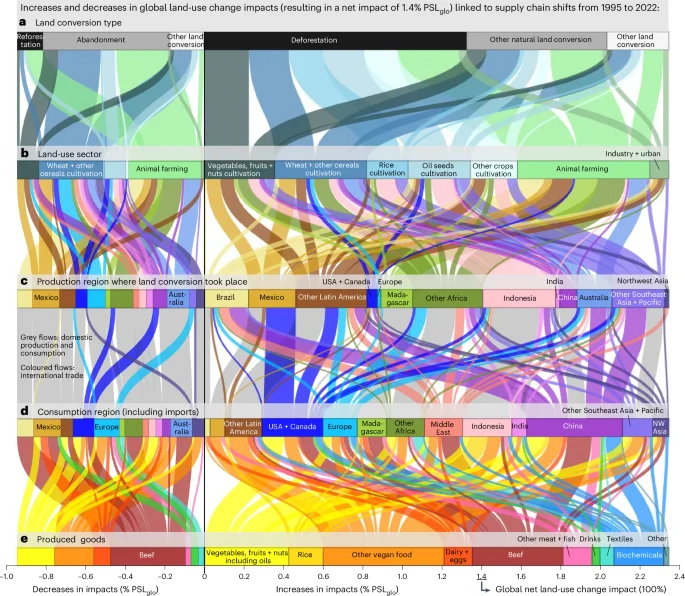
a–e, The resulting net impact of 1.4% PSLglo is linked to shifts in the global supply chain shown from different perspectives, including the different types of (a) land converted, (b) land-use sectors before conversion (decreases) and after conversion (increases), (c) production regions where conversion has happened, and (d) the consumption regions of (e) produced goods. NW, northwest. Increases in biodiversity impacts (for example, through deforestation and other natural habitat conversion) are linked to increased consumption (positive percentages), while decreases in biodiversity impacts (for example, through reforestation and other natural restoration measures) are associated with decreased consumption (negative percentages). The sum of increases and decreases depicted in a–e equals the net biodiversity impact of 1.4% global potential species loss from 1995 to 2022 shown in Fig. 2a–e for the same perspectives, and is referred to as 100% in the text. The figure shows all countries that contribute to >5% of global land conversion impacts, whether through production or consumption, and aggregates the remaining countries into the main world regions (Extended Data Fig. 2). Further in-depth analysis for land conversion impacts in Brazil, Mexico and Indonesia is shown in Figs. 4, 5 and 6, respectively.
Our findings indicate that most land-use change biodiversity impacts in tropical regions are linked to increases in international trade in agri-food products (Figs. 2c,d and 3c,d). Adding up all land-use change impacts attributed to shifts in international trade results in a net increase of 1.3% PSLglo from 1995 to 2022, meaning that over 90% of global net land-use change impacts are embodied in increased international trade of agri-food products (Supplementary Data 3, ‘SI_Results.xlsx: trade within 189 countries’). More than 60% of net land-use change impacts are attributed to increased imports to affluent countries31 from less affluent ones. The main exporters are Latin America, Africa, and Southeast Asia + Pacific (excluding China and India). Almost 80% of global net land-use change impacts are related to increased exports of agri-food products from Latin America + the Caribbean (37%), Southeast Asia + Pacific (28%) and Africa (14%) (Supplementary Data 3, ‘SI_Results.xlsx: Figure_3’). Vice versa, China, the United States, the Middle East and Europe are the main consumers of increased imports from these biodiversity hotspots. Almost two-thirds of global net land-use change impacts are associated with increased imports to China (26%), the United States (16%), the Middle East (13%) and Europe (8%). Conversely, reduced consumption of domestically produced goods has contributed to decreases in biodiversity impacts through nature restoration measures in these regions. This means that domestic agricultural products in temperate and arid northern hemisphere zones have been increasingly substituted by imports from Latin America, Africa, and Southeast Asia + Pacific, intensifying biodiversity impacts through deforestation and habitat conversion in tropical regions.
In Latin America + the Caribbean, hotspots of increasing biodiversity impacts due to exports include Brazil and Mexico, and several other countries in tropical regions such as Colombia, Peru and Ecuador. Over a quarter of global net land-use change impacts are related to increased agri-food exports from Brazil and Mexico (Fig. 3b,c). Figure 4 demonstrates that Brazil’s land-use change impacts, mainly driven by deforestation of primary forests, are primarily linked to increased exports of beef, but also feed, other food products and feedstock for biochemicals. Notably, 70% of Brazil’s net land-use change impacts are associated with increased beef exports, while another 15% is related to enhanced feedstock exports for biochemicals, such as biofuels and bioplastics. The main consumers of these increased exports are China, the Middle East and Europe: over half of Brazil’s land-use change impacts are attributed to additional consumption by China, one-third is associated with additional consumption by the Middle East (particularly Iran, Saudi Arabia and Turkey), and 10% is linked to increased consumption by Europe. Conversely, increased consumption by the United States has driven land-use change impacts in Mexico, primarily through increased imports of vegetables, fruits, nuts, beef, sugar and beverages (Fig. 5). More than 70% of the net land-use change impacts associated with the United States’ increased consumption are attributed to increased imports from Mexico.
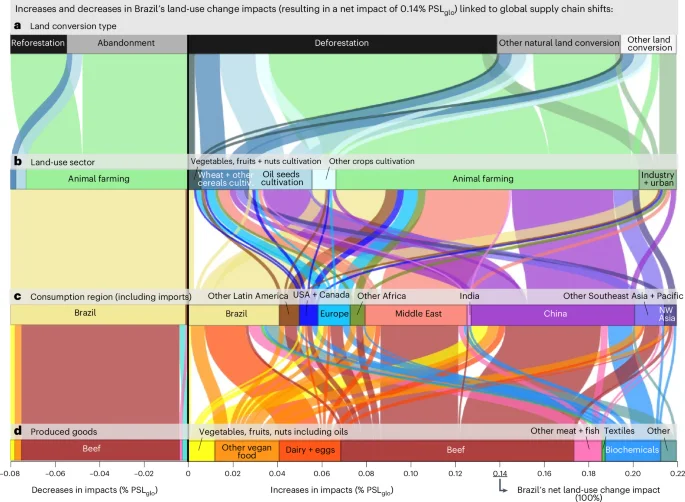
a–d, The resulting net impact of 0.14% PSLglo is linked to the shifts in the global supply chain shown from different perspectives, including the different types of (a) land converted, (b) land-use sectors before conversion (decreases) and after conversion (increases), and (c) the consumption regions of (d) produced goods. Increases in impacts (for example, through deforestation and other natural habitat conversion) are linked to increased consumption (positive percentages), while decreases in impacts (for example, through reforestation and other natural conservation measures) are associated with decreased consumption (negative percentages). The sum of the increases and decreases equals the net biodiversity impact of 0.14% PSLglo from 1995 to 2022 shown in Fig. 2b for Brazil’s domestic impacts, and is referred to as 100% in the text.
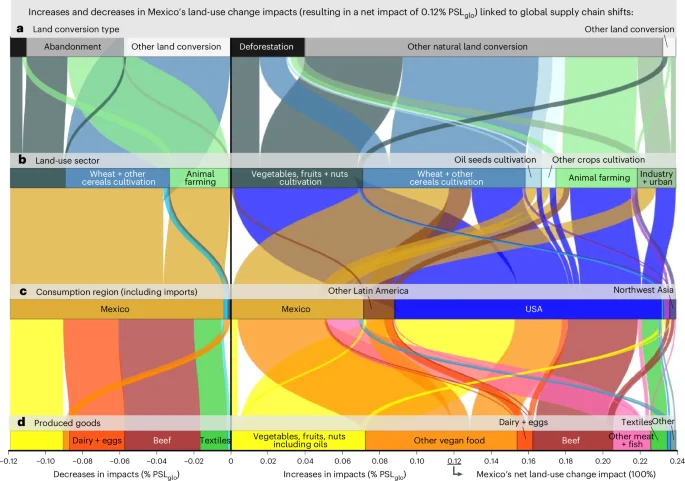
a–d, The resulting net impact of 0.12% PSLglo is linked to the shifts in the global supply chain shown from different perspectives, including the different types of (a) land converted, (b) land-use sectors before conversion (decreases) and after conversion (increases), and (c) the consumption regions of (d) produced goods. Increases in impacts (for example, through deforestation and other natural habitat conversion) are linked to increased consumption (positive percentages), while decreases in impacts (for example, through reforestation and other natural conservation measures) are associated with decreased consumption (negative percentages). The sum of the increases and decreases equals the net biodiversity impact of 0.12% PSLglo from 1995 to 2022 shown in Fig. 2b for Mexico’s domestic impacts, and is referred to as 100% in the text.
Outsourcing agri-food supply chains to tropical regions has led to decreased biodiversity impacts in many temperate and arid northern hemisphere countries (for example, Spain, Italy, Greece, the United States, Turkey, Iran, Russia, Kazakhstan, Georgia) but increased impacts from a consumption perspective by importing goods from tropical regions. Conversely, tropical regions exhibit the opposite trend of increased domestic biodiversity impacts and reduced consumption-based impacts. In Brazil, land-use change impacts from consumption have decreased due to declining domestic beef consumption (Fig. 2d). This is attributed to Brazil’s increase in land productivity: since 1995, Brazil’s beef production has outpaced the expansion of land use for cattle farming, leading to a reduced biodiversity impact from land-use change per unit of produced beef. This has offset the overall increase in Brazil’s beef consumption32, resulting in a declining land-conversion biodiversity footprint. This decline is evidenced by a decrease in impacts through reforestation and the abandonment of rangeland (Fig. 4). Consequently, biodiversity impacts have decreased in Brazil from a consumption perspective (Fig. 2d). However, increased agri-food exports have led to a net increase in land-conversion impacts (Fig. 4), reflecting the substantial increase of exports between 1995 and 2022. A similar pattern is observed for Mexico (Supplementary Results 1 and Fig. 5).
In Africa, land-use change impacts are influenced by the increased production of goods for domestic consumption in certain countries such as Madagascar and the Democratic Republic of the Congo. However, in most African countries, including South Africa, Ethiopia, Tanzania and Nigeria, land-use change impacts are driven by increased exports. For example, South Africa exhibits a similar pattern to Brazil: impacts have decreased from a consumption perspective due to reduced domestic beef consumption, but increased from a production perspective due to increased exports of beef, other food products and feedstock for biochemicals. Similarly, land-use change impacts in Ethiopia and Nigeria are mainly associated with increased beef exports, while impacts in Tanzania are predominantly related to increased exports of vegetables, fruits, nuts, cereals and crops for biochemicals. The key destinations for Africa’s increased exports vary depending on the commodity and include Europe, the Middle East, China and India. For instance, increased exports to Europe are dominated by beef mostly from South Africa, Nigeria and Namibia, as well as spices from Madagascar. Increased exports to the Middle East are dominated by beef and dairy products from Ethiopia and Nigeria, with key consumers being Egypt, Saudi Arabia and the United Arab Emirates. Overall, 75% of the land-use change impacts in Africa can be attributed to increased exports (Fig. 3c,d).
In Southeast Asia + Pacific, land-use change impacts vary by country due to both increased domestic consumption and exports. In Indonesia, 25% of the domestic impacts are related to increased exports, while 75% are associated with increased domestic consumption (Fig. 3c,d). This has led to increased land-use change impacts both domestically and from a consumption perspective in Indonesia (Fig. 2c,d), driven by population growth and increased consumption of predominantly rice and other vegan food products. Therefore, Indonesia’s consumption-based impacts are primarily from domestic vegan food products, unlike regions such as the Middle East, where impacts are driven by increased beef and dairy imports (Fig. 3d,e). The impacts related to Indonesia’s increased exports are primarily linked to oilseeds such as palm oil, used for food and as feedstock for biochemicals (Fig. 6). Indonesia’s increased oilseeds exports account for 5% of global land-use change impacts, with China, India, the United States and Europe being the main consumers.
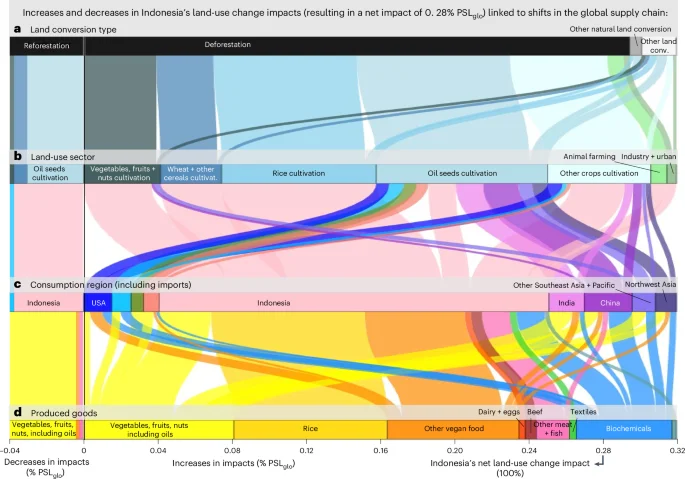
a–d, The resulting net impact of 0.28% PSLglo is linked to the shifts in the global supply chain shown from different perspectives, including the different types of (a) land converted, (b) land-use sectors before conversion (decreases) and after conversion (increases), and (c) the consumption regions of (d) produced goods. Increases in impacts (for example, through deforestation and other natural habitat conversion) are linked to increased consumption (positive percentages), while decreases in impacts (for example, through reforestation and other natural conservation measures) are associated with decreased consumption (negative percentages). The sum of the increases and decreases equals the net biodiversity impact of 0.28% PSLglo from 1995 to 2022 shown in Fig. 2b for Indonesia’s domestic impacts, and is referred to as 100% in the text.
Australia exhibits a similar pattern as Brazil and South Africa: from a consumption perspective, impacts have decreased due to reduced domestic beef consumption (Fig. 3d,e). However, from a production perspective, impacts have increased due to increased exports (Fig. 3b,c). These exports predominantly include beef, other food products and feedstock for biochemicals, with China being the primary destination. China’s increased imports account for over a quarter of global land-use change impacts, with almost half related to imports from Australia and Brazil, and the rest from other Southeast Asian + Pacific countries. Therefore, China’s consumption has driven land-use change impacts in several Southeast Asian + Pacific countries, including Malaysia, Thailand, Myanmar, Vietnam and the Philippines. More than half of the impacts in these countries are associated with increased exports to China, primarily involving vegetables, fruits, nuts, rice and feedstock for biochemicals (see Supplementary Results 2 for further results on biochemicals).
Discussion
Comparison with literature
This study provides a comprehensive assessment of global land-use change biodiversity impacts from 1995 to 2022 and identifies how shifts in the global agri-food supply chain contribute to these changes using a marginal allocation, making it presumably the first of its kind. Similar to previous studies on deforestation33,34, our results show that most cropland-related impacts are caused in Southeast Asia + Pacific, while Latin America (especially Brazil) is a hotspot in pasture-related land-use change impacts. However, Africa’s contribution to pasture-related impacts is higher compared with previous studies33,34 due to the high species loss factor9 applied here for Madagascar. Moreover, previous studies indicated decreasing biodiversity impacts in Europe and North America from both production and consumption perspectives2,15,16,35,36, while our study reveals an increase in consumption-based biodiversity impacts in these regions due to outsourcing agri-food supply chains to tropical biodiversity hotspots. This discrepancy is attributed to several methodological improvements:
-
(1)
Enhanced land-use change impact assessment: We incorporate spatially resolved data on land conversion from the LUH2 dataset21,22,23 and consider biodiversity impacts8,9,10 related to primary habitat conversion to agriculture followed by abandonment. In contrast, previous studies relied on national net changes in land-use area2,15,35, assuming abandoned areas would restore biodiversity to original levels, thus underestimating biodiversity impacts. For instance, while the net pasture area in Brazil has remained relatively stable37, our assessment reveals substantial biodiversity impacts due to natural habitat conversion followed by abandonment. This effect is substantial not only for Brazil but also globally, leading to a 40% higher global land-use change impact (1.4% PSLglo versus 1.0% PSLglo; Extended Data Figs. 3 and 4 and Supplementary Discussion 1)21,22,23, as a substantial part of global land-use change involves the conversion of natural land for agriculture followed by abandonment (Extended Data Fig. 9). Consequently, the annual rates in land-use change impacts reported here are in the upper range of previous studies7,38 (Supplementary Data 3, ‘SI_Results.xlsx: annual LUC rates’).
-
(2)
Detailed trade assessment: This study uses detailed bilateral trade data from 1995 to 2021. Hence, our database (REX3)25 considers increasing agri-food imports to China, the USA, Europe and the Middle East from biodiversity hotspots, unlike previous studies that relied on averaged trade statistics for several regions of Latin America + Caribbean, Africa, Southeast Asia and the Pacific2,15,16,35,36.
-
(3)
Exclusion of total forest area: Previous studies included forestry impacts based on forested area2,15,16,35,36, leading to a conflicting trend: as deforestation increases, forested area decreases, resulting in lower biodiversity impacts, as these are linearly correlated with the forested area9. Our study attributes land-use change impacts to agri-food products, which increase in tandem with deforestation.
Marginal versus total allocation: by allocating total impacts to total demand, previous studies showed that international trade contributes 25–30% to global biodiversity impacts2,4,15,16,35,36,39. Applying this allocation to the REX3 (ref. 25) database, the relevance of international trade is similar (18% and 32% of land-use related biodiversity impacts in 1995 and 2022, respectively; Extended Data Fig. 10b,c). However, when allocating recent land-use change impacts to shifts in supply and demand, the importance of international trade is considerably higher: over 90% of global net land-use change biodiversity impacts from 1995 to 2022 are linked to increased international trade (Supplementary Data 3, ‘SI_Results.xlsx: trade within 189 countries’), with more than two-thirds attributed to increased exports of agri-food products from Latin America, Africa, and Southeast Asia + Pacific to China, the United States, Europe and the Middle East (Supplementary Data 3, ‘SI_Results.xlsx: trade within 14 regions’). This disparity is attributed to the marginal allocation19,20 applied here, where the contribution of international trade can exceed 100% of net land-use change impacts, if domestic impacts decreased simultaneously, while the net sum remains 100%. For example, in Brazil (Fig. 4), 126% of net land-use change impacts are exported, indicating that without exports, Brazil would have used less land due to decreased domestic consumption, leading to a decrease in biodiversity impacts. Thus, exports not only embody the full net change in biodiversity impacts, but also part of the otherwise decreased impacts due to land abandonment and reforestation. This allocation method can also be applied to previous results36 on potential bird extinction from 2001 to 2011, revealing a contribution of international trade ranging from 66% to 143%. This fluctuation is attributed to the higher sensitivity of allocating impacts to shifts rather than to total demand, and differences in temporal trends due to previous methodological shortcomings addressed here (see (1)–(3) above). This underscores the importance of robust time series for effective marginal analysis19,20, as provided here. Our approach highlights the important role of increased imports in driving land-use change impacts compared with 1995, underscoring the need for policies promoting sustainable commodity sourcing to prevent land conversion in tropical regions.
Limitations and Outlook
While this study does not assess biodiversity impacts from wood harvest, the REX3 (ref. 25) database enables assessing biodiversity impacts of wood, paper and rubber on the basis of the forested area from the LUH2 dataset21,22,23 (Extended Data Figs. 4 and 10 and Supplementary Discussion 1). However, future research should provide comprehensive wood harvest data and account for the rising intensification in forestry, as species richness decreases with increasing forest-management intensity6. In addition, impacts of land-use intensification and fragmentation should be considered40,41 alongside changes in land use area. Including impacts from land-management intensification could counteract (and potentially mitigate) the outcomes observed in the context of Brazil’s declining consumption-based land-use change impacts. Future research should also incorporate the effect of land abandonment in both recent and historical land-use impact assessment.
While previous studies analysed land-use impacts up to 20152,13,14,15,16, this study includes trends up to 2022. However, the LUH2 dataset21,22 used here is based on remote sensing data from 201042 combined with national land-use statistics from 1995 to 202143, extrapolated to 202223. This introduces uncertainty, especially in intercountry variability (Fig. 1) and the distinction by land conversion type. Therefore, further research is crucial to generate up-to-date land-use change data maps from remote sensing with continuous time series. Nevertheless, country-level net land-use change impacts are considered fairly robust, as they are based on national land use data until 202143. Moreover, the underlying EXIOBASE3 (refs. 14,44) database (v.3.8.2) includes detailed macro-economic accounts and bilateral trade data up to 2019, while post-2019 data extrapolated until 2022 using estimates from the International Monetary Fund. Furthermore, the REX3 (ref. 25) database includes reported bilateral trade data for 189 countries on food and agricultural products from 1995 to 202145. Thus, the conclusions are based on reported bilateral trade data45 and national land-use statistics43 up to 2021.
The species loss factors used here8,9,46 were assumed to be linear, while increasing land-use change would alter the countryside species–area relationship. Furthermore, decreases in biodiversity impacts are more uncertain than increases, and quantify a maximum in decreases. This is because global species extinctions are irreversible and hence, only species not yet globally extinct can potentially recover through land restoration. These assumptions may have led to underestimating increases and overestimating decreases in biodiversity impacts, potentially exacerbating the study’s conclusions.
Policy implications
This study shows that decreased biodiversity impacts in Europe, the USA, China and the Middle East have come at the expense of outsourcing agri-food supply chains to tropical biodiversity hotspots, resulting in an increase in global biodiversity impact that exceeds the decrease by a factor of ten. Moreover, the net impact on biodiversity resulting from land-use change (1.4% PSLglo from 1995 to 2022) surpasses the current biodiversity target for annual species loss due to land-use change47 by about fifty times. Therefore, global efforts should aim to massively reduce biodiversity impacts of land-use change by one to two orders of magnitude. These interventions are essential in addressing the biodiversity crisis and mitigating associated climate impacts, as land-use change contributes to over 10% of global climate impacts21,22,23.
Our results underscore the need to implement policy measures that: (1) support biodiversity hotspot regions in halting natural habitat destruction and (2) encouraging countries, especially China, the United States, the Middle East and Europe, to stop importing agri-food products from tropical biodiversity hotspots (see Supplementary Discussion 2 for an overview on possible policy measures). Implementing these policies requires transparency in global supply chains by quantitative impact mapping. While this study focuses on recent land-use change impacts, REX3 (ref. 25) also includes data on historical land-related biodiversity impacts, climate impacts, health impacts from particulate-matter emissions48, and water stress49, implemented following UNEP-SETAC9,16. REX3 is open access and, combined with our approach26, enables detailed mapping of supply chain impacts at high regional, sectoral and temporal resolution (189 countries, 163 sectors, from 1995 to 2022). This understanding is vital for designing incentives that align socio-economic interests with biodiversity conservation, climate targets and other environmental goals throughout global supply chains.
Methods
Our procedure can be divided into four steps. First, we calculated the biodiversity impact from land-use change from 1995 to 2022. Second, we calculated the biodiversity impact of land use in 1995, and added the cumulated land-use change impacts for the subsequent years. This allowed us to assess the biodiversity impact of land use from 1995 to 2022 (Extended Data Fig. 3(1)a,b). Third, we compiled the REX3 (ref. 25) database and applied the MRIO calculations to allocate the biodiversity impact from land use to the consuming regions and products (Extended Data Fig. 3(1)c,d) and to display the results in a multidimensional impact array26. Finally, we calculated the change in biodiversity impacts of land use as the difference from the value in 1995 (that is, the biodiversity impact from land-use change) from different perspectives to introduce a marginal allocation approach into MRIO analysis (Extended Data Fig. 3(2)). In this context, positive values refer to increases in biodiversity impacts, while negative values refer to decreases in biodiversity impacts. Each of the four steps is described in more detail below.
Regionalized biodiversity impact assessment of land-use change
For the land-use change data, we used the LUH2 dataset from ref. 21 (from 1995 to 2015) and ref. 22 with updates up to 2022, as used for the Global Carbon Budget assessments23. The LUH2 dataset provides annual global data on the transitions between different land-use states, including primary forest, other primary land, secondary forest, other secondary land, pastures, rangeland, cropland (annual and perennial) and urban land. These data are given per unit fraction of grid cell at 12 arcmin spatial resolution, which we translated into km2 for each grid cell. The LUH2 dataset relies on the HYDE 3.2 dataset42, which distinguishes the different land-use states on the basis of satellite data combined with FAO agricultural data43, and includes remote sensing data on forest cover change50 and national wood harvest data51.
The biodiversity impacts of land-use change from 1995 to 2022 were derived by the element-wise multiplication of the area of the transition from land-use state x to land-use state y with the ecoregion10-specific global species loss factors on land occupation from UNEP-SETAC8,9,46,52:
where b equals the biodiversity impact measured in PSLglo of each grid cell g, and year Δt (for example, from 1995 to 1996) due to the transition from land-use state x to land-use state y; f refers to the global species loss factor for land occupation state x and y in 804 terrestrial ecoregions (in PSLglo per m2) that were matched on a grid-cell level g; and l is the area of land-use change (in m2) per grid cell g and year Δt due to the transition of land-use state x to land-use state y. The global species loss factors are based on countryside species–area relationships53 that are weighted with global vulnerability scores52 for assessing the proportion of species at risk of irreversible global extinction. The global species loss factors refer to the fraction of global species that are potentially lost per square metre of primary land (forested and non-forested) converted for six land-use sectors: annual and perennial crops, pastures, intensive and extensive forestry, and urban land use. For instance, if primary land was converted to cropland, the species loss factor of cropland was applied, while if pastures were converted to cropland, the species loss factor of pastures was subtracted from that of cropland (equation (1); Supplementary Data 2, ‘SI_CFs.xlsx’). In this context, positive species loss factors quantify increases in biodiversity impacts (for example, deforestation for cropland) while negative species loss factors quantify decreases in biodiversity impacts (for example, reforestation of cropland). The species loss factors of pastures were used for both managed pastures and rangeland, but a factor of 0.5 was applied to rangeland to account for the lower intensity compared with managed pastures21,54. Abandoned land was matched to the class of ‘other secondary land’ in the LUH2 dataset. As no species loss factors exist for this land-use type, we applied the species loss factors from rangeland. These are on average 50% and 70% lower than those for primary land conversion to crops and pastures, respectively (Supplementary Fig. 1). This implies that when primary land is initially converted to cropland (or pastures) and subsequently converted to other secondary land through abandonment, the resulting decrease in biodiversity impact from abandonment is approximately 70% (or 50% for abandoned pastures) less than the initial increase in biodiversity impact from primary land conversion. Following this procedure, we assessed biodiversity impacts of land-use change in the unit of global potential species loss at a steady-state land use after conversion. To assess the cumulated land-use change impacts from 1995 to 2022 (illustrated in Fig. 1), we calculated the sum across all individual years. Finally, we also compared the results to the planetary boundary from ref. 47, which considers a limit of 0.001% PSLglo per year (equalling 0.027% additional global species from 1995 to 2022).
Regionalized biodiversity impact assessment of land use
In addition to the data on land-use change, the LUH2 dataset also provides annual global data on the area of different land use states, including pastures, cropland and urban land. On the basis of these data, we calculated the biodiversity impact of land use in 1995, and added the cumulated land-use change impacts (from equation (1)) for each year. For instance, the biodiversity loss from land use in 2022 was calculated on the basis of the sum of the biodiversity impact of land use in 1995 plus the cumulated biodiversity impact of land-use change from 1995 to 2022 (from equation (1)). The biodiversity impact of land use in 1995 was calculated by the element-wise multiplication of the area of the land-use states (pastures, cropland and urban land) from the LUH2 dataset21,22,23 with the ecoregion10-specific global species loss factors on land occupation from UNEP-SETAC8,9,46,52:
where b equals the biodiversity impact measured in global potential species loss (PSLglo) of each grid cell g in the year t due to the land-use state x; f refers to the global species loss factor for land occupation of 804 terrestrial ecoregions (in PSLglo per m2) that were matched on a grid-cell level g; and l is the area of land-use state x (in m2) of each grid cell g in the year t. The species loss factors of annual crops were applied to the C3 annual, C4 annual and C3 nitrogen-fixing crops, while the species loss factors of permanent crops were applied to the C3 and C4 perennial crops from the LUH2 dataset. The species loss factors of pastures were used for both managed pastures and rangeland, but a factor of 0.5 was applied to rangeland to account for the lower intensity compared with managed pastures21,54. For urban land use, we applied the urban species loss factors (Supplementary Data 2, ‘SI_CFs.xlsx’).
In this study, the impacts of forestry products were not assessed. On the one hand, impacts of deforestation were allocated to agricultural products because they tend to be the primary driver of deforestation, while timber is typically a by-product30. On the other hand, comprehensive data on wood harvest areas were not available for inclusion in the assessment21,22,23. However, the database attached to this study also enables assessing biodiversity impacts of wood, paper and rubber on the basis of the forested area from the LUH2 dataset21,22,23. In this context, biodiversity impacts from land use through agriculture, forestry and urban land were implemented by applying the ecoregion10-specific global species loss factors from UNEP-SETAC8,9,46 to the different land-use states from the LUH2 dataset21,22,23. This was done as described in equation (2), but for each year from 1995 and 2022, and by also including the impacts from forestry. In this context, the species loss factors of intensive forestry were applied to the secondary forested area of the LUH2 dataset. The results are shown in the Extended Data Figs. 4 and 10 for comparison.
Resolved EXIOBASE (REX)
Several global MRIO databases exist, such as EXIOBASE3 (refs. 14,44) and Eora26 (ref. 24), which are available as time series. The industry-by-industry version of EXIOBASE3 stands out with highest sectoral resolution (163 sectors) but is limited in the country resolution, as it distinguishes only 44 countries and aggregates all the other regions into five so-called ‘Rest of the World regions’ (RoW regions). As more than a third of global land-related biodiversity impacts are caused in these RoW regions26, it is important to improve the spatial resolution of EXIOBASE3 on a country level for assessing the drivers in the global supply chain. In contrast to EXIOBASE3, Eora26 is available on a country level but is limited in the sectoral resolution (only 26 sectors). For instance, agriculture is aggregated as a single sector in Eora26. Therefore, we followed the approach in ref. 16 to merge the industry version of EXIOBASE3 (ref. 14) (v.3.8.2)44 with Eora26 (ref. 24) (v.199.82) to compile a highly resolved MRIO database called Resolved EXIIOBASE v.3 (REX3 (ref. 25)). REX3 distinguishes 189 countries, 163 sectors and time series from 1995 to 2022. While the REX3 database used in this study is based on EXIOBASE3 v.3.8.2, the open-access REX3 database shared via Zenodo is based on EXIOBASE3 v.3.8.0, as this is the last version of EXIOBASE3 that can still be shared as open access without share-alike restrictions.
While data from EXIOBASE3 are provided up to 202244, data from Eora26 are only available until 2016. Therefore, we merged the past 6 years of EXIOBASE3 with the Eora26 data from 2016. To further improve the data quality of the disaggregated RoW countries, we integrated production data from FAOSTAT37 from 1995 to 2015. Data from 2015 were also used for the years 2016–2022, as more recent data from FAOSTAT cannot be integrated in an open-access database anymore. Moreover, we integrated data on bilateral trade within all 189 countries from the BACI database45 for all agricultural and food sectors for the years 1995 to 2021. Data from 2021 were also used for the year 2022, as data from 2022 were not available yet. Further details on the structure and compilation of REX3 are listed in Supplementary Methods 2 and ref. 16.
For the impact assessment, the first step was to apply the global species loss factors of land occupation from UNEP-SETAC8,9 to the land use data from REX3 (as done in ref. 16). This information was used to determine the proportion of each sector concerning biodiversity impacts of cropland, pasture, forestry and urban industry in each country (for example, wheat cultivation contributes x% of crops-related biodiversity impacts in country y and year t). In a second step, we multiplied these proportions with the biodiversity impacts of crops, pastures, forestry and urban land derived from the LUH2 dataset21,22,23, respectively, for each country and year. In this context, impacts of crops were allocated to eight crop cultivating sectors, impacts of grazing were allocated to eight animal farming sectors, impacts of forestry were allocated to one forestry sector, and impacts of urban land use were allocated to the remaining industrial sectors (excluding mining) and the final demand (for each country and year). We followed this procedure to add five extensions of biodiversity impact from land-use change to the REX3 database. These include deforestation of primary forest and secondary forest, other primary and secondary land conversion, and other land conversion (based on the results from equation (1)). Moreover, we added an extension of biodiversity impacts of land occupation (based on the results of equation (2)). In this context, we also added the mining-related biodiversity impact assessment from ref. 55 for the year 2014, where the global mining area dataset of ref. 56 was weighted with the urban species loss factors from UNEP-SETAC8,9. To implement time series for mining-related impacts, we linearly scaled the impacts from 201455 with the economic output of each mining sector per country and year in the REX3 (ref. 25) database.
Supply chain impact assessment with marginal allocation
Compared with previous MRIO assessments4,35,36,39,57 where impacts are allocated to the total economy (homogeneity assumption), the principle of this study’s marginal allocation approach19,20 is to allocate land-use change impacts to shifts in the global supply chain, such as due to shifts in production, consumption and trade of agri-food products. For this purpose, we added the biodiversity impact of land occupation from 1995 (equation (2)) to the cumulated land-use change impacts per year in the satellite matrices of the REX3 (ref. 25) database. In a next step, we applied the supply chain impact mapping (SCIM) method of ref. 26 to these extensions, and subtracted the impact matrices referring to the year 1995 from the impact matrices referring to the other years (1996 to 2022). This procedure allowed us to allocate the land-use change impacts to changes in the global supply chain at the finest regional and sectoral resolution (189 countries and 164 sectors), and to store these changes in a multidimensional impact array. In this context, positive values refer to increases in biodiversity impacts due to an increase in production or consumption, while negative values refer to decreases in biodiversity impacts due to a decrease in production or consumption. This procedure is outlined below.
In addition to the perspectives of production and consumption addressed by the standard Leontief model58, the supply chain impact mapping method of ref. 26 adds an intermediate perspective, for example, of agricultural goods, to the global supply chain, and connects it in a multidimensional impact array (one dimension for each perspective). In this study, a five-dimensional (5D) impact array was created with the dimension of 5 × 164 × 189 × 189 × 164. The first dimension refers to five aggregated land conversion types, namely deforestation of primary forest and secondary forest, other primary and secondary land conversion, and other land conversion. The second perspective refers to the producing sectors and households. The third and fourth perspective equals the producing and consuming countries, respectively. The fifth perspective refers to the consumption from sectors, split into sectors that produce agricultural goods, the remaining global economy and households.
The perspective of produced agricultural goods, the remaining economy and households in the fifth dimension is based on the principle of dividing the global economy into a target economy and a non-target economy, as presented by the method of ref. 59 for the case of Japan’s material production. Following the procedure described in ref. 26 for the global economy, sectors referring to the extraction and processing of agri-food products were set as target sectors (36 target sectors; Supplementary Data 1, ‘Classification_REX3.xslx’, sheet ‘Sectors’) and all countries were set as target regions (189 countries). This resulted in 6,804 target-sector regions referring to the production of food, textiles and biochemicals (agri-food products) and 25,893 non-target-sector regions referring to the remaining global economy (137 non-target sectors × 189 countries). This allocation is based on the principle that, for instance, if crops are used to feed animals, produce textiles (for example, cotton) or biochemicals (for example, bioplastics), the land-use change impacts of these crops are allocated to the produced commodities. However, if biochemicals, such as bioplastics, are used for food packaging or for textiles, the impacts of those bioplastics are not counted again among food or textiles to prevent double counting.
Our procedure allows us to assess the full supply chain impacts of agri-food products (target sectors) without double counting, and further adds the impacts of the remaining global economy (for example, mining and other industries) as well as households from urban land use, which are stored in the fifth dimension of the impact array. Therefore, the 5D impact array in sum equals the standard Leontief model but provides additional information on the linkages and drivers in the global supply chain. This is illustrated in a simplified way in Extended Data Fig. 10 for land-use-related biodiversity impacts in 2022, where impacts are allocated to total production and consumption. Finally, we subtracted the impact matrices referring to the year 1995 from those for subsequent years (1996 to 2022) to link land-use change impacts to shifts in agri-food supply chains (marginal allocation), and aggregated the results for seven land-use sectors after conversion (production sectors), 14 production and consumption regions, and 10 produced goods, as illustrated in Figs. 3 and 4. Further methods on the classification by income and the Human Development Index (HDI) are described in Supplementary Methods 3.
Applied software
RStudio (v.4.3.1) was used to calculate the results on the regionalized biodiversity impact assessment. Matlab (v.2023b) was used to compile the REX3 (ref. 25) database and to link land-use change impacts to the shifts in global supply chains using the SCIM method. The results were visualized with RStudio (v.4.3.1), Tableau Desktop (v.2023.2) and Microsoft Powerpoint (v.16.78.3).
Reporting summary
Further information on research design is available in the Nature Portfolio Reporting Summary linked to this article.
Data availability
Further results of this study are presented in Supplementary Information. The data for the figures presented in this study are attached to Supplementary Data 3. The source data of all figures can be downloaded at https://doi.org/10.5281/zenodo.13625061 (ref. 60). The data on land-use change were retrieved from the LUH2 dataset (https://luh.umd.edu/) from ref. 21 (1995–2015) and ref. 22 with updates up to 202223. The biodiversity impact assessment was based on the ecoregion10-specific global species loss factors on land occupation from UNEP-SETAC (https://www.lc-impact.eu/EQland_stress.html)8,9,46,52. The Resolved EXIOBASE v.3 (REX3) was based on the approach in ref. 16 to merge EXIOBASE3 (ref. 14) (v.3.8.2)44 with Eora26 (https://worldmrio.com/eora26/)24 and integrate production data from FAOSTAT (https://www.fao.org/faostat/en/#data/QCL)37 and bilateral trade data from the BACI database (http://www.cepii.fr/cepii/en/bdd_modele/bdd_modele_item.asp?id=37)45. The Zenodo repository to download REX3 (https://doi.org/10.5281/zenodo.10354283)25 contains the data for the year 1995 to 2022. REX3 (ref. 25) is open access under the Creative Commons Attribution 4.0 International License and can be used to assess the environmental impacts within global supply chains. While EXIOBASE v.3.8.2 (ref. 44) was used for this study, the REX3 database shared in the Zenodo repository is based on EXIOBASE v.3.8 (ref. 61), as this is the earliest EXIOBASE version that can still be shared via a Creative Commons Attribution 4.0 International License.
Code availability
The Zenodo repository25 also includes the R code to compile the spatially resolved global regionalized biodiversity impact assessment (Fig. 1) and the matlab code to compile the REX3 database and to calculate the results of this study (Figs. 2–5). The open-access code can be used to reproduce all results of this study. The folder ‘matlab code to compile REX3’ provides the code to compile the REX3 database. This can also be done by using an earlier EXIOBASE version (for example, v.3.8.2). For this purpose, the data from EXIOBASE3 (ref. 44) need to be saved into the subfolder ‘Files/Exiobase/’, while the data from Eora26 (https://worldmrio.com/eora26/) need to be saved into the subfolder ‘Files/Eora26/bp/’. The folder ‘R code for regionalized BD impact assessment based on LUH2 data and maps (Fig. 1)’ contains the R code to weight the land use data from the LUH2 dataset21,22,23 with the ecoregion10-specific species loss factors from UNEP-SETAC8,9,46,52 and to create the maps shown in Fig. 1 of the study. For this purpose, the data from the LUH2 dataset (https://luh.umd.edu/data.shtml; transitions.nc) need to be stored in the subfolder ‘LUH2 data’. The folder ‘matlab code to calculate MRIO results (Figs. 2–5)’ contains the matlab code to calculate the MRIO results for Figs. 2–5 of the study. The folder ‘R code to illustrate sankeys – Figs. 3–5, S11’ contains the R code to visualize the flow charts in the research article.
References
-
Ceballos, G. et al. Accelerated modern human-induced species losses: entering the sixth mass extinction. Sci. Adv. 1, e1400253 (2015).
Google Scholar
-
Oberle, B. et al. UNEP IRP Global Resources Outlook 2019: Natural Resources for the Future We Want. A Report of the International Resource Panel (United Nations Environment Programme, 2019).
-
Díaz, S. et al. Pervasive human-driven decline of life on Earth points to the need for transformative change. Science 366, eaax3100 (2019).
Google Scholar
-
Lenzen, M. et al. International trade drives biodiversity threats in developing nations. Nature 486, 109–112 (2012).
Google Scholar
-
Chaudhary, A., Pfister, S. & Hellweg, S. Spatially explicit analysis of biodiversity loss due to global agriculture, pasture and forest land use from a producer and consumer perspective. Environ. Sci. Technol. 50, 3928–3936 (2016).
Google Scholar
-
Rosa, F. et al. Can forest management practices counteract species loss arising from increasing European demand for forest biomass under climate mitigation scenarios? Environ. Sci. Technol. 57, 2149–2161 (2023).
Google Scholar
-
Leclère, D. et al. Bending the curve of terrestrial biodiversity needs an integrated strategy. Nature 585, 551–556 (2020).
Google Scholar
-
Chaudhary, A., Verones, F., de Baan, L. & Hellweg, S. Quantifying land use impacts on biodiversity: combining species–area models and vulnerability indicators. Environ. Sci. Technol. 49, 9987–9995 (2015).
Google Scholar
-
Life Cycle Initiative. Global Guidance for Life Cycle Impact Assessment Indicators (UNEP-SETAC, 2016).
-
Olson, D. M. et al. Terrestrial ecoregions of the world: a new map of life on Earth: a new global map of terrestrial ecoregions provides an innovative tool for conserving biodiversity. BioScience 51, 933–938 (2001).
Google Scholar
-
Pereira, H. M., Ziv, G. & Miranda, M. Countryside species–area relationship as a valid alternative to the matrix-calibrated species–area model. Conserv. Biol. 28, 874–876 (2014).
Google Scholar
-
Hilton-Taylor, C. & Brackett, D. 2000 IUCN Red List of Threatened Species (IUCN, 2000).
-
Wood, R. et al. Growth in environmental footprints and environmental impacts embodied in trade: resource efficiency indicators from EXIOBASE3. J. Ind. Ecol. 22, 553–564 (2018).
Google Scholar
-
Stadler, K. et al. EXIOBASE 3: developing a time series of detailed environmentally extended multi-regional input-output tables. J. Ind. Ecol. 22, 502–515 (2018).
Google Scholar
-
Bjelle, E. L. et al. Adding country resolution to EXIOBASE: impacts on land use embodied in trade. J. Econ. Struct. 9, 14 (2020).
Google Scholar
-
Cabernard, L. & Pfister, S. A highly resolved MRIO database for analyzing environmental footprints and Green Economy Progress. Sci. Total Environ. 755, 142587 (2021).
Google Scholar
-
Marquardt, S. G. et al. Identifying regional drivers of future land-based biodiversity footprints. Glob. Environ. Change 69, 102304 (2021).
Google Scholar
-
Schaubroeck, T. Relevance of attributional and consequential life cycle assessment for society and decision support. Front. Sustain. 4, 1063583 (2023).
Google Scholar
-
Ayres, R. U. in The History and Future of Economics 195–229 (Springer, 2023).
-
Campbell, B. in The Palgrave Encyclopedia of Strategic Management (eds Augier, M. & Teece, D. J.) 967–970 (Palgrave Macmillan, 2018).
-
Hurtt, G. C. et al. Harmonization of global land use change and management for the period 850–2100 (LUH2) for CMIP6. Geosci. Model Dev. 13, 5425–5464 (2020).
Google Scholar
-
Chini, L. et al. Land-use harmonization datasets for annual global carbon budgets. Earth Syst. Sci. Data 13, 4175–4189 (2021).
Google Scholar
-
Friedlingstein, P. et al. Global carbon budget 2022. Earth Syst. Sci. Data 14, 4811–4900 (2022).
Google Scholar
-
Lenzen, M., Moran, D., Kanemoto, K. & Geschke, A. Building Eora: a global multi-region input–output database at high country and sector resolution. Econ. Syst. Res. 25, 20–49 (2013).
Google Scholar
-
Cabernard, L., Pfister, S. & Hellweg, S. Resolved Exiobase version 3 (REX3) (3.2) [Data set]. Zenodo https://doi.org/10.5281/zenodo.10354283 (2024).
-
Cabernard, L., Pfister, S. & Hellweg, S. A new method for analyzing sustainability performance of global supply chains and its application to material resources. Sci. Total Environ. 684, 164–177 (2019).
Google Scholar
-
World Map with the Intertropical Zone Highlighted (Wikipedia, accessed December 2023); https://en.wikipedia.org/wiki/Tropics#/media/File:World_map_indicating_tropics_and_subtropics.png
-
Hatna, E. & Bakker, M. M. Abandonment and expansion of arable land in Europe. Ecosystems 14, 720–731 (2011).
Google Scholar
-
Alonso‐Sarría, F., Martínez‐Hernández, C., Romero‐Díaz, A., Cánovas‐García, F. & Gomariz‐Castillo, F. Main environmental features leading to recent land abandonment in Murcia region (Southeast Spain). Land Degrad. Dev. 27, 654–670 (2016).
Google Scholar
-
Global Forest Resources Assessment 2020: Main Report (FAO, 2020); https://www.fao.org/3/ca9825en/ca9825en.pdf
-
UN Data (United Nations Statistics Division, accessed November 2023); https://data.un.org
-
Hötzel, M. J. & Vandresen, B. Brazilians’ attitudes to meat consumption and production: present and future challenges to the sustainability of the meat industry. Meat Sci. 192, 108893 (2022).
Google Scholar
-
Pendrill, F. et al. Disentangling the numbers behind agriculture-driven tropical deforestation. Science 377, eabm9267 (2022).
Google Scholar
-
Goldman, E., Weisse, M., Harris, N. & Schneider, M. Estimating the Role of Seven Commodities in Agriculture-linked Deforestation: Oil Palm, Soy, Cattle, Wood Fiber, Cocoa, Coffee, and Rubber Technical Note (World Resources Institute, 2020).
-
Cabernard, L., Pfister, S. & Hellweg, S. Improved sustainability assessment of the G20’s supply chains of materials, fuels, and food. Environ. Res. Lett. 17, 034027 (2022).
Google Scholar
-
Marques, A. et al. Increasing impacts of land use on biodiversity and carbon sequestration driven by population and economic growth. Nat. Ecol. Evol. 3, 628–637 (2019).
Google Scholar
-
FAOSTAT. Data (FAO, accessed May 2019); http://www.fao.org/faostat/en/#data
-
Pereira, H. M. et al. Global trends and scenarios for terrestrial biodiversity and ecosystem services from 1900 to 2050. Science 384, 458–465 (2024).
Google Scholar
-
Hoang, N. T. & Kanemoto, K. Mapping the deforestation footprint of nations reveals growing threat to tropical forests. Nat. Ecol. Evol. 5, 845–853 (2021).
Google Scholar
-
Kehoe, L. et al. Biodiversity at risk under future cropland expansion and intensification. Nat. Ecol. Evol. 1, 1129–1135 (2017).
Google Scholar
-
Kuipers, K. J., May, R. F., Graae, B. J. & Verones, F. Reviewing the potential for including habitat fragmentation to improve life cycle impact assessments for land use impacts on biodiversity. Int. J. Life Cycle Assess. 24, 2206–2219 (2019).
Google Scholar
-
Klein Goldewijk, K., Beusen, A., Doelman, J. & Stehfest, E. Anthropogenic land use estimates for the Holocene–HYDE 3.2. Earth Syst. Sci. Data 9, 927–953 (2017).
Google Scholar
-
Monfreda, C., Ramankutty, N. & Foley, J. A. Farming the planet: 2. Geographic distribution of crop areas, yields, physiological types, and net primary production in the year 2000. Global Biogeochem. Cycles https://doi.org/10.1029/2007GB002947 (2008).
-
Stadler, K. et al. EXIOBASE3 (version 3.8.2) [Data set]. Zenodo https://zenodo.org/records/5589597 (2021).
-
Gaulier, G. & Zignago, S. BACI: international trade database at the product-level (1995–2021) (CEPII, 2010); http://www.cepii.fr/CEPII/en/bdd_modele/bdd_modele_item.asp?id=37
-
Verones, F. et al. LC‐IMPACT: a regionalized life cycle damage assessment method. J. Ind. Ecol. 24, 1201–1219 (2020).
Google Scholar
-
Steffen, W. et al. Planetary boundaries: guiding human development on a changing planet. Science 347, 1259855 (2015).
Google Scholar
-
Fantke, P. et al. Characterizing aggregated exposure to primary particulate matter: recommended intake fractions for indoor and outdoor sources. Environ. Sci. Technol. 51, 9089–9100 (2017).
Google Scholar
-
Boulay, A.-M. et al. The WULCA consensus characterization model for water scarcity footprints: assessing impacts of water consumption based on available water remaining (AWARE). Int. J. Life Cycle Assess. 23, 368–378 (2018).
Google Scholar
-
Hansen, M. C. et al. High-resolution global maps of 21st-century forest cover change. Science 342, 850–853 (2013).
Google Scholar
-
Kaplan, J. O. et al. Constraining the deforestation history of Europe: evaluation of historical land use scenarios with pollen-based land cover reconstructions. Land 6, 91 (2017).
Google Scholar
-
Chaudhary, A., Verones, F., de Baan, L., Pfister, S. & Hellweg, S. Land Stress: Potential Species Loss From Land Use (global; PSSRg) LC-IMPACT version 1.0 (LC-IMPACT, 2016); www.lc-impact.eu
-
Pereira, H. M. & Daily, G. C. Modeling biodiversity dynamics in countryside landscapes. Ecology 87, 1877–1885 (2006).
Google Scholar
-
Rinehart, L. Pasture, Rangeland And Grazing Management ATTRA Publication# IP306 (National Sustainable Agricultural Information Service, 2006).
-
Cabernard, L. & Pfister, S. Hotspots of mining-related biodiversity loss in global supply chains and the potential for reduction through renewable electricity. Environ. Sci. Technol. 56, 16357–16368 (2022).
Google Scholar
-
Maus, V. et al. A global-scale data set of mining areas. Sci. Data 7, 289 (2020).
Google Scholar
-
Malik, A., Lenzen, M. & Fry, J. Biodiversity impact assessments using nested trade models. Environ. Sci. Technol. 56, 7378–7380 (2022).
Google Scholar
-
Leontief, W. & Strout, A. in Structural Interdependence and Economic Development 119–150 (Springer, 1963).
-
Dente, S. M. R., Aoki-Suzuki, C., Tanaka, D. & Hashimoto, S. Revealing the life cycle greenhouse gas emissions of materials: the Japanese case. Resour. Conserv. Recycl. 133, 395–403 (2018).
Google Scholar
-
Cabernard, L., Pfister, S. & Hellweg, S. Source data to create the figures of the study “Biodiversity impacts of recent land-use change driven by increases in agri-food imports” based on REX3. Zenodo https://doi.org/10.5281/zenodo.13625061 (2024).
-
Konstantin, S. et al. EXIOBASE3 (version 3.8) [Data set]. Zenodo https://zenodo.org/records/4277368 (2020).
Acknowledgements
We thank L. Parsons Chini of the University of Maryland for providing valuable explanation on the LUH2 dataset as well as recent time series on the land-use transitions and states from 2016 to 2022. The work of S.H. was supported by NCCR Catalysis (grant number 180544), a National Centre of Competence in Research of the Swiss National Science Foundation.
Funding
Open access funding provided by Technische Universität München.
Author information
Authors and Affiliations
Contributions
L.C., S.P. and S.H. designed the research and interpreted the results. L.C. compiled the database, calculated and visualized the results, and wrote the paper, with inputs from S.P. and S.H.
Corresponding author
Ethics declarations
Competing interests
The authors declare no competing interests.
Peer review
Peer review information
Nature Sustainability thanks Henrique Pereira, Konstantin Stadler and the other, anonymous, reviewer(s) for their contribution to the peer review of this work.
Additional information
Publisher’s note Springer Nature remains neutral with regard to jurisdictional claims in published maps and institutional affiliations.
Extended data
Extended Data Fig. 1 Biodiversity impacts of land-use change for urban activities from 1995 to 2022 at 15min-arc resolution (~28 km).
Land conversion data from the LUH2 dataset21,22,23 were weighted with ecoregion10-specific impact factors from UNEP-SETAC8,9 to assess biodiversity impacts in percentages of global potential species loss (PSLglo). Positive percentages refer to increases in biodiversity impacts, while negative values refer to decreases in biodiversity impacts. The total biodiversity impacts from land-use change and the division for all the other land transitions are shown in Fig. 1 of the manuscript.
Extended Data Fig. 2 Aggregation of countries and world regions in our study for presenting the results.
The classification distinguishes all countries that contribute to more than 5% of global land conversion impacts, whether through production or consumption, and aggregate the remaining countries into the main world regions.
Extended Data Fig. 3 Biodiversity impacts of land use in 1995 plus cumulated land use change impacts from 1995 to 2022 and cumulated land use change impacts from 1995 to 2022.
(1) Biodiversity impacts of land use in 1995 plus cumulated land use change impacts from 1995 to 2022 and (2) cumulated land use change impacts from 1995 to 2022. Impacts are shown from different perspectives: (a) land use sectors, (b) production regions where land use (change) has happened, and (c) consumption regions of (d) produced goods. Land use change impacts were calculated as the impacts related to land conversion between different land use states, as described in equation 1 of the research article. Land use impacts in 1995 were calculated based on equation 2 of the research article. Land use impacts for the years 1995 to 2022, calculated based on equation 2 of the research article, are shown in Figure S4.
Extended Data Fig. 4 Biodiversity impacts of land use from 1995 to 2022 and related changes in biodiversity impacts of land use in comparison to the year 1995.
1) Biodiversity impacts of land use from 1995 to 2022 and 2) related changes in biodiversity impacts of land use in comparison to the year 1995 (meaning that land use impacts in 1995 were subtracted from land use impacts in the subsequent years). Impacts are shown from different perspectives: (a) land use sectors, (b) production regions where land use (change) has happened, and (c) consumption regions of (d) produced goods. Results were calculated based on equation 2 of the research article for the year 1995–2022, including impacts related to forestry. An in-depth analysis on the supply chain is shown in Figure S6 for the year 2022.
Extended Data Fig. 5 Biodiversity impacts of land use in 1995 plus cumulated land use change impacts from 1995 to 2022 and cumulated land use change impacts from 1995 to 2022 divided by region of production (columns) and produced commodities (colors).
(1) Biodiversity impacts of land use in 1995 plus cumulated land use change impacts from 1995 to 2022 and (2) cumulated land use change impacts from 1995 to 2022 divided by region of production (columns) and produced commodities (colors).
Extended Data Fig. 6 Biodiversity impacts of land use in 1995 plus cumulated land use change impacts from 1995 to 2022 and cumulated land use change impacts from 1995 to 2022 divided by region of consumption (columns) and region of production (colors).
(1) Biodiversity impacts of land use in 1995 plus cumulated land use change impacts from 1995 to 2022 and (2) cumulated land use change impacts from 1995 to 2022 divided by region of consumption (columns) and region of production (colors). The grey category refers to the impacts due to consumption of commodities produced within the same country/region (similar as illustrated in Figure S6b, c for the year 2022).
Extended Data Fig. 7 Biodiversity impacts from land use in 1995 plus cumulated land use change impacts from 1995 to 2022 and cumulated land use change impacts from 1995 to 2022 divided by income group of consumption (columns) and income group of production (colors).
(1) Biodiversity impacts from land use in 1995 plus cumulated land use change impacts from 1995 to 2022 and (2) cumulated land use change impacts from 1995 to 2022 divided by income group of consumption (columns) and income group of production (colors). The grey category refers to the impacts due to consumption of commodities produced within the same income group. The procedure of calculating these results is explained in the Methods Section S3.
Extended Data Fig. 8 Biodiversity impacts from land use in 1995 plus cumulated land use change impacts from 1995 to 2022 and cumulated land use change impacts from 1995 to 2022 divided by HDI group of consumption (columns) and HDI group of production (colors).
(1) Biodiversity impacts from land use in 1995 plus cumulated land use change impacts from 1995 to 2022 and (2) cumulated land use change impacts from 1995 to 2022 divided by HDI group of consumption (columns) and HDI group of production (colors). The grey category refers to the impacts due to consumption of commodities produced within the same HDI group. The procedure of calculating these results is explained in the Methods Section S3.
Extended Data Fig. 9 Net land-use change area from 1995 to 2022 based on the LUH2 dataset.
21,22,23 The sum of all changes equals zero.
Extended Data Fig. 10 Global biodiversity loss of land occupation (=land use) in 2022 divided by a) land use type, b) production region, c) consumption region, d) produced goods and e) end-use sector.
Results were calculated based on equation 2 of the paper for the year 2022, including impacts related to forestry.
Supplementary information
Supplementary Information
Supplementary Results 1 and 2, Discussion 1 and 2, Methods 1–3 and Fig. 1.
Reporting Summary
Supplementary Data 1
Excel file listing all sectors, countries and extensions of the MRIO database REX3.
Supplementary Data 2
Species loss factors applied to the land transitions and land-use states based on equations (1) and (2).
Supplementary Data 3
Excel file containing the data for the figures and results presented in this study.
Rights and permissions
Open Access This article is licensed under a Creative Commons Attribution 4.0 International License, which permits use, sharing, adaptation, distribution and reproduction in any medium or format, as long as you give appropriate credit to the original author(s) and the source, provide a link to the Creative Commons licence, and indicate if changes were made. The images or other third party material in this article are included in the article’s Creative Commons licence, unless indicated otherwise in a credit line to the material. If material is not included in the article’s Creative Commons licence and your intended use is not permitted by statutory regulation or exceeds the permitted use, you will need to obtain permission directly from the copyright holder. To view a copy of this licence, visit http://creativecommons.org/licenses/by/4.0/.
Reprints and permissions
About this article
Cite this article
Cabernard, L., Pfister, S. & Hellweg, S. Biodiversity impacts of recent land-use change driven by increases in agri-food imports.
Nat Sustain (2024). https://doi.org/10.1038/s41893-024-01433-4
-
Received: 10 July 2023
-
Accepted: 16 August 2024
-
Published: 20 September 2024
-
DOI: https://doi.org/10.1038/s41893-024-01433-4