Abstract
Loss of protein homeostasis is one of the hallmarks of aging. As such, interventions that restore proteostasis should slow down the aging process and improve healthspan. Two of the most broadly used anti-aging interventions that are effective in organisms from yeast to mammals are calorie restriction (CR) and rapamycin (RM) treatment. To identify the regulatory mechanisms by which these interventions improve the protein homeostasis, we carried out ribosome footprinting in the muscle of mice aged under standard conditions, or under long-term treatment with CR or RM. We found that the treatments distinctly impact the non-canonical translation, RM primarily remodeling the translation of upstream open reading frames (uORFs), while CR restores stop codon readthrough and the translation of downstream ORFs. Proteomics analysis revealed the expression of numerous non-canonical ORFs at the protein level. The corresponding peptides may provide entry points for therapies aiming to maintain muscle function and extend health span.
Introduction
Skeletal muscle wasting is a debilitating and often irreversible process that occurs in myopathy, neuromuscular disorders and chronic diseases, and is also a hallmark of aging1. When the age-dependent decrease in muscle mass and function reaches a critical threshold, the condition is known as sarcopenia2. With an increasing average lifespan in the human population, sarcopenia has become the main cause of frailty and falls in the elderly, posing an important socio-economic challenge3,4,5. Therefore, uncovering mechanisms to mitigate aging-associated skeletal muscle wasting is important for human healthcare.
Muscle mass is determined by the balance of protein synthesis and degradation. A key regulator of protein synthesis in response to nutrient availability and many other stimuli is the mammalian target of rapamycin (mTOR) serine/threonine kinase6,7. Signaling via mTOR appears to be impaired in elderly human individuals, leading to an impaired anabolic response and amino acid resistance8,9. Overcoming anabolic resistance by boosting mTOR activity was expected to attenuate sarcopenia, but the sustained mTORC1 activation via deletion of the repressive tuberous sclerosis 1 (TSC1) gene was shown to result in reduced muscle mass and strength10.
The inhibition of the mTOR kinase by rapamycin (RM) and calorie restriction (CR) are the most broadly tested interventions that promote both life and health span in model organisms from yeast to mammals11,12. The long-term RM treatment has been recently found to attenuate sarcopenia13,14, while CR, defined as 60–70% of ad libitum diet without malnutrition15, was shown to improve the muscle mass-to-body weight ratio and the locomotor activity of rodents16,17. Early-onset CR counteracts the loss of muscle fibers in rats18 and decreases aging-associated abnormalities in the neuromuscular junctions (NMJ) of mice19. Short-term CR also increased the availability and activity of stem cells in the skeletal muscle of old mice, improving their repair capacity20, though another study found that the proliferation of such cells in vitro was reduced21. CR and RM were reported to reduce protein synthesis in various organs22,23,24, including the muscle25,26. However, how these treatments remodel mRNA translation to maintain muscle function, especially when applied for long periods of time27, is not well understood.
The method of choice for studying the dynamics of protein synthesis with nucleotide resolution is ribosome footprinting, also known as ribo-seq28,29. The method has been used to identify novel sites of translation initiation in differentiating muscle cells30 as well as targets of translational control in response to endurance exercise31. In the context of aging, ribosome footprinting has revealed the impaired translation of mTOR-responsive transcripts, as well as an apparent change in the density of ribosomes along mRNAs, away from start codons and toward stop codons32. Furthermore, the translation elongation rate has been reported to decrease with age33. As CR and RM generally affect protein synthesis and improve muscle function during aging, we asked whether their partially overlapping mechanisms also involve translational control. We carried out ribosome footprinting on the Quadriceps femoris muscle of adult, old, CR and RM-treated mice. We identified numerous non-canonical ORFs as targets of translational control, and found that RM primarily remodels the translation of uORFs, while CR the stop codon readthrough and translation of downstream ORFs.
Results
Ribosome footprinting enables the comprehensive quantification of protein synthesis in the muscle
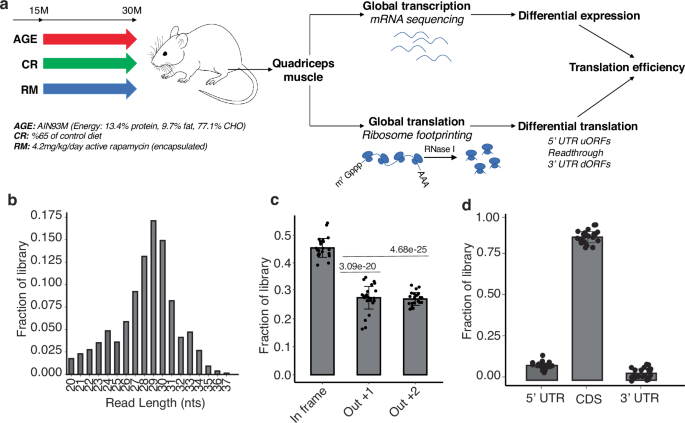
We have implemented the ribo-seq method for Quadriceps femoris (QUAD) samples from mice fed an AIM93M diet, ad libitum, from 15 to 30 months of age, as well as mice receiving the anti-aging treatments RM or 35% CR (Fig. 1a). The functionality of various muscles from these mice was characterized in a previous study17, the mass of QUAD relative to body mass being improved by both RM and CR. To quantify the translation efficiency (TE = ratio of normalized ribo-seq and mRNA-seq reads on the coding region) on a per transcript basis, we sequenced both mRNAs and ribosome footprints (referred to as ribosome-protected fragments, RPFs) from these samples. We obtained six replicates of ribo-seq and three replicates of mRNA-seq for each condition, namely 10-month-old adult mice (10M_WT), 30-month-old geriatric mice aged under standard conditions (30M_WT), as well as under RM (30M_RM) or CR (30M_CR) treatment. The sequenced RPFs conformed to expectations34, both in terms of length (28–30 nucleotides; Fig. 1b) and 3-nucleotide periodicity of the P-sites inferred from reads (Fig. 1c, Supplementary Fig. 1). On average, the vast majority of reads from a sample mapped to coding regions, 9% mapped to 5′UTRs and 4% to 3′UTRs (Fig. 1d). Altogether, these quality metrics indicate samples consist of reliable ribosome footprints. We further verified sample quality by correlating protein levels, determined by mass spectrometry (intensity-based absolute quantification, iBAQ), with the density of RPFs on the respective mRNAs. RPF density correlated relatively well with protein levels (Pearson and Spearman correlation coefficients ~0.6, Supplementary Fig. 2), more so than did the mRNA levels (Supplementary Fig. 2). That ribo-seq provides protein output data that is well correlated with but more comprehensive than mass spectrometry (~10,000 translated mRNAs vs. ~4000 quantified proteins, depending on the sample) emphasizes the utility of the method in exploring a tissue’s translational landscape.
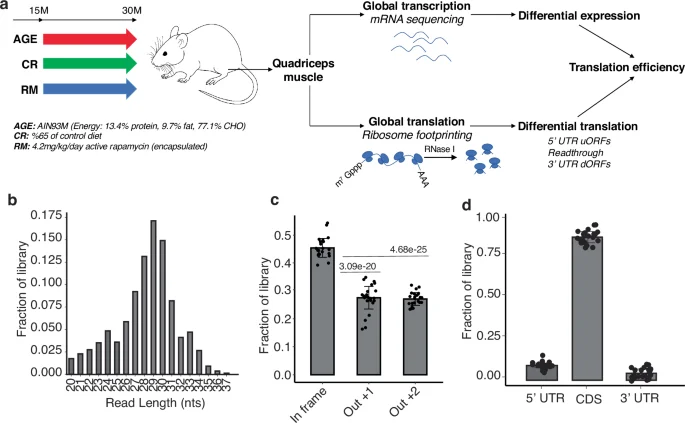
a Singly caged male C57BL/6JRj mice were maintained from 15 to 30 months of age in either standard laboratory conditions or treatment with RM or 35%CR and compared with 10-month-old adult mice. The Quadriceps femoris muscle was analyzed by both RNA-seq and ribo-seq. Mouse figure was created with BioRender.com. b Length distribution of ribo-seq reads from all sequenced samples. c The offset of P-sites in reads of individual lengths (in the range of 11–13 nts) was first determined, and then all reads were registered using these offsets. The proportion of reads associated with each of the 3 reading frames was then calculated. Each dot represents one sample, the height of the bar is the average over samples, and the standard deviations are also indicated. Two-sided Student’s t-test was used to calculate p-values. d Relative proportion of reads in a sample mapping to 5′UTR, CDS or 3′UTR regions of the mRNAs. Each dot corresponds to a sample, the height of the bars represents the average over samples, and standard deviations are also indicated.
Anti-aging treatments distinctly remodel the translation efficiency in geriatric muscle
Next, we quantified the translational output of each mRNA in each sample by the sample size-normalized number of RPFs associated with mRNA coding regions (Supplementary Data 1). Principal component analysis (PCA) showed that 10M_WT and 30M_RM muscles form distinct clusters, while muscles from untreated (30M_WT) or CR-treated (30M_CR) aged mice were intermixed. RM-treated samples separated from the others along the first PC, while adult muscle samples separated from aged samples, treated or not, along the second PC (Fig. 2a). For subsequent analyses, we calculated average gene expression measures (at RNA, RPF and TE levels) and compared them between 30M_WT and 10M_WT muscles (i.e., AGE effect), 30M_RM and 30M_WT (i.e., RM effect), and 30M_CR and 30M_WT (i.e., CR effect). 771 genes underwent significant changes35 in translational output during aging, while the RM and CR treatments significantly altered the translational output of 1020 and 405 genes, respectively (Supplementary Data 2). The overlap of genes changing in all conditions was small but significant (28 genes, p-value = 2.54e-34, SuperExact test36) (Fig. 2b). Only ~15% (151 of 1020) of the genes responding to RM also had a significant aging-associated change, while for CR the proportion was higher, ~25% (102 of 405, Fig. 2b). To determine how the treatment-induced changes relate to the aging-associated changes, we calculated correlation between log2 fold-changes in gene expression across pairs of conditions: CR vs AGE and RM vs AGE. Furthermore, we checked both the mRNA level and TE, and in both cases, we observed that aging-associated changes were negatively correlated with those occurring upon anti-aging treatments (Fig. 2c, d, Supplementary Fig. 3). This indicates that the treatments partially restore both the steady-state level and the TE of mRNAs. RM had a more pronounced effect than calorie restriction, in line with our previous observations of mRNA-level changes in multiple muscles17. To identify biological processes that are most impacted in these conditions, we carried out Gene Set Enrichment Analysis (GSEA), taking the KEGG pathways as gene sets. At the mRNA level, genes involved in metabolism and basic cellular processes were upregulated, while genes involved in development, intercellular communication and neuronal signal transmission were downregulated during aging (Fig. 2e). Metabolism-related changes were counteracted by RM but further exacerbated by the CR treatment, while both RM and CR mitigated the aging-associated changes in developmental and cell communication-related genes. For many KEGG categories, the changes in ribosome footprints mirrored the changes in mRNA, indicating that the regulation was largely at the level of transcription (Fig. 2e, marked as “transcriptional”). However, within signaling pathways, the TE appears to counter-balance transcriptional changes leading to minimally altered ribosome footprints (Fig. 2e, marked as “translational”). For a small cluster of KEGG categories the changes at mRNA and translation level were complex. For example, ribosome constituents and genes involved in oxidative phosphorylation exhibited a significant aging-associated reduction in TE, partially restored by RM and CR. Moreover, nucleus and mitochondria-encoded genes from the oxidative phosphorylation pathway exhibited divergent patterns of TE change upon treatment (Fig. 2f); CR almost restored the aging-induced reduction in the TE of mitochondria-encoded genes (median log2 fold-change of 0.4 in CR relative to −0.62 in aging), while RM exacerbated this reduction (median log2 fold-change: −0.79). In contrast, nuclear genes did not show a significant change in TE during aging (median log2 fold-change = −0.11), but were upregulated by CR and especially by RM (median log2 fold-change: 0.21 and 0.4, respectively). Thus, both aging and anti-aging interventions modulate the synthesis of specific categories of proteins in the Quadriceps muscle of mice, primarily at the mRNA level, and for some pathways at the level of mRNA translation. As previously observed in other muscles13, the extent of regulation of different genes in a given pathway varies substantially between treatments (Supplementary Data 2, Supplementary Fig. 4).
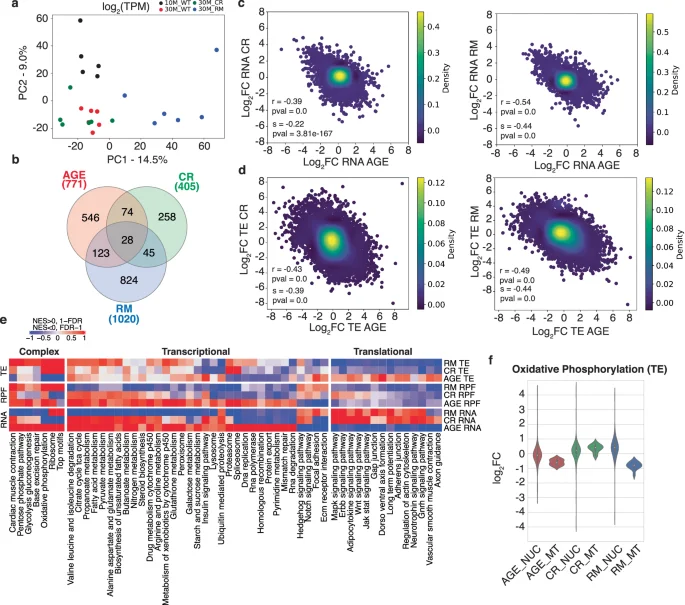
a Principal component analysis of RPF data. Each dot corresponds to one mouse. Indicated on the axes is the proportion of variance in the data that is explained by the first (PC1) and second (PC2) principal components. b Venn diagram showing the relationship between genes that show significant changes in aging, RM and CR conditions. c Scatter plot of log2 fold-changes in RNA levels in pairs of conditions. d Same as in (c) but showing changes in TE. e Gene set enrichment analysis of KEGG pathways at the level of RNA expression, RPFs and TE. The significance of the enrichment is indicated by the intensity of the color, and the values are capped at 1 (in absolute value). The direction of gene expression changes is indicated by the blue (downregulation) and red (upregulation) colors. f Log2 fold-changes in RPFs mapping to individual nuclear and mitochondrial genes from the oxidative phosphorylation pathway in different conditions.
Rapamycin remodels aging-associated changes in translation initiation
A key site of translational control, especially under stress, is the upstream open reading frames (uORFs)37,38. To determine whether uORFs play a role in TE changes in aging muscle, we examined the RPFs mapping to the 5′UTRs of annotated protein-coding genes. We found that many genes (803-2264, depending on the condition and sequencing depth, Fig. 3a, Supplementary Data 3) yielded 5′UTR-derived RPFs in all samples from a given condition, with 459 genes being covered in all 4 conditions. To control for differences in the overall gene expression levels between samples when evaluating the significance of 5′UTR-derived reads, we computed the ratio of 5′UTR- to CDS-derived RPFs for each gene in each sample. PCA of these ratios revealed that 30M_RM samples tend to separate from the others along the first principal component (Fig. 3b). The mean 5′UTR-to-CDS ratio per gene was 0.15 lower in 30M_WT than 10M_WT samples, indicating reduced ribosome density on 5′UTRs in aged muscles or, alternatively, increased density on the coding regions. CR (+0.29) and especially RM (+0.33) increased this mean ratio (Fig. 3c). The per-gene-level illustration of 5′UTR-to-CDS ratio changes revealed several distinct clusters (Fig. 3d). Cluster 1 contains genes from the proteolysis/ubiquitination, development/morphogenesis and axonal-related GO term/pathways, for which the 5′UTR-to-CDS ratio is significantly decreased upon muscle aging and restored by both RM and CR treatments (Supplementary Fig. 5). Cluster 2 contains genes related to oxidative phosphorylation, the electron transport chain, mitochondrion organization and muscle movement/cell development (Supplementary Fig. 5), whose reduction in 5′UTR-to-CDS read ratio upon aging is primarily counteracted by CR. The analogous cluster 3 contains genes whose age-related decrease in the 5′UTR-to-CDS ratio is primarily counteracted by RM. These genes are important for muscle structure and contractility (Fig. 3e). Figure 3f shows a few examples of altered 5′UTR-to-CDS ratios in different conditions39. Specifically, the carnitine O’-acetyltransferase (Crat) shows a reduced 5′UTR coverage relative to the CDS in the aged muscle, and both CR and RM treatments restore the coverage pattern of the younger muscle. In contrast, for the ribosomal protein S25 and the translation initiation factor Eif1Ax, RM induces a more pronounced reduction of the RPF density on the CDS. This likely reflects the well-known translation initiation block induced by RM40, underscoring the accuracy of ribo-seq in revealing how the translational landscape of cells is remodeled in various conditions. Two additional small clusters contain genes with increased 5′UTR-to-CDS ratios during aging that are mitigated by RM or CR. Specifically, RM reduces the ratio for some components of the mitochondria (e.g., the ribosomal protein Mrps21, the enzymes Aldoa, Ckmt2 and Ndufb11), while CR reduces the ratio for genes related to thermogenesis and oxoacid metabolic processes (e.g., Atf4, Scd1, Jph2 and Hnrnpa2b1). The RM-induced translational block was also apparent from the negative correlation (Pearson’s correlation coefficient of r = −0.63, p-value = 1.94e-12) between changes in the 5′UTR-to-CDS read ratio and in the change in CDS-derived RPFs (Fig. 3g, for WT and CR in Supplementary Fig. 6), further accompanied by the downregulation of many translation initiation factors (Fig. 3h). Thus, the long-term RM treatment appears to reduce translation, increase the relative accumulation of RPFs on 5′UTRs, and partially revert aging-induced changes in ribosome interactions with 5′UTRs.
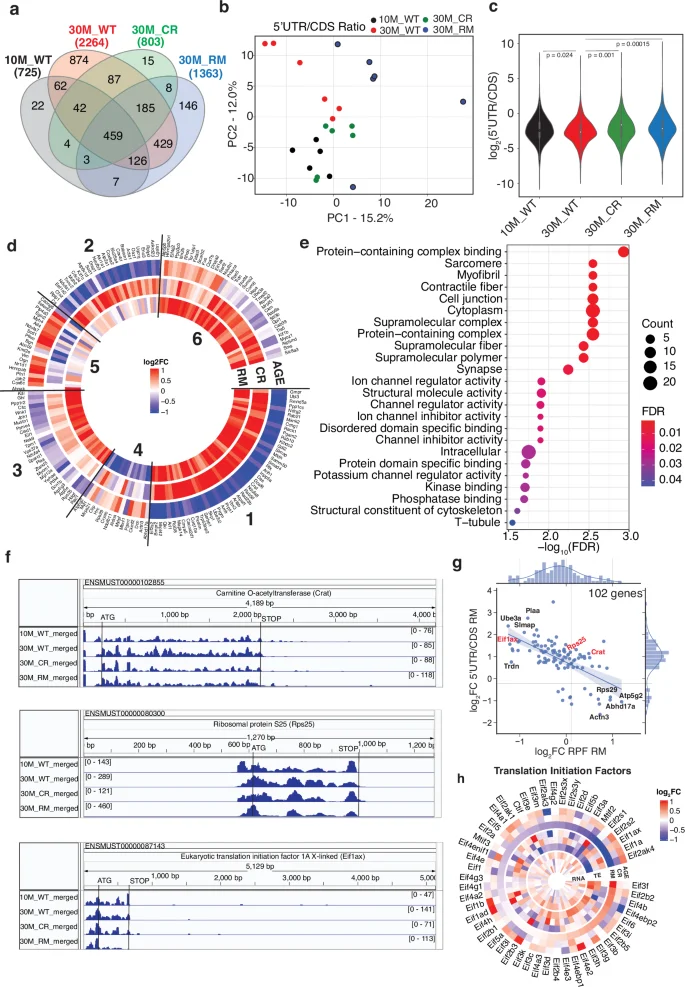
a Venn diagram showing the overlap of genes yielding 5′UTR-derived reads in all samples from individual conditions. b Principal component analysis of 5′UTR-to-CDS read ratio in all samples of all four conditions. c Violin plots showing the distribution of mean 5′UTR-to-CDS read ratios for individual mRNAs across all samples of a given condition. P-values from Mann–Whitney U-tests indicate the significance of the differences in mean values between conditions. d Changes in 5′UTR-to-CDS ratio in aging, CR and RM conditions for 173 genes that showed a significant change (p-value < 0.05, Welch’s t-test) in at least one condition; genes are sorted using K-means clustering. e Functional annotation of genes showing a significant change in the 5′UTR-to-CDS ratio in the RM condition. Only genes for which data were available in all samples and conditions (459 genes from the center of panel a) were used. f IGV39 snapshot of the Crat, Rps25 and Eif1ax genes, showing the coverage in different samples. g Scatter plot of changes in CDS-derived RPFs (x-axis) vs. changes in 5′UTR-to-CDS read ratios for the 102 genes showing a significant change in the ratio in the RM condition (p-value < 0.05, Welch’s t-test). The genes shown in panel f are highlighted in red. h Log2 fold-changes in translation initiation factor expression at mRNA, RPF and TE levels.
Calorie restriction remodels stop codon readthrough and translation downstream of CDS
We carried out a similar analysis of RPFs derived from the 3′UTRs. Fewer genes (140–275) yielded 3′UTR- compared to 5′UTR-derived RPFs in all samples of a given condition (Fig. 4a), with 72 genes being covered in all conditions. PCA of the 3′UTR-to-CDS ratio revealed the separation of 10M_WT and 30M_CR samples from all other groups along the first principal component (Fig. 4b). On individual genes, the ratio generally decreased with age in WT mice and was restored by treatments, especially CR (Fig. 4c, d). For example, the calcium-binding parvalbumin and the Hspb7 member of the heat shock family both yielded 3′UTR-derived RPFs in the 10M_WT and the 30M_CR samples, while in the 30M_WT and 30M_RM samples such RPFs were almost undetectable (Fig. 4e). Overall, genes that showed this pattern of variation in 3′UTR coverage are involved in energy metabolism and muscle contraction (Fig. 4f). The apparent loss of 3′UTR-derived RPFs in the 30M_WT and 30M_RM groups is also reflected in the meta-gene plot of normalized read coverage in the vicinity of both start and stop codons. This shows a relative enrichment of reads at the stop codon in the 30M_WT compared to 10M_WT samples and a more pronounced decrease in the 3′UTR-derived reads, partially resorted by CR (Fig. 4g). Importantly, this observation cannot be attributed to reduced sequencing depth in these samples, as read numbers were comparable across libraries (Supplementary Data 3). In contrast to 5′UTR-derived reads, we did not observe significant correlations between the 3′UTR-to-CDS ratio and protein output of the coding region (Supplementary Fig. 7). Altogether, these data indicate that non-canonical reading frames located downstream of the canonical coding region are translated in the muscle, reads derived from these regions decreasing in abundance during aging and being partially restored by CR.
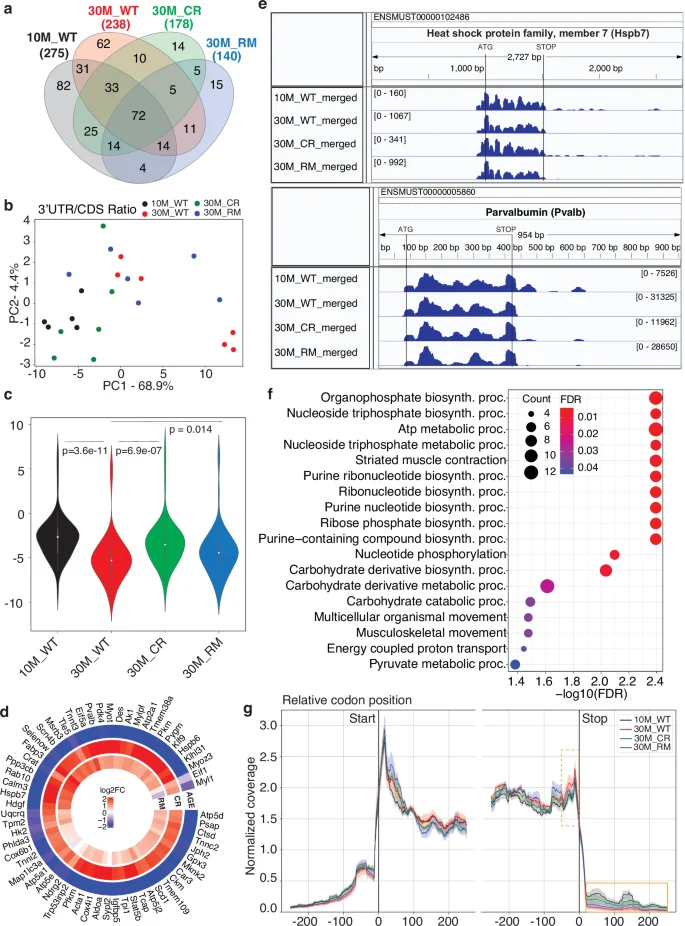
a Venn diagram showing the overlap of genes that yield 3′UTR-derived reads in all samples from individual conditions. b Principal component analysis of 3′UTR-to-CDS read ratio in all samples of all four conditions. c Violin plots showing the distribution of average 3′UTR-to-CDS read ratio for individual mRNAs across all samples of a given condition. P-values from the Mann–Whitney U-test indicate the significance of the differences in mean values between conditions. d Distribution of changes in the 3′UTR-to-CDS ratio in the three conditions (AGE, CR, RM defined in the text) for the 61 genes with a significant change (p-value < 0.05 from Welch’s t-test) in at least one condition. Scale of variation is shown in the center, with values capped at ±2 in log base 2 fold-change (4-fold increase or decrease in 3′UTR-to-CDS ratio). e IGV39 snapshots of the Hspb7 and Pvalb genes, showing the coverage in the different types of samples. f Functional annotation of genes that show a significant change in 3′UTR-to-CDS ratio in the CR condition, among the genes for which data were available in all samples and all conditions (53 of the 72 genes from the center of panel a). g Meta-gene plot showing the normalized gene coverage around start and stop codons. For each gene, the RPF counts mapping to each nucleotide within a window of ±200 nucleotides of the start and stop codons were normalized, and then accumulated across genes. These profiles are shown along with error bars, calculated by standard deviation across the samples from the same cohort. Highlighted are the region before the stop codon (orange dashed line) and the 3′UTR region immediately downstream of the stop codon (orange full line), where the largest AGE and CR-induced coverage changes are observed.
Mass spectrometry confirms the expression of non-canonical peptides
To assess whether the RPF redistribution patterns induced by CR and RM are reflected in the proteome, we carried out mass spectrometry analysis of the Quadriceps muscle from all cohorts of mice included in our analysis. We prepared samples from total lysates, from polysome as well as size-separated small peptide fractions (Fig. 5a). We further re-analyzed mass spectrometry (MS) datasets available in the PRIDE database41 (see “Methods”). As the protein identification by MS relies on protein databases, we augmented the reference Uniprot database42 with peptides predicted from 5′ and 3′UTR regions where RPFs were detected, corresponding to upstream/downstream open reading frames (uORFs/dORFs), and stop codon readthrough. We selected the candidates stringently, requiring evidence of frame bias of the RPFs for peptide prediction (see “Methods”). By searching the spectra obtained in multiple MS experiments against this augmented database, we reproducibly identified peptides derived from 98 uORFs, 55 dORFs and 23 stop codon readthrough regions. These were detected in more than one dataset at a false discovery rate cutoff of 0.01 using the Fragpipe analysis software43. Figure 5b–d shows the proteins and specific peptides with the highest total spectral count across all datasets (>10 spectra for u/dORFs and 5 spectra for readthrough peptides). From the distributions of RPF densities (Fig. 5e–g), we can infer that u/dORFs are expressed at similar levels as the main ORF, while the stop codon readthrough regions display a ~ten-fold lower expression than the main ORFs. Importantly, products of stop codon readthrough translation that we predicted from 3′UTR-derived RPFs are not encoded by any annotated protein-coding isoform of the corresponding genes, arguing against these RPFs originating in canonical coding regions of splice variants. The density of RPFs on the main coding regions of mRNAs yielding readthrough peptides was similar to that on mRNAs not yielding such products (Supplementary Fig. 8). Altogether, these analyses confirm the presence of readthrough peptides inferred from ribo-seq data, further identifying the reading frame of stop codon readthrough translation.
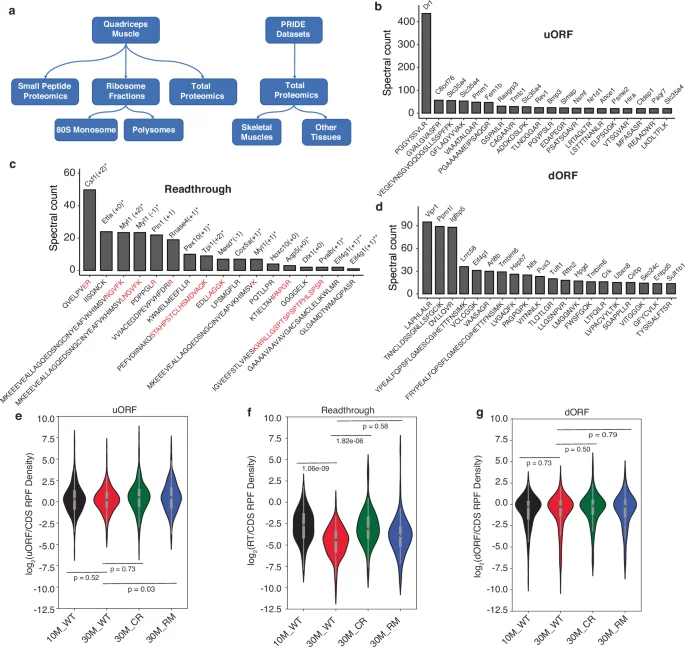
a Schematic representation of the analyzed data. b uORFs identified in most analyzed datasets. The gene from which they derive is shown at the top of the column and the sequence of the peptide below. The y-axis gives the total spectral count of the respective peptide. c Same as in (b) for stop codon readthrough peptides (reading frame indicated in parentheses). Asterisks indicate readthrough peptides that map partially to the canonical coding region and partially to the 3′UTR (highlighted in red are the non-canonical C-terminal extensions) or represent the first possible tryptic peptide after the canonical stop codon. Further downstream peptides are shown without asterisk. Double asterisk indicates evidence of multiple non-overlapping peptides for the same gene and same readthrough reading frame from separate datasets. d Same as in (b) for dORFs. e Distribution of expression levels of uORFs relative to the main ORFs across conditions. f Same as in (e), for stop codon readthrough. g Same as in (e), for dORFs.
We also intersected the set of non-canonical peptides we inferred from our data with a recently published metamORF database of curated small open reading frames44. Strikingly, despite the similarly high RPF density in u/dORFs relative to the main CDS, 39% of the uORFs identified in our study are also present in metamORF, but only 1% of the dORFs. The reason for this discrepancy is currently unclear. Our data thus provide multiple lines of evidence for non-canonical translation products, the majority of which have not been reported before. In addition, our data shows how these translation products are altered by aging and anti-aging interventions.
CR restores translation of lncRNA-derived peptides
While long non-coding RNAs (lncRNAs) do not generally undergo translation45,46,47, a few have been found to encode small peptides (less than 100 amino acids) in various tissues, including muscle (reviewed in ref. 47). To validate our data and provide further evidence for the translation of small peptides with functional relevance for the muscle, we asked whether any of the known myokines is represented in our data. Indeed, as shown in Fig. 6a, we found evidence of translation for a number of myokines. Their translation output, given in terms of RPF density along the ORF, varies quite widely within individual cohorts of mice. Despite the variability, Fndc5 and Sparc have significantly reduced expression in aged muscle (Fig. 6a), the first restored by the anti-aging treatments, especially CR, the second one insensitive to the treatments. We also checked for lncRNA-derived peptides previously found relevant for muscle function, such as SPAR, which regulates the amino acid release from lysosomes and hinders the mTORC1-dependent muscle regeneration48, myoregulin49 and DWORF50, which regulate calcium release from the sarcoplasmic reticulum. While our ribo-seq data confirms the synthesis of these peptides (Fig. 6b), they do not appear to be sensitive to aging or anti-aging treatments. We note that since their initial discovery, the annotation of the corresponding RNAs has been updated, and they are found among the protein-coding genes in databases such as Uniprot and Ensembl.
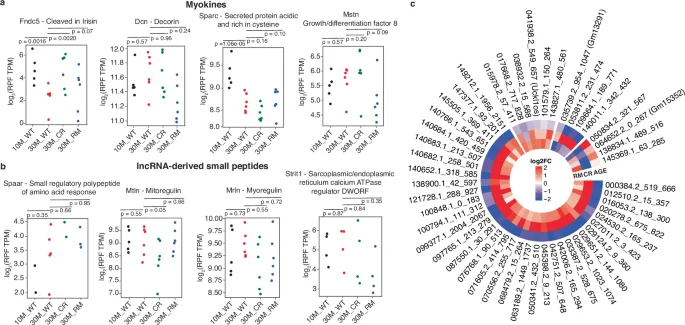
a Myokine expression in samples from different conditions. Each dot represents a sample. P-values are from the Wald test from Deseq2 R package35. b Small peptides derived from transcripts initially annotated as lncRNAs. c Pattern of lncRNA-encoded ORF expression in age, CR and RM treatments. The heatmap shows the log2 fold-change in RPF numbers for the indicated lncRNAs from the noncode database (version 6)51. Shown is the numerical identifier of the lncRNA in the database, the start and end position of the ORF within the lncRNA. Only ORFs that have a significant change (p-value < 0.01, 50 lncRNAs) in at least one condition are represented.
To determine whether our data provides evidence of translation for additional lncRNAs, we mapped the ribo-seq reads that did not match annotated mRNAs to lncRNAs from the noncode database (version 6)51. Surprisingly, we found that we can thus account for 10% of these reads, and, with the same selection criteria as before, i.e., the presence of start/stop codons and evidence of frame bias, we identified 252 potential peptide-encoding lncRNAs. MS datasets provide evidence for 32 of these peptides, derived from 28 lncRNAs, 5 of them being supported by data from at least 2 datasets (Supplementary Data 4). One such peptide derives from PARTICLE (promoter of MAT2A-Antisense RadiaTion Induced Circulating LncRNA), a lncRNA involved in histone and DNA methylation52. The 8 amino acid-long peptide derived from this lncRNA was not reported before, though it is represented in 2 independent datasets that we have analyzed (Supplementary Data 4). Another 8 amino acid-long peptide derives from the Gm45923 (MUNC) lncRNA, previously described as an enhancer RNA for the Myod1 gene (DDReRNA). The lncRNA was implicated in muscle cell differentiation and skeletal myogenesis53,54, but the peptide was not reported before. We further used the ribo-seq data to estimate the change in expression of lncRNA-associated ORFs between conditions (Fig. 6b, c). Interestingly, among lncRNA-encoded ORFs with a significant expression difference in at least one condition, there is a strikingly consistent pattern, whereby most of these ORFs have reduced expression upon aging, a change which is counteracted by the treatments, primarily CR (Fig. 6c). This analysis re-emphasizes the increased sensitivity of ribo-seq compared to mass spectrometry and suggests that our set of 252 lncRNAs contains additional bioactive molecules.
Regenerative processes are activated in aging muscle and by anti-aging treatments
It has been previously described that regenerative processes are activated, but ultimately inadequate, in old skeletal muscle due to age-related deterioration in skeletal muscle stem cells and their niche55. Intriguingly, one of the translational readthrough targets, Pvalb, was found to play a key role in the response of the muscle to denervation, by regulating the uptake of Ca2+ in mitochondria and the expression of the pro-hypertrophy gene PGC-1α456. We therefore asked whether our interventions also altered age-related markers of muscle regeneration. Nascent muscle fibers transiently express an embryonic form of myosin heavy chain (eMHC) before transitioning to express their mature myosin heavy chain isoform (e.g., Myh4 in fast IIB fibers). This allows newly regenerated fibers to be identified via immunostaining.
In cross sections of QUAD muscles from 30M_WT mice, the proportion of fibers expressing eMHC was significantly higher than in 10M_WT mice, where eMHC+ fibers were virtually absent (Fig. 7a, b). While the proportion of eMHC+ fibers tended to be reduced by the CR treatment, the RM treatment approximately doubled the eMHC+ fiber prevalence compared to 30M_WT mice. In all cases, eMHC+ fibers were markedly smaller than surrounding fibers expressing mature myosin heavy chain isoforms (Fig. 7a) and comprised just a tiny fraction of total fiber number. While eMHC+ fibers represent acute signs of regeneration, an indication of the cumulative occurrence of muscle fiber regeneration events can be gleaned by the appearance of centrally nucleated muscle fibers. Centralized myonuclei are a well-established hallmark of muscle fiber regeneration in adult muscle and were recently shown to occur as a result of myocyte fusion within the shrunken residual basement membranes of damaged myofibers during the repair process57. Importantly, central nucleation in regenerated muscle fibers appears to be permanent, remaining more than 6 months after injury in mice57,58. The proportion of centrally nucleated fibers quantified in vastus medialis was markedly higher in 30M_WT (12.0%) than 10M_WT (3.4%) mice but not significantly affected by CR or RM treatments (Fig. 7c, d). Together, these results indicate that at very high age, the acute regeneration of fast fibers is suppressed by CR and accentuated by the RM treatment. Differences in regenerating fiber prevalence could stem from differences in the extent of tissue damage or the magnitude and duration of regenerative responses59. While we have previously demonstrated that CR and RM attenuate skeletal muscle aging13,17, mTORC1 activity is also important for efficient muscle regeneration48, and CR has been shown to have both beneficial20 and inhibitory effects21 on regenerative responses to muscle injury. As such, further work is needed to elucidate the interplay between the age-related activation of muscle regenerative processes and the multi-modal influences of CR and RM, particularly at the level of protein synthesis in various cell types.
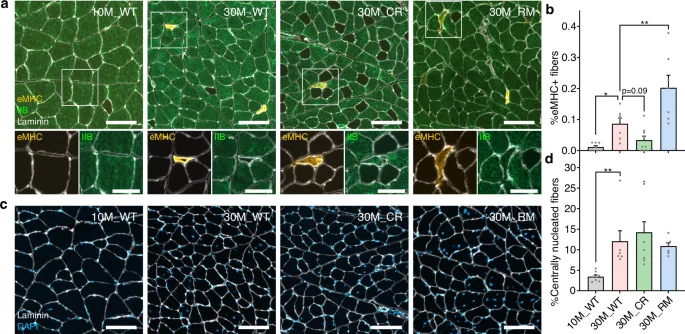
a Representative images of immunostaining of quadriceps muscle cross sections for embryonic (eMHC) and mature fast-type IIB myosin heavy chains as well as laminin to outline muscle fibers. Unstained (black) fibers represent slower-type I, IIA and IIX muscle fibers and are more prevalent in 30M_CR mice due to a fast-to-slow fiber-type switch, as we have previously described17. Scale bar is 100 μm in the top row and 50 μm in the bottom row. b Proportion of eMHC+ fibers in whole quadriceps muscle cross sections (Supplementary Data 5). c Representative images of quadriceps muscle cross sections stained with laminin and DAPI. Scale bar is 100 μm. d Proportion of muscle fibers with centrally located nuclei, a marker of muscle fiber regeneration. Data are mean ± standard error (SE) (Supplementary Data 5). The 30M_WT group was compared with each other group via one-way ANOVA with Holm–Sidak post hoc tests (b) or Kruskal–Wallis test with Dunn’s post hoc tests (d).
Discussion
Perturbed proteostasis is a well-known hallmark of aging60. Consistently, we recently found that the increased activity of mTORC1, a master regulator of ribosome biogenesis and protein synthesis, can itself be considered a hallmark of aging in skeletal muscle13. Anti-aging treatments such as rapamycin and calorie restriction partly restore muscle functionality and global protein synthesis rates25,26, but their impact on the translational landscape of the muscle was unknown. Our study fills this gap, identifying and quantifying the output of canonical and especially non-canonical translation units in the skeletal muscle of mice aged under standard laboratory conditions, or under long-term treatment with CR or RM. At the functional level, these treatments have been found to have muscle-specific and partially additive effects, with the Triceps brachii responding more to RM and Soleus to CR13,17. The Quadriceps femoris muscle is strongly affected by age, and both interventions alleviate age-dependent reductions in relative mass17, prompting the question of whether they do so by targeting similar translational targets. The large size of QUAD allows the collection of the necessary datasets to investigate translational control. We also note that while our study focused on the QUAD, the data expands the growing atlas of mRNA-level gene expression in muscles of untreated or CR/RM-treated aged mice. As was the case with other muscles17, RM and CR have both shared and specific mRNA targets in the QUAD (Fig. 2e).
The protein output measured by RPF density along ORFs varied substantially across conditions, and most of this variation came from changes in mRNA-level expression rather than TE (Fig. 2e). Significant TE changes were localized to specific pathways such as oxidative phosphorylation, where we further observed divergent responses of nucleus and mitochondria-encoded genes: TE of mitochondrial-encoded genes decreased at high age and was reverted by CR only, while RM upregulated the TE of nuclear genes from this pathway (Fig. 2f). The downregulation of mitochondrial genes could be due to age-related mitochondrial dysfunction61, which has also been observed in the human muscle, where the translation of mitochondrial proteins is reduced62. Conversely, CR was reported to improve mitochondrial efficiency in humans63.
Our data revealed unexpected patterns of translation outside canonical protein-coding regions, in 5′ and 3′ UTRs, which could not be attributed to sequencing depth artifacts (Supplementary Fig. 9). To control for changes in mRNA abundance when assessing 5′/3′UTR-derived RPF variation between conditions, we analyzed the 5′UTR-to-CDS read ratio. This ratio decreased with age, a change that was mitigated by the treatments, especially RM (Fig. 3c). The increased 5′UTR-to-CDS ratio in the RM condition was at least partly due to a translation initiation block, indicated by the reduced expression of multiple subunits of translation initiation factors 1 and 2 (Fig. 3h). We also observed an upregulation of the Eif3f subunit, which was reported as inhibitory for translation in proliferating cells64, though another study reported an activation effect in the muscle65. The translation block was reflected in RPF accumulation on the 5′UTR relative to the main ORF (Fig. 3f) as well as the reduced translation output of the latter, which could be a consequence of the translation inhibitory effect of uORFs (Fig. 3g). Indeed, we identified 7704 uORFs with ribosome footprints in our ribo-seq data, 98 of which are supported by mass spectrometry evidence from multiple datasets. The protein output predicted from the RPFs along these uORFs was comparable to that of the main ORFs and, in RM/CR conditions, even higher. Furthermore, of the 7704 ribo-seq-supported uORFs, a high proportion, 39%, are also present in the metamORF44 database of small ORFs. The uORF with the most extensive mass spectrometric evidence comes from the gene Downregulator of Transcription 1 (Dr1), which is translationally regulated by Proline-rich coiled-coiled 2 proteins that promote leaky scanning66. The significance of this regulation or of the small peptide generated from this uORF in the context of aging remains to be evaluated.
Perhaps the most unexpected observation was the pattern of variation of RPFs captured downstream of stop codons. Recent studies have started to report peptides generated by either stop codon readthrough67 or (re)initiation on dORFs68. Here we provide ribo-seq and mass spectrometric evidence for the existence of such peptides and further establish that translation downstream of stop codons is reduced in aging skeletal muscle and restored by CR, indicating they may play functional roles. 55 dORFs and 23 readthrough peptides are supported by multiple mass spectrometry datasets. The capture of readthrough peptides is especially remarkable since their expression levels inferred from RPFs are at least 10-fold lower than expression levels of the corresponding main ORFs (Fig. 5f). This is not the case for dORFs, which are expressed at comparable levels to the main ORF. Although dORFs have been reported to enhance translation69—in contrast to uORFs which are generally inhibitory70—we did not observe a positive correlation between dORF and main ORF expression here (Supplementary Fig. 7). The dORFs with mass spectrometric evidence come from genes involved in metabolism, development and signaling. However, they did not exhibit significant levels of evolutionary conservation measured by the PhyloP score71 (not shown).
An age-dependent redistribution of RPFs away from start codons and toward stop codons was reported previously32. While our meta-gene analysis supports the accumulation of ribosomes upstream of the stop codon in 30 M compared to 10 M samples (Fig. 4g), we found the most significant change in coverage to occur not in the CDS, but rather downstream, in the 3′UTR, where the density of reads decreases upon aging, a change mitigated by CR. What could be the significance of these reads? Translation readthrough has been described for some genes, requiring an extended sequence context and generating protein isoforms with specific patterns of localization within cells72,73,74. A number of metabolic enzymes such as lactate and pyruvate dehydrogenase, as well as triosephosphate isomerase, acquire peroxisomal-targeting sequences via readthrough72,74,75, while expression of mitochondrial carrier homolog 2 (MTCH2) protein is autoregulated via stop codon readthrough with important consequences for mitochondrial membrane potential76. The water channel aquaporin 4 (Aqp4) also has a translational readthrough isoform, specifically localized at astrocyte endfeet77, where it regulates the waste clearance at the brain-blood barrier78. While we did not observe an enrichment of the readthrough-permissive UGA stop codon79 in genes with evidence of readthrough relative to those without (Supplementary Fig. 10), the readthrough isoforms reflect the functional themes that have been observed before. For example, the candidates with the strongest proteomics evidence include the triosephosphate isomerase74, peroxisome and mitochondria-related proteins (Pex10, Etfa), and other proteins that localize to membrane-delimited compartments. Interestingly, while the MS-validated dataset did not include Aqp4, it included a homolog, Aqp5. Aside from the prior data studies supporting the functional relevance of stop codon readthrough isoforms, our study provides multiple lines of evidence for their existence. Generally, it is unlikely that 3′UTR-derived RPFs result from faulty translation, as their frequency would be expected to increase rather than decrease with age, as we observe here. Furthermore, they do not seem to be artifacts of systematic library size differences, whereby 3′UTR-derived reads would be detected in libraries sequenced more deeply. Instead, our results are more in line with reports of senescence, which affects an increasing number of cells as organisms age80, inhibiting both basal translation readthrough and aminoglycoside-induced readthrough81. Another potential origin of apparent readthrough peptides could be alternative splice forms, in which the respective genomic regions are part of coding exons. This was also not the case in our data, because an exhaustive search of respective peptides in all annotated transcripts did not yield any match. Thus, our data indicate that 3′UTRs encode as yet unannotated peptides sufficiently stable to be detected, both by ribosome footprinting and mass spectrometry. Moreover, evidence for these peptides can also be found in other datasets within the PRIDE database41. Interestingly C-terminal extensions resulting from stop codon readthrough tend to destabilize proteins or localize them to membranes82. In our study, structural muscle proteins showed evidence of translation readthrough in animals of younger age. This suggests that these isoforms may interact with membranes to modulate muscle functionality, an interaction that is perturbed in sarcopenic muscles and partially restored by CR. Interestingly, while regenerative processes are activated in all of the aged muscles, newly regenerated eMHC+ fibers are less frequent in the 30M_CR compared to 30M_WT and 30M_RM muscles, while the muscle undergoes a fast-to-slow fiber-type switch17. Our study provides new leads toward deciphering the dynamics of structural muscle proteins in relation to age-dependent regenerative processes.
A number of studies have uncovered short peptides (less than 100 amino acids, sometimes referred to as micropeptides) derived from transcripts initially thought to be non-coding, and many of these are muscle-specific47,83. For example, phospholamban and sarcolipin regulate the contraction of cardiac and skeletal muscle by interacting with the sarcoplasmic reticulum Ca2+ ATPase84,85. Other microproteins regulate the mitochondrial function, e.g., mitoregulin, also involved in β-oxidation86,87, and the unfolded protein response, e.g., the PIGBOS peptide88. Our ribo-seq data provided evidence for many of the known micropeptides, but only some, specifically myokines, were detected by mass spectrometry. This could have a variety of reasons, from the lower sensitivity of the MS technology, to challenges in detecting membrane-associated proteins. The non-canonical translation products that we identified in ribo-seq data may pose similar challenges for mass spectrometry-based detection, which could explain why we only found peptide evidence for 28 of the 252 translated lncRNA. Nevertheless, this large set of candidates that we stringently selected could represent entry points for studying so-far-unsuspected regulatory mechanisms in the complex muscle tissue.
To conclude, our study reveals the translation dynamics during aging and anti-aging interventions in skeletal muscle, demonstrating intervention-dependent redistribution of ribosome footprints on 5′ and 3′ untranslated regions. We expand the gene expression atlas of aging mouse muscles with data for Quadriceps femoris, a muscle whose relative mass is improved by both RM and CR. While RM primarily blocks translation initiation, thereby reducing protein synthesis, CR improves the functionality of mitochondria. A large proportion of the uORFs we identified here are also represented in another database of small ORFs, indicating that they undergo robust translation. Of these, 98 uORFs are supported by mass spectrometric evidence from multiple datasets, further indicating that they generate small peptides with functions that remain to be characterized. In metabolic enzymes and muscle structural proteins, we identified translational readthrough events that are detectable in younger muscles and are promoted by CR, suggesting they could be part of the mechanism by which CR imparts its beneficial effects on muscle function. Our data thus provides a large resource for non-canonical translation units whose changes during aging are restored by anti-aging interventions. Characterizing their functions will advance our understanding of translational control to improve healthy aging.
Methods
Animal care
All procedures were performed in accordance with Swiss regulations for animal experimentation and approved by the veterinary commission of the Canton Basel-Stadt. Male, C57BL/6JRj mice from a previous aging study13,17 were purchased from the aging colony at Janvier Labs (Le Genest-Saint-Isle, France). For all studies, mice were kept in single cages under a fixed 12 h light-dark cycle (6 a.m. to 6 p.m.) at 22 °C (range 20–24 °C) and 55% (range 45–65%) relative humidity and were acclimatized to individual housing (due to the calorie restriction group) and the control diet for 3–4 weeks before the start of the experiment. In the week immediately prior to starting the experiment, body mass, food intake, grip strength, and body composition (via EchoMRI) were measured and used for balanced group selection. Ten-month-old mice were used as an adult control (10M_WT), while 15-month-old mice received either a control AIN-93M diet (TestDiet) containing Eudragit (vehicle) ad libitum (30M_WT), a calorie-restricted diet (30M_CR; 65% of standard diet without restricting vitamins and minerals) or a diet containing 42 mg/kg chow active encapsulated (Eudragit) RM (30M_RM) from the age of 15–30 months. Based on measured food intake, mice received an RM dose of 4.2 mg/kg body mass/day. Prior to tissue collection, food was removed from the cages in the early morning. Mice were deeply anesthetized with a sub-lethal dose of pentobarbital (80–150 mg/kg) and subsequently sacrificed by cervical dislocation. Death was assured by removing the heart. Quadriceps muscles were rapidly dissected and snap-frozen.
Ribosome profiling (ribo-seq)
The method for ribosome-protected fragment sequencing was adapted from ref. 89 and ref. 90. The detailed protocol was as follows.
Lysate preparation
Snap-frozen quadriceps muscles from various mice cohorts were lysed in cryogenic conditions in 2.5 ml lysis buffer (20 mM Tris-HCl, pH 7.5 (Sigma, T294), 100 mM NaCl (Sigma, 71386), 10 mM MgCl2 (Sigma, 63069), 2 mM DTT (Sigma, 646563), 1% Triton X-100 (Sigma, T8787), and 100 μg/ml cycloheximide (Sigma, G7698), 500 U/ml RNase inhibitor RNasin Plus (Promega, N2615), Protease inhibitor, DNase) using a freezer mill (Spex) with machine setting “Pre-cool: 2 min, Run time: 2 min, Cool time: 2 min, Cycles: 3, Rate: 15 CPS”. Lysate in powdered form was collected and thawed at 4 °C for 1 h with continuous rotation, then triturated through 18G and 26G-needle several times and centrifuged at 20,000 × g for 10 min at 4 °C. The supernatant was collected and the optical density (OD) of the lysate at A260 was measured with a NanoDrop2000. For ribo-seq, 800 µl lysate was subjected to RNase I digestion (2.5U per OD; Invitrogen, AM2294) at 22 °C for 20 min with continuous rotation at 800 rpm in thermoblock (Eppendorf). The RNase I was inactivated by adding 10 µl of RNase inhibitor SuperaseIN (Invitrogen, AM2696).
Sample loading on sucrose gradient
A linear 10–50% sucrose gradient was prepared using a Gradient Master instrument (Biocomp) according to the manufacturer’s instructions. In brief, 10 and 50% sucrose (Sigma, 84100) solutions were prepared in gradient buffer (50 mM Tris-HCl, 50 mM NH4Cl (Sigma, 09718), 12 mM MgCl2 0.5 mM DTT, 100 µg/ml CHX and 10 µl SuperaseIN). A 14 × 89 mm tube (Beckman Coulter, 331372) (used in rotor SW-41/TH-641) (Beckmann Coulter) with a long cap that can hold 800 µl of sample was used to prepare the gradient. First, the 10% solution was laid in the tube, then the 50% solution was under-laid with the help of a long syringe. The gradient was prepared by using a pre-program for 10% to 50% sucrose gradient in Gradient master 108 instrument. The gradient was cooled down at 4 °C for a minimum of 1 h. Undigested (for polysome profile) and digested samples (for ribo-seq) were loaded onto pre-cooled 10–50% sucrose gradient and centrifuged in ultracentrifuge at 35,000 rpm for 3 h at 4 °C in a TMT41.14 swing-out rotor (KONTRON instruments, Augsburg, Germany). Finally, all gradients were monitored and gradient was collected in 400 µl fractions in Eppendorf tubes containing 40 µl of 1% SDS with the help of a gradient fractionator (BR-188, Brandel, Gaithersburg, MD, US) with the setting of pump speed of 0.75 ml per min and a collection time of 32 s per tube. The UV absorbance was recorded concomitantly at a sensitivity setting of 1.0 at 254 nm, and the absorbance spectrum was plotted with the PeakChart software (Brandel).
Isolation of ribosome-protected RNA and sequencing library preparation
The fractions containing 80S monosomes were processed for sequencing library preparation. In brief, RNA was isolated from the monosome fraction with the hot phenol method. RNA fragments of 28–32 nucleotides were obtained by running samples on 15% polyacrylamide denaturing TBE-Urea gel and visualized by SYBR Gold dye (Life Technologies). The size-selected RNA was dephosphorylated by T4 polynucleotide kinase (PNK, New England Biolabs, B0201S) treatment for 1 h at 37 °C. PNK was heat-inactivated, and RNA was purified using the phenol chloroform method and overnight precipitation of RNA in ethanol. An RNA amount equivalent to 12 ng was used to prepare the sequencing library using SMARTer® smRNA-Seq Kit for Illumina® (Takara 635031) according to the kit manual till cDNA synthesis. After cDNA synthesis, rRNA was depleted by using the protocol and probes defined in ref. 29, and a final PCR was done according to Smarter kit with multiplexing barcodes. The PCR product was purified on 8% native polyacrylamide TBE gel and sequenced on a NextSeq 500 instrument at the genomic facility Basel.
Analysis of ribosome profiling (ribo-seq) data
Reads from fastq files were trimmed with fastx_clipper from FASTX-Toolkit version 0.0.14 with parameters ‘-a (3′adapter) AAAAAAAAAA, -l (minimum-length) 20, -c (discards non-clipped sequences) and -n (discards sequences with unknown (N) nucleotides)’. The trimmed reads were further trimmed with fastq_quality_trimmer from the same toolkit with -t (minimum quality) 20, -Q (quality type) 33. Then the trimmed reads were filtered with fastq_quality_filter from the same toolkit for read quality with the following parameters: ‘-q (minimum quality) 20, -p (minimum percent of bases that must have [-q] quality) 90’, -l (minimum-length) 20. These reads were first aligned to ribosomal RNA (rRNA) sequences obtained from Mus musculus ribosomal DNA (rDNA), complete repeat unit (https://www.ncbi.nlm.nih.gov/nuccore/bk000964) using Segemehl91 version 0.2.0. The reads that did not map to rDNA were then aligned to the longest coding transcripts for each gene identified from Mus musculus GRCm38–mm10 genome assembly, Ensembl 99 annotation using Segemehl. The uniquely mapped reads from this alignment were used for downstream analysis.
Analysis of RNA sequencing (RNA-seq) data
Single-end reads from raw fastq files were processed using ZARP92 workflow with the default parameters, Mus musculus GRCm38–mm10 genome assembly, Ensembl 99 annotation, 3′ adapter ‘GATCGGAAGAGCACAC’, ‘SR’ for library type (strand-specific reads coming from the reverse strand). The kallisto93 (version 0.46.2) output of ZARP workflow was used for downstream analysis.
Analysis of differential expression, translation and translation efficiency
Differential expression (RNA-seq) and differential translation (ribo-seq) analyses were performed using the Deseq2 R package35 version 1.34.0 with default parameters. The deltaTE94 procedure was applied for differential translation efficiency analysis using the reads mapped to coding sequence (CDS) regions obtained from GRCm38–mm10 genome assembly, Ensembl 99 annotation both for RNA-seq and ribo-seq libraries. Rsubread95 R package version 2.8.2 was employed to obtain the RNA-seq reads aligned to CDS regions. An in-house algorithm was used to obtain the ribo-seq reads mapped to CDS regions based on their estimated P-sites.
Gene Ontology (GO) analysis
The ClusterProfiler96 R package version 3.18.1 was used for all the GO term analyses reported in this study. ComplexHeatmap96,97 version 2.6.2 and circlize98 version 0.4.15 R packages were used to construct the heatmaps. InteractiVenn99 was used for Venn diagrams.
Identification of small open reading frames (sORFs) and readthrough peptides (RTs)
To identify non-canonical translation products (sORFs and RTs), we employed an in-house developed tool that first identifies all alternative start and stop codons on all possible frames of untranslated regions (UTRs) of all transcripts. It then checks the RPF coverage (P-site) within those regions and uses the non-parametric Wilcoxon rank-sum test to assess the differences in apparent use of possible frames and generates peptide sequences based on the dominant frame (p-value < 0.05, for comparisons between dominant and alternative frames). If the number of actively used P-site positions along a candidate sORF is smaller than 5, the tool accepts this candidate sORF as a possible non-canonical translation product if the number of RPFs assigned to the dominant frame is at least 2 times higher than the other 2 alternative frames. Finally, the tool appends all the putative non-canonical peptides to the standard protein database for the organism of interest for further use in the analysis of LC-MS-based proteomics data.
LC-MS-based proteomics analysis
Samples were lysed in 100 μl of lysis buffer (8 M Urea/0.1 M ABC, 5 mM TCEP buffer) using strong sonication (Pixul, 20 min, active motif). Samples were incubated for 60 min at 37 °C, followed by the addition of iodoacetamide at a final concentration of 10 mM and incubation at RT in the dark for 30 min. Subsequently, protein concentration of each sample was determined by tryptophan fluorescence. For peptidomics analysis, sample aliquots containing 100 μg of total protein were TCA precipitated according to a protocol originally from Luis Sanchez (https://www.its.caltech.edu/~bjorker/TCA_ppt_protocol.pdf) as follows. One volume of TCA was added to every 4 volumes of sample, mixed by vortexing, incubated for 10 min at 4 °C, followed by collection of precipitate by centrifugation for 5 min at 23,000 × g. The supernatants containing the peptides were collected and stored for peptide clean-up. The protein pellets were discarded. For proteomics analysis, sample aliquots containing 50 μg of proteins were diluted 1:4 (v:v) with 0.1 M ammonium bicarbonate buffer to a final urea concentration of 1.6 M. Then, sequencing-grade modified trypsin (1/50, w/w; Promega, Madison, Wisconsin) was added, and proteins were digested for 12 h at 37 °C shaking at 300 rpm. Digests and TCA supernatant peptide samples were acidified (pH < 3) using TFA and desalted using iST cartridges (PreOmics, Martinsried, Germany) according to the manufacturer’s instructions. Peptides were dried under vacuum and stored at −20 °C.
For polysome samples, aliquots of 0.4 μg of total peptides were subjected to LC-MS analysis using a dual-pressure LTQ-Orbitrap Elite mass spectrometer connected to an electrospray ion source (both Thermo Fisher Scientific) and a custom-made column heater set to 60 °C. Peptide separation was carried out using an EASY nLC-1000 system (Thermo Fisher Scientific) equipped with an RP-HPLC column (75 μm × 30 cm) packed in-house with C18 resin (ReproSil-Pur C18–AQ, 1.9 μm resin; Dr. Maisch GmbH, Germany) using a linear gradient from 95% solvent A (0.1% formic acid in water) and 5% solvent B (80% acetonitrile, 0.1% formic acid, in water) to 35% solvent B over 50 min to 50% solvent B over 10 min to 95% solvent B over 2 min and 95% solvent B over 18 min at a flow rate of 0.2 μl/min. The data acquisition mode was set to obtain one high-resolution MS scan in the FT part of the mass spectrometer at a resolution of 120,000 full width at half maximum (at 400 m/z, MS1) followed by MS/MS (MS2) scans in the linear ion trap of the 20 most intense MS signals. The charged state screening modus was enabled to exclude unassigned and singly charged ions, and the dynamic exclusion duration was set to 30 s. The collision energy was set to 35%, and one microscan was acquired for each spectrum.
For peptide samples, 1 μg of peptides were subjected to LC-MS/MS analysis using a Q Exactive Plus Mass Spectrometer fitted with an EASY-nLC 1000 (both Thermo Fisher Scientific) and a custom-made column heater set to 60 °C. Peptides were resolved using an RP-HPLC column (75 μm × 30 cm) packed in-house with C18 resin (ReproSil-Pur C18–AQ, 1.9 μm resin; Dr. Maisch GmbH) at a flow rate of 0.2 μl min−1. A linear gradient ranging from 5% buffer B to 45% buffer B over 60 min was used for peptide separation. Buffer A was 0.1% formic acid in water and buffer B was 80% acetonitrile, 0.1% formic acid in water. The mass spectrometer was operated in DDA mode with a total cycle time of approximately 1 s. Each MS1 scan was followed by high-collision-dissociation (HCD) of the 20 most abundant precursor ions with dynamic exclusion set to 5 s. For MS1, 3e6 ions were accumulated in the Orbitrap over a maximum time of 25 ms and scanned at a resolution of 70,000 FWHM (at 200 m/z). MS2 scans were acquired at a target setting of 1e5 ions, maximum accumulation time of 110 ms and a resolution of 17,500 FWHM (at 200 m/z). Singly charged ions, ions with charge state ≥6 and ions with unassigned charge state were excluded from triggering MS2 events. The normalized collision energy was set to 27%, the mass isolation window was set to 1.4 m/z, and one microscan was acquired for each spectrum.
For total proteomics samples, 0.2 μg of peptides was subjected to LC-MS/MS analysis using an Orbitrap Exploris 480 Mass Spectrometer fitted with a Vanquish Neo (both Thermo Fisher Scientific) and a custom-made column heater set to 60 °C. Peptides were resolved using an RP-HPLC column (75 μm × 30 cm) packed in-house with C18 resin (ReproSil-Pur C18–AQ, 1.9 μm resin; Dr. Maisch GmbH) at a flow rate of 0.2 μl min−1. Separation of peptides was achieved using the following gradient: 4% Buffer B to 10% Buffer B in 5 min, 10% Buffer B to 35% Buffer B in 45 min, 35% Buffer B to 50% Buffer in 10 min. Buffer A was 0.1% formic acid in water and buffer B was 80% acetonitrile, 0.1% formic acid in water. The mass spectrometer was operated in DIA acquisition mode with a total cycle time not exceeding approximately 3 s. For MS1, the following parameters were set: Resolution: 120,000 FWHM (at 200 m/z), Scan Range: 350–1400 m/z, Injection time: 25 ms, Normalized AGC Target: 300%. MS2 (SWATH) scans were acquired using the following parameters: Isolation Window: 11 m/z, HCD Collision Energy (normalized): 28%, Normalized AGC target: 1000%, Resolution: 15,000 FWHM (at 200 m/z), Precursor Mass Range: 400–900 m/z, Max. Fill Time: 22 ms, DataType: Centroid. In total, 100 DIA (MS2) mass windows per MS cycle followed by one MS1 scan.
The acquired raw files were converted to mzML format using ThermoRawFileParser100 and searched using FragPipe v.20.0101 with default parameters. For non-canonical peptide identification, the protein FDR filter was not applied.
Immunostaining
Sections were thawed before being fixed in 4% PFA for 10 min and washed in PBS or washed in PBS alone (fiber type stain) before being blocked and permeabilized in PBS containing 10% goat serum and 0.4% triton X-100 for 30 min. Sections were incubated for 2 h at RT (room temperature) in a primary antibody solution containing 10% goat serum, washed 4 × 10 min in PBS and then incubated in a secondary antibody solution for 1 h at RT. After incubation in secondary antibodies, sections were washed 4 × 10 min in PBS and mounted with ProLong™ Gold antifade (Invitrogen). Primary antibodies used were F1.652-B (embryonic MHC; 1:100), BF-F3 (IIB, 1:50), which were developed by Prof. Stefano Schiaffino and obtained from the Developmental Studies Hybridoma Bank developed under the auspices of the National Institute of Child Health and Human Development and maintained by the University of Iowa Department of Biology, and laminin β1γ1 (1:200; #L9393, Sigma). Secondary antibodies used were IgG1 GaM Alexa 568 (1:100; #21124, Invitrogen), IgM GaM Alexa 488 (1:100; #21042, Invitrogen), and DaRb Alexa647 (1:200; #711-605-152, Jackson). Muscle sections were imaged at the Biozentrum Imaging Core Facility with an Axio Scan.Z1 Slide Scanner (Zeiss) equipped with appropriate band-pass filters. An in-house-customized, Fiji-based version of Myosoft102,103 was used to outline fibers and count centralized nuclei.
Data availability
The ribo-seq and RNA-seq datasets are available on ArrayExpress (https://www.ebi.ac.uk/biostudies/arrayexpress) with data identifiers as E-MTAB-13568 and E-MTAB-13569, respectively. The mass spectrometry data via the MassIVE repository (https://massive.ucsd.edu, dataset identifier: MSV000093414). From the PRIDE database (https://www.ebi.ac.uk/pride/), the datasets with the following identifiers were used: PXD019356, PXD028590, PXD002156, PXD025321, PXD026821, PXD036532, PXD029379, PXD020575, PXD007697, PXD024607, PXD027332, PXD034864, PXD031079, PXD024379, PXD006764, PXD010091, PXD010507, PXD012040, PXD031797, PXD033368, PXD035446. All data supporting the conclusions of this study are provided in this published paper and its Supplementary Information files.
Code availability
The Snakemake workflow and the custom scripts for analyzing the ribosome profiling data are deposited on Zenodo with DOI: 10.5281/zenodo.10159663.
References
-
Tintignac, L. A., Brenner, H.-R. & Rüegg, M. A. Mechanisms regulating neuromuscular junction development and function and causes of muscle wasting. Physiol. Rev. 95, 809–852 (2015).
Google Scholar
-
Walston, J. D. Sarcopenia in older adults. Curr. Opin. Rheumatol. 24, 623–627 (2012).
Google Scholar
-
Swan, L., Warters, A. & O’Sullivan, M. Socioeconomic disadvantage is associated with probable sarcopenia in community-dwelling older adults: findings from the English Longitudinal Study of Ageing. J. Frailty Aging 11, 398–406 (2022).
Google Scholar
-
Bachettini, N. P. et al. Sarcopenia as a mortality predictor in community-dwelling older adults: a comparison of the diagnostic criteria of the European Working Group on Sarcopenia in Older People. Eur. J. Clin. Nutr. 74, 573–580 (2020).
Google Scholar
-
Wilson, D., Jackson, T., Sapey, E. & Lord, J. M. Frailty and sarcopenia: the potential role of an aged immune system. Ageing Res. Rev. 36, 1–10 (2017).
Google Scholar
-
Fujita, S. et al. Nutrient signalling in the regulation of human muscle protein synthesis. J. Physiol. 582, 813–823 (2007).
Google Scholar
-
Fernandes, S. A. & Demetriades, C. The multifaceted role of nutrient sensing and mTORC1 signaling in physiology and aging. Front. Aging 2, 707372 (2021).
Google Scholar
-
Guillet, C. et al. Impaired anabolic response of muscle protein synthesis is associated with S6K1 dysregulation in elderly humans. FASEB J. 18, 1586–1587 (2004).
Google Scholar
-
Cuthbertson, D. et al. Anabolic signaling deficits underlie amino acid resistance of wasting, aging muscle. FASEB J. 19, 422–424 (2005).
Google Scholar
-
Castets, P. et al. Sustained activation of mTORC1 in skeletal muscle inhibits constitutive and starvation-induced autophagy and causes a severe, late-onset myopathy. Cell Metab. 17, 731–744 (2013).
Google Scholar
-
Alvers, A. L. et al. Autophagy is required for extension of yeast chronological life span by rapamycin. Autophagy 5, 847–849 (2009).
Google Scholar
-
Fontana, L. & Partridge, L. Promoting health and longevity through diet: from model organisms to humans. Cell 161, 106–118 (2015).
Google Scholar
-
Ham, D. J. et al. The neuromuscular junction is a focal point of mTORC1 signaling in sarcopenia. Nat. Commun. 11, 4510 (2020).
Google Scholar
-
Orenduff, M. C. et al. Differential effects of calorie restriction and rapamycin on age-related molecular and functional changes in skeletal muscle. Exp. Gerontol. 165, 111841 (2022).
Google Scholar
-
Bales, C. W. & Kraus, W. E. Caloric restriction: implications for human cardiometabolic health. J. Cardiopulm. Rehabil. Prev. 33, 201–208 (2013).
Google Scholar
-
Altun, M., Bergman, E., Edström, E., Johnson, H. & Ulfhake, B. Behavioral impairments of the aging rat. Physiol. Behav. 92, 911–923 (2007).
Google Scholar
-
Ham, D. J. et al. Distinct and additive effects of calorie restriction and rapamycin in aging skeletal muscle. Nat. Commun. 13, 2025 (2022).
Google Scholar
-
McKiernan, S. H., Bua, E., McGorray, J. & Aiken, J. Early-onset calorie restriction conserves fiber number in aging rat skeletal muscle. FASEB J. 18, 580–581 (2004).
Google Scholar
-
Valdez, G. et al. Attenuation of age-related changes in mouse neuromuscular synapses by caloric restriction and exercise. Proc. Natl Acad. Sci. USA 107, 14863–14868 (2010).
Google Scholar
-
Cerletti, M., Jang, Y. C., Finley, L. W. S., Haigis, M. C. & Wagers, A. J. Short-term calorie restriction enhances skeletal muscle stem cell function. Cell Stem Cell 10, 515–519 (2012).
Google Scholar
-
Boldrin, L. et al. The effect of calorie restriction on mouse skeletal muscle is sex, strain and time-dependent. Sci. Rep. 7, 5160 (2017).
Google Scholar
-
Karunadharma, P. P. et al. Subacute calorie restriction and rapamycin discordantly alter mouse liver proteome homeostasis and reverse aging effects. Aging Cell 14, 547–557 (2015).
Google Scholar
-
Price, J. C. et al. The effect of long term calorie restriction on in vivo hepatic proteostatis: a novel combination of dynamic and quantitative proteomics. Mol. Cell. Proteomics 11, 1801–1814 (2012).
Google Scholar
-
Shirai, T., Uemichi, K., Hidaka, Y., Kitaoka, Y. & Takemasa, T. Effect of lactate administration on mouse skeletal muscle under calorie restriction. Curr. Res. Physiol. 4, 202–208 (2021).
Google Scholar
-
Varanoske, A. N. et al. Energy restriction suppresses muscle protein synthesis, and high protein diets extend protein half-lives across the muscle proteome in obese female Zucker rats. J. Nutr. 151, 2551–2563 (2021).
Google Scholar
-
Margolis, L. M. et al. Prolonged calorie restriction downregulates skeletal muscle mTORC1 signaling independent of dietary protein intake and associated microRNA expression. Front. Physiol. 7, 445 (2016).
Google Scholar
-
Garelick, M. G. et al. Chronic rapamycin treatment or lack of S6K1 does not reduce ribosome activity in vivo. Cell Cycle 12, 2493–2504 (2013).
Google Scholar
-
Ingolia, N. T., Ghaemmaghami, S., Newman, J. R. S. & Weissman, J. S. Genome-wide analysis in vivo of translation with nucleotide resolution using ribosome profiling. Science 324, 218–223 (2009).
Google Scholar
-
Ingolia, N. T., Brar, G. A., Rouskin, S., McGeachy, A. M. & Weissman, J. S. The ribosome profiling strategy for monitoring translation in vivo by deep sequencing of ribosome-protected mRNA fragments. Nat. Protoc. 7, 1534–1550 (2012).
Google Scholar
-
de Klerk, E. et al. Assessing the translational landscape of myogenic differentiation by ribosome profiling. Nucleic Acids Res. 43, 4408–4428 (2015).
Google Scholar
-
Sako, H., Yada, K. & Suzuki, K. Genome-wide analysis of acute endurance exercise-induced translational regulation in mouse skeletal muscle. PLoS ONE 11, e0148311 (2016).
Google Scholar
-
Anisimova, A. S. et al. Multifaceted deregulation of gene expression and protein synthesis with age. Proc. Natl Acad. Sci. USA 117, 15581–15590 (2020).
Google Scholar
-
Gerashchenko, M. V., Peterfi, Z., Yim, S. H. & Gladyshev, V. N. Translation elongation rate varies among organs and decreases with age. Nucleic Acids Res. 49, e9 (2021).
Google Scholar
-
Ingolia, N. T. Ribosome footprint profiling of translation throughout the genome. Cell 165, 22–33 (2016).
Google Scholar
-
Love, M. I., Huber, W. & Anders, S. Moderated estimation of fold change and dispersion for RNA-seq data with DESeq2. Genome Biol. 15, 550 (2014).
Google Scholar
-
Wang, M., Zhao, Y. & Zhang, B. Efficient test and visualization of multi-set intersections. Sci. Rep. 5, 16923 (2015).
Google Scholar
-
Hinnebusch, A. G. Gene-specific translational control of the yeast GCN4 gene by phosphorylation of eukaryotic initiation factor 2. Mol. Microbiol. 10, 215–223 (1993).
Google Scholar
-
Moro, S. G., Hermans, C., Ruiz-Orera, J. & Albà, M. M. Impact of uORFs in mediating regulation of translation in stress conditions. BMC Mol. Cell Biol. 22, 29 (2021).
Google Scholar
-
Robinson, J. T. et al. Integrative genomics viewer. Nat. Biotechnol. 29, 24–26 (2011).
Google Scholar
-
Beretta, L., Gingras, A. C., Svitkin, Y. V., Hall, M. N. & Sonenberg, N. Rapamycin blocks the phosphorylation of 4E-BP1 and inhibits cap-dependent initiation of translation. EMBO J. 15, 658–664 (1996).
Google Scholar
-
Perez-Riverol, Y. et al. The PRIDE database and related tools and resources in 2019: improving support for quantification data. Nucleic Acids Res. 47, D442–D450 (2019).
Google Scholar
-
UniProt Consortium. UniProt: a worldwide hub of protein knowledge. Nucleic Acids Res. 47, D506–D515 (2019).
Google Scholar
-
Yu, F. et al. Analysis of DIA proteomics data using MSFragger-DIA and FragPipe computational platform. Nat. Commun. 14, 4154 (2023).
Google Scholar
-
Choteau, S. A., Wagner, A., Pierre, P., Spinelli, L. & Brun, C. MetamORF: a repository of unique short open reading frames identified by both experimental and computational approaches for gene and metagene analyses. Database 2021, baab032 (2021).
Google Scholar
-
Patraquim, P., Magny, E. G., Pueyo, J. I., Platero, A. I. & Couso, J. P. Translation and natural selection of micropeptides from long non-canonical RNAs. Nat. Commun. 13, 6515 (2022).
Google Scholar
-
Della Bella, E., Koch, J. & Baerenfaller, K. Translation and emerging functions of non-coding RNAs in inflammation and immunity. Allergy 77, 2025–2037 (2022).
Google Scholar
-
Xing, J., Liu, H., Jiang, W. & Wang, L. LncRNA-encoded peptide: functions and predicting methods. Front. Oncol. 10, 622294 (2020).
Google Scholar
-
Matsumoto, A. et al. mTORC1 and muscle regeneration are regulated by the LINC00961-encoded SPAR polypeptide. Nature 541, 228–232 (2017).
Google Scholar
-
Anderson, D. M. et al. A micropeptide encoded by a putative long noncoding RNA regulates muscle performance. Cell 160, 595–606 (2015).
Google Scholar
-
Nelson, B. R. et al. A peptide encoded by a transcript annotated as long noncoding RNA enhances SERCA activity in muscle. Science 351, 271–275 (2016).
Google Scholar
-
Zhao, L. et al. NONCODEV6: an updated database dedicated to long non-coding RNA annotation in both animals and plants. Nucleic Acids Res. 49, D165–D171 (2021).
Google Scholar
-
O’Leary, V. B. et al. Long non-coding RNA PARTICLE bridges histone and DNA methylation. Sci. Rep. 7, 1790 (2017).
Google Scholar
-
Przanowska, R. K. et al. Distinct MUNC lncRNA structural domains regulate transcription of different promyogenic factors. Cell Rep. 38, 110361 (2022).
Google Scholar
-
Mueller, A. C. et al. MUNC, a long noncoding RNA that facilitates the function of MyoD in skeletal myogenesis. Mol. Cell. Biol. 35, 498–513 (2015).
Google Scholar
-
Sousa-Victor, P. & Muñoz-Cánoves, P. Regenerative decline of stem cells in sarcopenia. Mol. Aspects Med. 50, 109–117 (2016).
Google Scholar
-
Butera, G. et al. Parvalbumin affects skeletal muscle trophism through modulation of mitochondrial calcium uptake. Cell Rep. 35, 109087 (2021).
Google Scholar
-
Collins, B. C. et al. Three-dimensional imaging studies in mice identify cellular dynamics of skeletal muscle regeneration. Dev. Cell https://doi.org/10.1016/j.devcel.2024.03.017 (2024).
-
Meyer, G. A. Evidence of induced muscle regeneration persists for years in the mouse. Muscle Nerve 58, 858–862 (2018).
Google Scholar
-
Edström, E. & Ulfhake, B. Sarcopenia is not due to lack of regenerative drive in senescent skeletal muscle. Aging Cell 4, 65–77 (2005).
Google Scholar
-
Labbadia, J. & Morimoto, R. I. The biology of proteostasis in aging and disease. Annu. Rev. Biochem. 84, 435–464 (2015).
Google Scholar
-
Chistiakov, D. A., Sobenin, I. A., Revin, V. V., Orekhov, A. N. & Bobryshev, Y. V. Mitochondrial aging and age-related dysfunction of mitochondria. Biomed. Res. Int. 2014, 238463 (2014).
Google Scholar
-
Tharakan, R., Ubaida-Mohien, C., Piao, Y., Gorospe, M. & Ferrucci, L. Ribosome profiling analysis of human skeletal muscle identifies reduced translation of mitochondrial proteins with age. RNA Biol. 18, 1555–1559 (2021).
Google Scholar
-
Sparks, L. M. et al. Effects of 12 months of caloric restriction on muscle mitochondrial function in healthy individuals. J. Clin. Endocrinol. Metab. 102, 111–121 (2017).
Google Scholar
-
Shi, J. et al. Decreased expression of eukaryotic initiation factor 3f deregulates translation and apoptosis in tumor cells. Oncogene 25, 4923–4936 (2006).
Google Scholar
-
Csibi, A. et al. The translation regulatory subunit eIF3f controls the kinase-dependent mTOR signaling required for muscle differentiation and hypertrophy in mouse. PLoS ONE 5, e8994 (2010).
Google Scholar
-
Bohlen, J., Roiuk, M., Neff, M. & Teleman, A. A. PRRC2 proteins impact translation initiation by promoting leaky scanning. Nucleic Acids Res. 51, 3391–3409 (2023).
Google Scholar
-
Manjunath, L. E., Singh, A., Som, S. & Eswarappa, S. M. Mammalian proteome expansion by stop codon readthrough. Wiley Interdiscip. Rev. RNA 14, e1739 (2023).
Google Scholar
-
Wright, B. W., Yi, Z., Weissman, J. S. & Chen, J. The dark proteome: translation from noncanonical open reading frames. Trends Cell Biol. 32, 243–258 (2022).
Google Scholar
-
Wu, Q. et al. Translation of small downstream ORFs enhances translation of canonical main open reading frames. EMBO J. 39, e104763 (2020).
Google Scholar
-
Calvo, S. E., Pagliarini, D. J. & Mootha, V. K. Upstream open reading frames cause widespread reduction of protein expression and are polymorphic among humans. Proc. Natl Acad. Sci. USA 106, 7507–7512 (2009).
Google Scholar
-
Pollard, K. S., Hubisz, M. J., Rosenbloom, K. R. & Siepel, A. Detection of nonneutral substitution rates on mammalian phylogenies. Genome Res. 20, 110–121 (2010).
Google Scholar
-
Schueren, F. et al. Peroxisomal lactate dehydrogenase is generated by translational readthrough in mammals. Elife 3, e03640 (2014).
Google Scholar
-
Eswarappa, S. M. et al. Programmed translational readthrough generates antiangiogenic VEGF-Ax. Cell 157, 1605–1618 (2014).
Google Scholar
-
Stiebler, A. C. et al. Ribosomal readthrough at a short UGA stop codon context triggers dual localization of metabolic enzymes in fungi and animals. PLoS Genet. 10, e1004685 (2014).
Google Scholar
-
Hofhuis, J. et al. The functional readthrough extension of malate dehydrogenase reveals a modification of the genetic code. Open Biol. 6, 160246 (2016).
Google Scholar
-
Manjunath, L. E. et al. Stop codon read-through of mammalian MTCH2 leading to an unstable isoform regulates mitochondrial membrane potential. J. Biol. Chem. 295, 17009–17026 (2020).
Google Scholar
-
Palazzo, C. et al. AQP4ex is crucial for the anchoring of AQP4 at the astrocyte end-feet and for neuromyelitis optica antibody binding. Acta Neuropathol. Commun. 7, 51 (2019).
Google Scholar
-
Mohaupt, P., Vialaret, J., Hirtz, C. & Lehmann, S. Readthrough isoform of aquaporin-4 (AQP4) as a therapeutic target for Alzheimer’s disease and other proteinopathies. Alzheimers. Res. Ther. 15, 170 (2023).
Google Scholar
-
Loughran, G. et al. Evidence of efficient stop codon readthrough in four mammalian genes. Nucleic Acids Res. 42, 8928–8938 (2014).
Google Scholar
-
Mylonas, A. & O’Loghlen, A. Cellular senescence and ageing: mechanisms and interventions. Front. Aging 3, 866718 (2022).
Google Scholar
-
Del Toro, N. et al. Cellular senescence limits translational readthrough. Biol. Open 10, bio058688 (2021).
Google Scholar
-
Kesner, J. S. et al. Noncoding translation mitigation. Nature 617, 395–402 (2023).
Google Scholar
-
Bonilauri, B. & Dallagiovanna, B. Microproteins in skeletal muscle: hidden keys in muscle physiology. J. Cachexia Sarcopenia Muscle 13, 100–113 (2022).
Google Scholar
-
Koss, K. L. & Kranias, E. G. Phospholamban: a prominent regulator of myocardial contractility. Circ. Res. 79, 1059–1063 (1996).
Google Scholar
-
Odermatt, A. et al. Characterization of the gene encoding human sarcolipin (SLN), a proteolipid associated with SERCA1: absence of structural mutations in five patients with Brody disease. Genomics 45, 541–553 (1997).
Google Scholar
-
Stein, C. S. et al. Mitoregulin: a lncRNA-encoded microprotein that supports mitochondrial supercomplexes and respiratory efficiency. Cell Rep. 23, 3710–3720.e8 (2018).
Google Scholar
-
Makarewich, C. A. et al. MOXI is a mitochondrial micropeptide that enhances fatty acid β-oxidation. Cell Rep. 23, 3701–3709 (2018).
Google Scholar
-
Chu, Q. et al. Regulation of the ER stress response by a mitochondrial microprotein. Nat. Commun. 10, 4883 (2019).
Google Scholar
-
Mittal, N. et al. The Gcn4 transcription factor reduces protein synthesis capacity and extends yeast lifespan. Nat. Commun. 8, 457 (2017).
Google Scholar
-
Hornstein, N. et al. Ligation-free ribosome profiling of cell type-specific translation in the brain. Genome Biol. 17, 149 (2016).
Google Scholar
-
Hoffmann, S. et al. Fast mapping of short sequences with mismatches, insertions and deletions using index structures. PLoS Comput. Biol. 5, e1000502 (2009).
Google Scholar
-
Katsantoni, M. et al. ZARP: a user-friendly and versatile RNA-seq analysis workflow. F1000Res. 13, 533 (2024).
Google Scholar
-
Bray, N. L., Pimentel, H., Melsted, P. & Pachter, L. Near-optimal probabilistic RNA-seq quantification. Nat. Biotechnol. 34, 525–527 (2016).
Google Scholar
-
Chothani, S. et al. deltaTE: detection of translationally regulated genes by integrative analysis of ribo-seq and RNA-seq data. Curr. Protoc. Mol. Biol. 129, e108 (2019).
Google Scholar
-
Liao, Y., Smyth, G. K. & Shi, W. The R package Rsubread is easier, faster, cheaper and better for alignment and quantification of RNA sequencing reads. Nucleic Acids Res. 47, e47 (2019).
-
Yu, G., Wang, L.-G., Han, Y. & He, Q.-Y. clusterProfiler: an R package for comparing biological themes among gene clusters. OMICS 16, 284–287 (2012).
-
Gu, Z., Eils, R. & Schlesner, M. Complex heatmaps reveal patterns and correlations in multidimensional genomic data. Bioinformatics 32, 2847–2849 (2016).
Google Scholar
-
Gu, Z., Gu, L., Eils, R., Schlesner, M. & Brors, B. circlize implements and enhances circular visualization in R. Bioinformatics 30, 2811–2812 (2014).
-
Heberle, H., Meirelles, G. V., da Silva, F. R., Telles, G. P. & Minghim, R. InteractiVenn: a web-based tool for the analysis of sets through Venn diagrams. BMC Bioinformatics 16, 169 (2015).
Google Scholar
-
Hulstaert, N. et al. ThermoRawFileParser: modular, scalable, and cross-platform RAW file conversion. J. Proteome Res. 19, 537–542 (2020).
Google Scholar
-
Kong, A. T., Leprevost, F. V., Avtonomov, D. M., Mellacheruvu, D. & Nesvizhskii, A. I. MSFragger: ultrafast and comprehensive peptide identification in mass spectrometry-based proteomics. Nat. Methods 14, 513–520 (2017).
Google Scholar
-
Encarnacion-Rivera, L., Foltz, S., Hartzell, H. C. & Choo, H. Myosoft: an automated muscle histology analysis tool using machine learning algorithm utilizing FIJI/ImageJ software. PLoS ONE 15, e0229041 (2020).
Google Scholar
-
Reinhard, J. R. et al. Nerve pathology is prevented by linker proteins in mouse models for LAMA2-related muscular dystrophy. PNAS Nexus 2, gad083 (2023).
Google Scholar
Acknowledgements
This work was supported in part by Jubiläumsstiftung von Swiss Life and by the Swiss National Science Foundation grant #CRSII3_160760.
Author information
Authors and Affiliations
Contributions
N.M., M.A. and M.Z. conceived the study. D.H. handled the mice; D.H. and N.M. obtained the samples. N.M. and L.T. carried out the experiments with help from L.J. A.S. carried out the mass spectrometry experiments. L.J. and D.H. did the immunostaining. M.A. analyzed all data. M.A., N.M. and M.Z. wrote the manuscript with help from D.H., M.A.R. and L.T. Funding was obtained by M.A.R., M.Z., N.M. and M.S. All authors have read and approved the manuscript. N.M., M.A. and L.T. would like to be considered co-first authors.
Corresponding authors
Ethics declarations
Competing interests
The authors declare no competing interests.
Additional information
Publisher’s note Springer Nature remains neutral with regard to jurisdictional claims in published maps and institutional affiliations.
Supplementary information
Supplementary Information
Supplementary Data 1
Supplementary Data 2
Supplementary Data 3
Supplementary Data 4
Supplementary Data 5
Rights and permissions
Open Access This article is licensed under a Creative Commons Attribution-NonCommercial-NoDerivatives 4.0 International License, which permits any non-commercial use, sharing, distribution and reproduction in any medium or format, as long as you give appropriate credit to the original author(s) and the source, provide a link to the Creative Commons licence, and indicate if you modified the licensed material. You do not have permission under this licence to share adapted material derived from this article or parts of it. The images or other third party material in this article are included in the article’s Creative Commons licence, unless indicated otherwise in a credit line to the material. If material is not included in the article’s Creative Commons licence and your intended use is not permitted by statutory regulation or exceeds the permitted use, you will need to obtain permission directly from the copyright holder. To view a copy of this licence, visit http://creativecommons.org/licenses/by-nc-nd/4.0/.
Reprints and permissions
About this article
Cite this article
Mittal, N., Ataman, M., Tintignac, L. et al. Calorie restriction and rapamycin distinctly restore non-canonical ORF translation in the muscles of aging mice.
npj Regen Med 9, 23 (2024). https://doi.org/10.1038/s41536-024-00369-9
-
Received: 03 January 2024
-
Accepted: 10 September 2024
-
Published: 19 September 2024
-
DOI: https://doi.org/10.1038/s41536-024-00369-9