
Ethical statements
This study was conducted after preparing the research protocol, obtaining an approval by the Shiba Palace Clinic Ethics Review Committee (approval no. 153969_rn-36564) and a registration to the University Hospital Medical Information Network (UMIN) Clinical Trial Registry (registration no. UMIN000053645; registration date, February 19, 2024). An opt-out option was not implemented because personal patient and hospital information obtained from the database were anonymized and there was no correspondence table. This study complied with the applicable guidelines outlined in the Strengthening the Reporting of Observational Studies in Epidemiology statement [16] and in the REporting of studies Conducted using Observational Routinely-collected health Data statement [17].
Data source
Data was obtained from a nationwide medical claims database provided by Medical Data Vision Co., Ltd. (Tokyo, Japan), comprising approximately 42 million patients in 475 Japanese hospitals, representing approximately 27% of the acute care hospitals operating in Japan as of December 2022. The database contained information including dates of hospital admission and discharge, patient characteristics at hospital admission, medical treatments during hospitalization, medical costs during hospitalization, and clinical outcomes at the time of discharge. Diagnoses were identified using the International Classification of Diseases 10th Revision (ICD-10) codes. Medical treatments were classified using the Japan-specific codes that appeared in medical claims. Personal patient and hospital information were anonymized and there was no correspondence table.
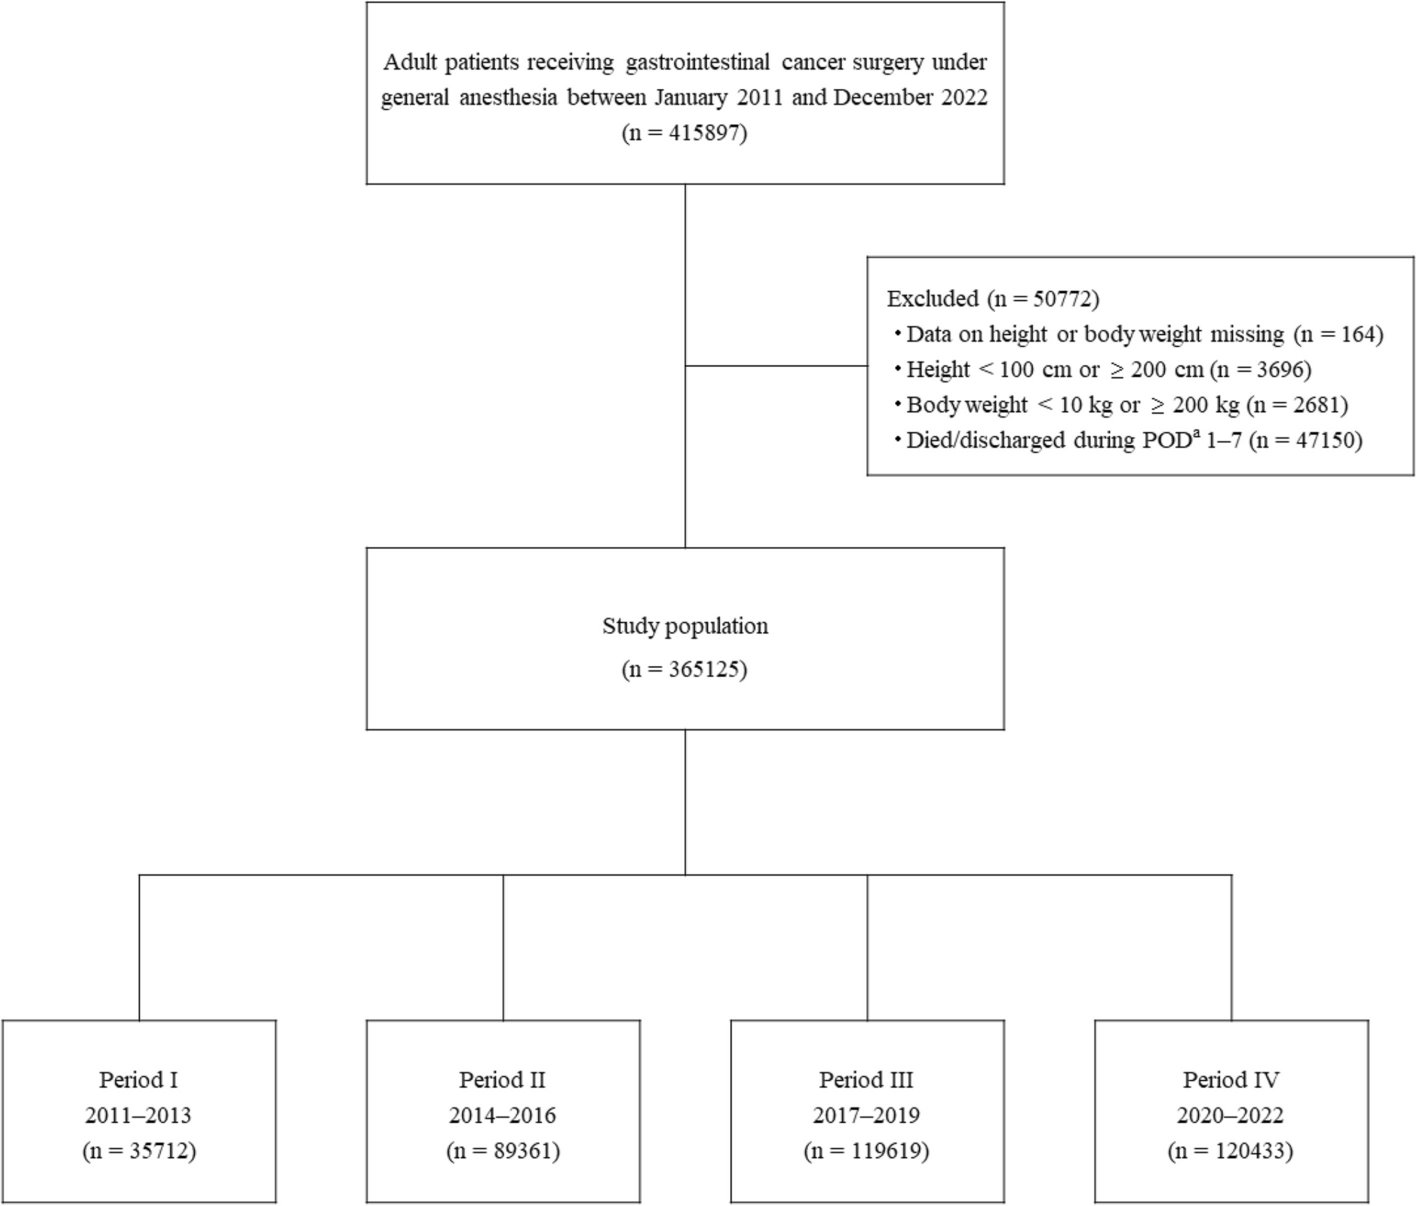
Patients
The cohort was comprised of patients aged 18 years or older who underwent GI cancer surgery under general anesthesia between January 2011 and December 2022. Patients whose surgical site identified from its surgical name was consistent with that identified from the cancer name were extracted using the medical claims codes shown in Additional file 1. Patient height and body weight were used to calculate ideal body weight and body mass index (BMI). Thus, patients whose height or body weight data were missing or suspected to be the result of an input error (i.e., height < 100 cm or ≥ 200 cm, body weight < 10 kg or ≥ 200 kg) were excluded from the study. Extreme values for the exclusion criteria were determined referring the previous studies [18, 19]. The study involved nutritional management during 7 days after surgery. Thus, patients who died or were discharged within 7 days after surgery were also excluded. The study cohort was divided into four groups based on their year of hospital admission: Period I, 2011–2013; II, 2014–2016; III, 2017–2019; IV, 2020–2022.
Extracted data
Patient characteristics were selected and extracted when the variables affected the nutritional management and were clinically important.
Patient characteristics
Patient characteristics at the time of hospital admission extracted from the database included age, sex, height, body weight, beds in admission hospital (< 200, 200–499, or ≥ 500), admission type (emergency or elective), ICD-10 disease diagnosis, activities of daily living (using the Barthel Index [20]), smoking history, and Tumor-Node-Metastasis (TNM) cancer stage [21]. Variables used in the study included age (categorized as < 60, 60–69, 70–79, 80–89, or ≥ 90 years), BMI (calculated using height and body weight; categorized based on the World Health Organization (WHO) classification [22] as < 16, ≥ 16 to < 18.5, ≥ 18.5 to < 22.5, ≥ 22.5 to < 25, ≥ 25 to < 30, or ≥ 30), and Charlson Comorbidity Index [23, 24] (used to predict mortality based on comorbidities, calculated using ICD-10 disease diagnosis, and categorized as 0–1, 2–3, 4–5, or ≥ 6). The Barthel Index (used to assess activities of daily living) was expressed as the range from 0 (requiring full assistance) to 100 (requiring no assistance) and categorized as 0, 5–40, 45–60, 65–95, or 100. Malnutrition was defined as a BMI < 18.5 in patients aged < 70 years and a BMI < 20 in patients aged ≥ 70 years (referring to low BMI in the Asian Global Leadership Initiative on Malnutrition criteria [25]). The level of food intake independence was categorized as requiring either no assistance, partial assistance, or full assistance, and was based on the Barthel Index Feeding score.
Preoperative medical treatments
Preoperative data extracted from the database was based on the medical claims codes shown in Additional file 1, including oral management (i.e., support of oral intake, including swallowing and chewing; data available for 2014 and later) received [26] and the type of artificial nutrition (i.e., EN [via tube feeding] and/or PN [via intravenous solutions containing amino acids and lipid]) prescribed, from the day of hospital admission to the day before surgery. This also included types of non-surgical cancer treatment (i.e., chemotherapy and/or radiation therapy) received, from 60 days to the day prior to surgery.
Medical treatments and medication on day of surgery
Data on the day of surgery extracted from the database were based on the medical claims codes shown in Additional file 1. This data included information on the surgical site, the surgical method employed (laparoscopic or non-laparoscopic surgery), intravenous fluids (crystalloid, colloid, and/or albumin), transfusions (red blood cells, platelets, and/or fresh frozen plasma), and intensive care unit (ICU) admission. The surgical site was based on medical claims codes and categorized as follows: esophagus, stomach, colon, rectum, liver, gallbladder/bile duct, pancreas, or multiple organs (multiple organ surgery performed on a single day). Crystalloid fluid was categorized based on prescribed volumes as ≤ 5,000 mL, > 5,000– ≤ 10,000 mL, or > 10,000 mL. Colloid fluid, albumin, and transfusions were categorized based on prescribed volumes as 0 mL, > 0– ≤ 500 mL, or > 500 mL.
Evaluation of changes in nutritional management
Postoperative feeding route
Postoperative day (POD) 1 was defined as the next day of the surgery day. Data concerning the feeding routes on POD 1, 3, 5, and 7 was extracted from the database, based on the data of medical treatments and prescribed medicines which was based on medical claims codes shown in Additional file 1. Data was expressed as either oral intake (defined as meal served), EN, PN or a combination of these. Data not fitting those categories (e.g., fluids containing carbohydrate and/or electrolytes prescribed alone) were expressed as “Other”. The proportion of patients receiving each feeding route on POD 1, 3, 5, and 7 was calculated for each group and those results were compared between the groups. In addition, the proportion of patients receiving each feeding route was also calculated for each group during the periods of POD 1 to 3, POD 1 to 5, and POD 1 to 7, and those results were compared between the groups.
Postoperative prescribed PN doses and nutritional goal fulfilment
For patients who were fasting from POD 1 to 7 and received PN alone, the prescribed doses, based on ideal body weight (= 22 × height [m]2), of parenteral energy (kcal/kg), amino acids (g/kg), and lipid (g/kg) on POD 1, 3, 5, and 7 were calculated for each group. These results were compared between the groups. The composition, prescribed doses of the parenteral nutrition products, and the ideal body weight of each patient were identified in the medical claims database and used. Propofol, an anesthetic agent containing lipid emulsion as a solvent, was included in the energy and lipid dose calculations. In addition, the proportion of patients prescribed guideline-recommended target parenteral energy (≥ 20 kcal/kg) and amino acid (≥ 0.8 g/kg) doses [6] on POD 7 was calculated for each BMI category within each group, and those results were compared between the groups.
Statistical analysis
Continuous variables were described using medians and interquartile ranges [first quartile (Q1), third quartile (Q3)] or the mean and standard deviation (SD). Categorical variables were reported using frequencies and proportion. Missing data was treated without replacement and designated as not available. The Jonckheere-Terpstra test (for continuous variables) or the Cochran-Armitage test (for binary variables) were employed to assess trends. A two-sided test was utilized with a significance level of 5%. All statistical analyses were performed using SAS, version 9.4 (SAS Institute, Inc.; Cary, NC, USA). An independent third party, A2 Healthcare Corporation (Tokyo, Japan), conducted data management and statistical analysis.