
Study design and population
This study used data from the UKB, a nationwide prospective cohort, with participants recruited between 2006 and 2010 across 22 centers in the UK. Multi-dimensional information covering lifestyle factors, health conditions, physical measurements, biological samples, brain imaging, and genotyping was collected from more than 500,000 participants aged 37–73 years through a series of interviews and questionnaires. The study was approved by the North West Multicenter Research Ethics Committee (Reference number: 21/NW/0157), and all participants provided informed consent.
Among 153,543 participants with complete data available for the five childhood maltreatment-related questions of the Childhood Trauma Screener (CTS), those with missing data for lifestyle factors (n = 27,628), adult traumas (n = 3,730), personality traits (n = 21), social connections (n = 3056), and sociodemographic characteristics (n = 628), and those with a history of depression at baseline (n = 9079) were excluded. Ultimately, 109,041 participants were included in the primary analysis (Additional file 1: Fig. S1).
Assessment of childhood maltreatment
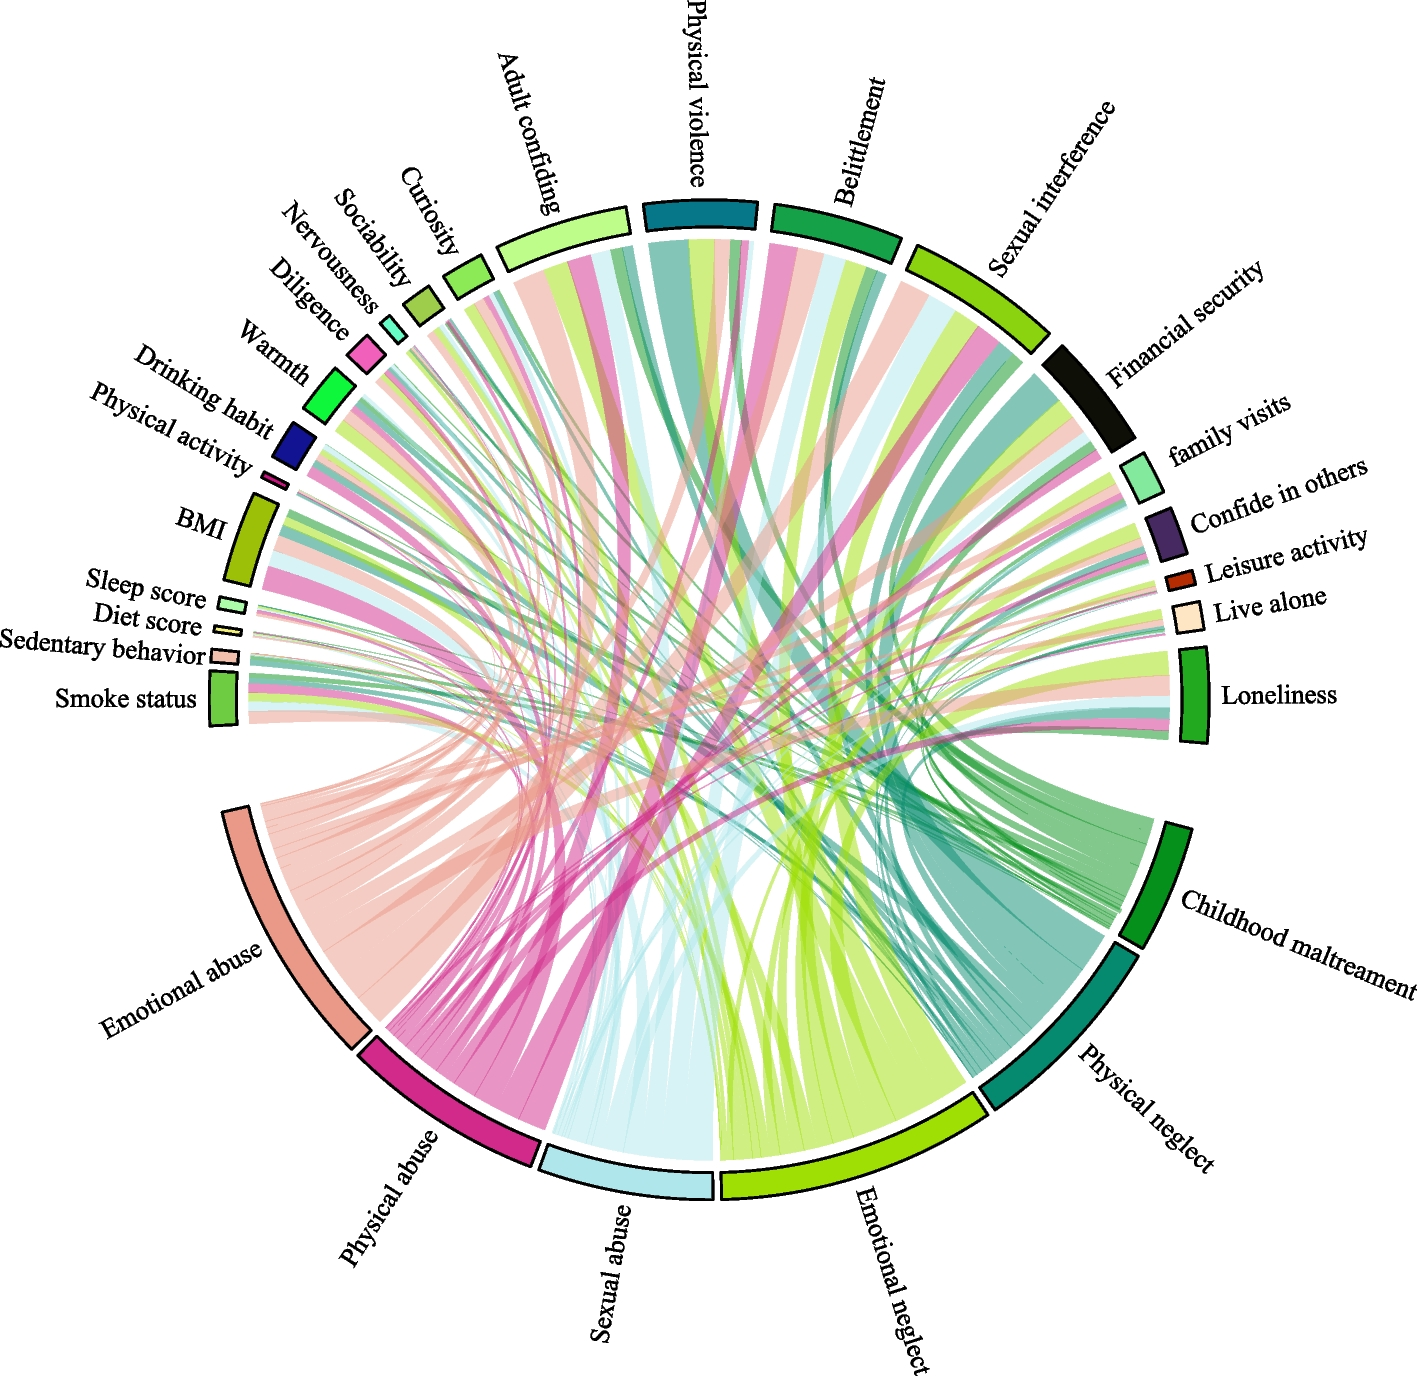
The exposure of interest was the childhood maltreatment scores, derived from the CTS in 2016, a shortened version of the Childhood Trauma Questionnaire assessed physical neglect, emotional neglect, sexual abuse, physical abuse, and emotional abuse through five questions [3, 29]. Participants responded using a 5-point Likert scale, ranging from never, rarely, sometimes, often, to very often (Additional file 1: Table S1) [30]. Physical neglect was assigned with 1 if participants answered never true, rarely true, sometimes true, or often true; emotional neglect was assigned with 1 if participants answered never true, rarely true, or sometimes true; sexual abuse, physical abuse, and emotional abuse were scored with 1 if the response indicated that it occurred more than rarely true. The childhood maltreatment scores were calculated by summing the score of experienced childhood maltreatment subtypes, resulting in a scale from 0 to 5, with a higher score indicating exposure to a greater number of childhood maltreatment types.
Definition and measurement of mediators
Lifestyle factors included smoking status, drinking habits, sedentary behavior, diet score, sleep quality, body mass index (BMI, calculated as weight in kilograms divided by height in meters squared), and physical activity, which were assessed at baseline. Smoking status was classified as current smokers and non-smokers. Drinking habits were categorized as daily or almost daily consumption versus less frequent drinking (healthy drinking group). Sedentary behavior was assessed by summing the total daily hours spent on television viewing, computer usage, and driving. The diet score was assessed using a touchscreen questionnaire that measured the frequency of consuming fruits, vegetables, fish, processed meat, unprocessed red meat, whole grains, and refined grains. The diet score ranged from 0 to 7, with a higher score indicating a healthier diet pattern [31]. Sleep quality was self-reported and included sleep duration, chronotype preference, insomnia disorder, snoring, and daytime sleepiness, as detailed in previous studies [32]. Healthy sleep behaviors were defined as getting 7–8 h of sleep per day, being a morning or more morning than evening person, never or rarely experiencing insomnia, not snoring, and never/rarely or sometimes experiencing excessive daytime sleepiness. Each participant received one point per healthy sleep behavior, resulting in a total sleep score ranging from 0 to 5 [33]. Physical activity was measured in metabolic equivalent task (MET)-min per week, based on the MET score derived from the validated International Physical Activity Questionnaire (IPAQ) guidelines [34] (Additional file 1: Table S2).
Personality traits were derived from five questions in the online Big Five Questionnaire at baseline (2006–2008), including warmth (agreeableness), diligence (conscientiousness), nervousness (neuroticism), sociability (extraversion), and curiosity (openness), and were already well established and validated [35, 36]. Each question contributed one point to the whole score for the respective personality trait; scores for warmth and nervousness range from 0 to 5, and scores for diligence, sociability, and curiosity range from 0 to 4. The selected questions and cut-off points for each personality trait were summarized in Additional file 1: STable 3.
Adult traumas were defined using five items from the UKB mental health questionnaire, which assessed adult experiences corresponding to the early life experiences measured by the CTS in 2016 [37], and was examined in previous literature [38]. These items indexed emotional, physical, and sexual abuse in interpersonal relationships as well as poor closeness of relationships and financial security after age 16 [37]. The response to every question contains never true, rarely true, sometimes true, often true, and very often true. Each individual type was scored 0 or 1 according to the cutoff points derived from validation studies [39]. Thus, the cumulative score ranged from 0 to 5, with a higher score indicating more frequent adult traumas (Additional file 1: Table S4). Reliability analysis of childhood maltreatment and adult traumas scales can be seen in the Additional file 1: Table S5.
Social connections were calculated by incorporating information on social supports and mental health from five questions at baseline (2006–2010): (1) Frequency of friend/family visits, (2) Leisure/social activities, (3) Able to confide, (4) Number in household, (5) Loneliness, isolation: “Do you often feel lonely?” (1 point for no). Each level of the 5 metrics was scored 1 for the group of better social connections, and were scored 0 for the group of lower social connections, consistent with previous studies [40,41,42]. Each of the five questions was scored 1 for better social connections and 0 for lower social connections (Additional file 1: Table S6).
Assessment of outcome
The primary outcome of this study was depression, identified based on the “first occurrences” dataset (category ID: 1712) in the UKB. This dataset included information from self-reports, hospital admissions, and death registries (International Classification of Diseases Tenth Revision codes F32-F33). Participants were followed from their baseline assessment (2006–2010) until either a diagnosis of depression or the end of the follow-up period on April 1, 2023, whichever came first.
Covariates
Covariates included birth year (in years), sex (female or male), ethnicity (White or non-White), educational attainment (college/university degree or other degrees), Townsend deprivation index (TDI), number of siblings, and family history of depression. The TDI is a composite measure of socioeconomic deprivation, incorporating housing conditions, social class by zip code, and employment status; higher values indicate lower socio-economic status [43]. The number of siblings was calculated by summing the total number of both adopted and biological sisters/brothers, and then categorized into four groups: no siblings, one sibling, two siblings, or three or more siblings. Family history of depression was defined as having at least one family member (e.g., mother, father, or sibling) with a documented history of depression. In this study, participants with missing values for any covariate were excluded to ensure the integrity and comparability of the data.
Statistical analysis
Descriptive analysis was conducted to evaluate the sociodemographic characteristics, overall and by depression, using means with standard deviation (SD) for continuous variables and numbers with percentages for categorical variables. Multivariate logistic regression was used to estimate the odds ratios (ORs) and 95% confidence intervals (CIs) for the associations between childhood maltreatment scores (both as a continuous variable and ordinal variable: 0, 1, 2, 3, 4, and 5) and depression risk. Separate analyses were performed for childhood maltreatment subtypes and their associations with depression using multivariate logistic regression. For all analyses, participants with a childhood maltreatment score of 0 served as the reference group, and a sequence of regression models were constructed: (1) adjusted for birth year, sex, and ethnicity; (2) further adjusted for educational attainment and TDI; (3) further adjusted for the number of siblings, and family history of depression.
Path analysis was conducted to explore potential pathways linking childhood maltreatment scores (as a continuous variable) to depression, allowing for statistical inference of hypothesized relationships between variables. Four potential indirect effect paths were first constructed, including four mediators—lifestyle factors, personality traits, adult traumas, and social connections. Indirect effects were represented by a chain of paths, such as childhood maltreatment scores → lifestyle factors → depression, with corresponding path coefficients “a” for childhood maltreatment scores → lifestyle factors, and “b” for lifestyle factors → depression, which were equivalent to standard regression coefficients. Specifically, in the path analysis of childhood maltreatment scores → lifestyle factors → depression, smoking status and drinking habits were considered as categorical variables, while sedentary behavior, diet score, sleep quality, BMI, and physical activity were considered as continuous variables. For the pathway of childhood maltreatment scores → personality traits → depression, all five variables representing personality traits were used as continuous variables. For pathways of childhood `maltreatment scores → adult traumas → depression and childhood maltreatment scores → social connections → depression, the five respective variables representing adult traumas and social connections were used as categorical variables in the paths.
A three-step analysis was performed to identify mediating variables. First, multivariate logistic regression was used to calculate ORs and 95% CIs for the associations between childhood maltreatment scores and two lifestyle variables (smoking status, drinking habits), all adult traumas and social connections variables, adjusting for sex, birth year, ethnicity, educational attainment, TDI, number of siblings, and family history of depression. Beta coefficients and 95% CIs for the associations between childhood maltreatment scores and other lifestyle factors (sedentary behavior, diet score, sleep quality, BMI, and physical activity), and five personality traits were determined through multivariate linear regression adjusted for the same covariates. Second, multivariate logistic regression was used to assess the associations of mediators with depression risk. Third, mediation analysis was performed on lifestyle factors, personality traits, adult traumas, and social connections significantly associated with childhood maltreatment scores and depression [44]. The R package “mediation” with 1000 simulations was used to estimate the mediation proportions and corresponding 95% CIs, adjusting for sex as per previous studies [30]. In addition, we implemented the four-way effect decomposition proposed by Discacciati et al. [45] to disentangle mediation-interaction dynamics. This approach quantifies (i) pure direct effects, (ii) pure interaction effects, (iii) mediated interaction effects, and (iv) pure mediation effects, to ensure non-overlapping quantification of pathway-specific contributions.
Structural equation modeling (SEM) was constructed to explore the relationships between childhood maltreatment scores, lifestyle factors, personality traits, adult traumas, social connections, and depression, aiming to elucidate the potential mechanisms linking childhood maltreatment scores to depression. In order to reduce the measurement error between factors representing respective mediators [46], four latent variables were created using confirmatory factor analysis in the SEM [47]. The latent variables were derived from factors significantly associated with both childhood maltreatment scores and depression in the SEM, and the results were presented as standardized coefficients using the R “Lavaan” package. The goodness of fit model was assessed using several statistics including Comparative Fit Index (CFI), Goodness-of-Fit Index (GFI), Root Mean Square Error of Approximation (RMSEA), and Standardized Root Mean Square Residual (SRMR).
Several sensitivity analyses were conducted. First, childhood maltreatment scores for sexual abuse, emotional abuse, and physical abuse were assigned values from 0 to 4, representing the responses from “never true” to “very often true”; the scores for physical neglect and emotional neglect were reversed. The cumulative childhood maltreatment scores (ranging from 0 to 20) were calculated as the sum of these five questions (0–4 for each question); in primary analysis, cumulative and specific-type childhood maltreatment scores were considered as continuous variables. An alternative grouping strategy, such as a binary variable (childhood maltreatment scores ≥ 2, < 2 [reference group]), or multiple categorical variables (childhood maltreatment scores ≥ 2, 1, 0 [reference group]), was used. Second, depression was assessed using the Patient Health Questionnaire-9 (PHQ-9) questionnaires, and response ranged from “not at all” to “almost every day” scored from 0 to 3, respectively, for a cumulative score of 0–27. As described in previous study, a score of 10 or higher was used to define depression [48]. Third, participants who developed depression within the first 2 years following the baseline survey were excluded to minimize reverse causality. Fourth, the missing data for all covariates were imputed using multiple imputation by chained equations approach to assess its effect. Finally, several stratified analyses were conducted to examine the associations between childhood maltreatment subtype and depression by age (≤ 60 or > 60 years), sex (female or male), and TDI (low socioeconomic status or high socioeconomic status); significant differences in the stratified analysis were further assessed by including an interaction term into models to examine whether the associations varied by these factors.
All the analyses were conducted using STATA 16 statistical software and R software (version 4.1.3). The statistical significance was set as P < 0.05 (two-sided test).