Abstract
Determining causal relationships between environmental change and early animal evolution has been limited by our lack of a robust temporal framework for the Ediacaran Period (635-539 million years ago). Here we present six new radioisotopic age constraints from the Sultanate of Oman, which furnish a quantitative temporal framework for biogeochemical changes associated with animal radiation in the middle and late Ediacaran Period. In addition to constraining the duration of Earth’s largest negative carbon isotope excursion in its type locality, this temporal framework underpins a new understanding of Ediacaran sedimentation rates, a critical control on geochemical records and fossil preservation. Our new dates quantify early Ediacaran (prior to c. 574 million years ago) condensation in key sections across Gondwanan margins. This temporal framework highlights a pressing need to reassess proxy records of oxygenation—often hypothesized as a critical environmental constraint for the emergence of complex multicellular life—considering non-static sedimentation rates.
Introduction
Rocks from the Ediacaran Period (635-539 Ma) record remarkable events in the intertwined histories of Earth and life. Starting with recovery from the last Cryogenian glaciation1, the Ediacaran Period saw the initial radiation of macroscopic animals2; oscillations in the redox state and chemistry of Earth’s oceans and atmosphere3,4,5,6,7; and unusually large magnitude carbon isotope excursions5,8,9. If causal relationships between these events can be demonstrated, then this interval of Earth history may illuminate key controls on the emergence of complex macroorganisms and interrelationships between biological, physical, and chemical processes in the broader Earth system. Assessing these relationships requires the development of an Ediacaran timescale to aid in global correlations and the investigation of cause and effect between biogeochemical cycling, ecosystem complexity and animal evolution. However, the development of such a timescale is difficult in all but the youngest Ediacaran strata. Contributing factors include the paucity of Ediacaran skeletal fossils, making biostratigraphic correlation across lithofacies and basins especially challenging due to taphonomic biases, and uncertainty about the synchroneity of both Ediacaran carbon isotope excursions or climatic events, which might be used as non-biostratigraphic markers10,11. Here, we address these difficulties, developing a robust temporal framework for the Ediacaran Nafun Basin of the Sultanate of Oman, and discussing its implications for the temporal framework of the Ediacaran Period more broadly.
The geological archives of the Ediacaran Nafun and Ara groups (Fig. 1) have been intensively studied, yielding insights into sedimentary environments12,13,14,15,16,17, paleoenvironmental proxies5,18,19,20,21, early biomineralized skeletons22, and biomarker records23,24,25,26. The Shuram excursion, the most negative carbon isotope excursion in Earth history, was first identified in the Nafun Group27. Its origin, cause, consequences, and use as a marker for correlation, remain controversial (Supplementary Table 1)27,28,29.
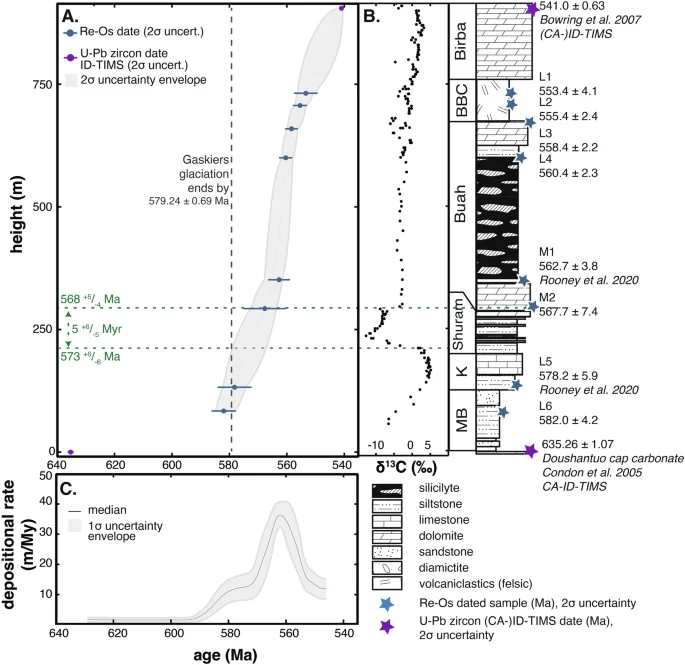
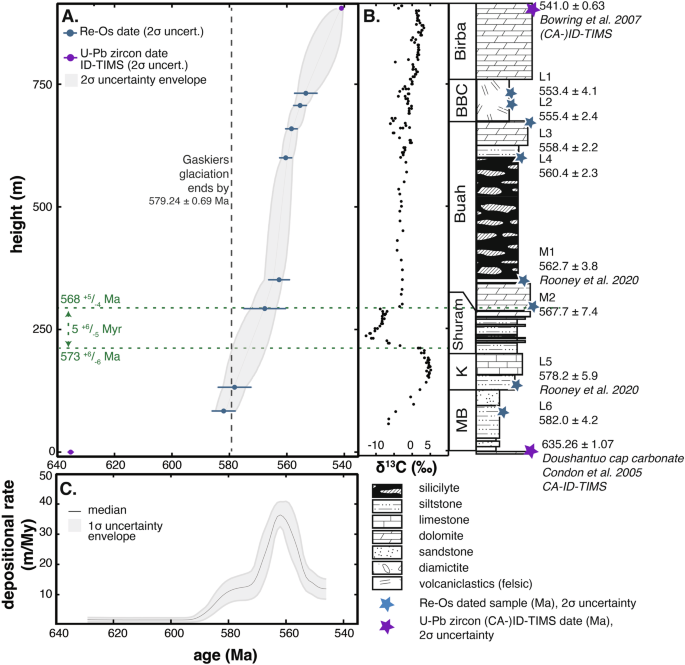
A Age-depth model for the Ediacaran stratigraphy of Oman built including ages presented here and a Bayesian Markov chain Monte Carlo model. Age for end of the Gaskiers glaciation is a constraint on the end of deposition of the Trinity diamictite95. B Litho- and chemostratigraphy of the South Oman Salt Basin from reference well TM-6 with positions of Re-Os geochronological constraints shown ((H: Hadash Fm; K: Khufai Fm; MB: Masirah Bay Fm; BBC: basal Birba clastics). C Depositional rate history for the succession calculated using the age-depth model shown in A indicates an increase in depositional rates in the middle Ediacaran Period.
Prior to recent work28 and this study, direct age constraints on the Nafun and Ara groups were limited to a series of volcanic ashes in the uppermost strata, all younger than 547.23 ± 0.96 Ma29 (chemical abrasion-isotope dilution-thermal ionization mass spectrometry U-Pb zircon age; all geochronological uncertainties in this study are reported either as 2σ or 95% confidence intervals). The Hadash Formation, interpreted as a post-Marinoan cap carbonate, provides age control at the base of the Nafun Group, pinning it at c. 635 Ma based on chronostratigraphic correlation with a dated post-Marinoan cap carbonate from the Yangtze Basin30. Such limited age control on a succession spanning nearly ninety million years of Earth history is a major roadblock for efforts to correlate the rich geological archives of the Nafun Basin to global records and test various hypotheses connecting oceanic oxygenation3,7,31,32, biogeochemical cycling19,33,34,35, animal evolution36,37,38,39,40, and solid-Earth processes41,42,43,44. Ultimately, the lack of radioisotopic age constraints has contributed to broader difficulties establishing a timescale for the Ediacaran Period. Here, we leverage six new geochronological constraints on the Ediacaran succession of Oman to deliver a robust temporal framework for the Nafun Basin and the Ediacaran Period.
Results and Discussion
Six new age constraints for the Nafun Basin
Our six new Re-Os ages (Figs. 1 and 2) occur in stratigraphic superposition and are consistent with existing age control on the Nafun Group and overlying units29,45,46. One new date below the Shuram excursion lies within the upper Masirah Bay Formation (L6), yielding an age of 582.0 ± 4.2 Ma (2-sigma uncertainty, number of points used to construct the isochron [n] = 8, mean square of weighted deviates [MSWD] = 1.5; total uncertainties include the uncertainty in the 187Re constant, λ47). The first constraint above the nadir of the Shuram excursion is 567.7 ± 7.4 Ma (M2, n = 7, MSWD = 0.86), within the lower Buah Formation. Two sample sets within the upper Buah Formation yield ages of 560.4 ± 2.3 Ma (L4, n = 7, MSWD = 0.99) and 558.4 ± 2.2 Ma (L3, n = 6, MSWD = 1.4). Within the basal Birba clastics unit, two dates of 555.4 ± 2.4 Ma (L2, n = 8, MSWD = 1.3) and 553.4 ± 4.1 Ma (L1, n = 9, MSWD = 1) were determined. Re concentrations in samples ranged from 1.77 ng/g to 1416 ng/g and Os concentrations from 86.7 pg/g to 30969 pg/g (Supplemental Data). These are high compared to other Neoproterozoic shales, such as those measured from Zambia48 (Re concentrations from 0.83 ng/g to 14 ng/g; Os concentrations from 54.6-431 pg/g), Northwest Canada28,48 (Re concentrations from 0.63 ng/g to 22.2 ng/g; Os concentrations from 43.6 pg/g to 430 pg/g) or China49 (Re concentrations from 16.7 ng/g to 32.8 ng/g; Os concentrations from 249.7 pg/g to 698.32 pg/g).
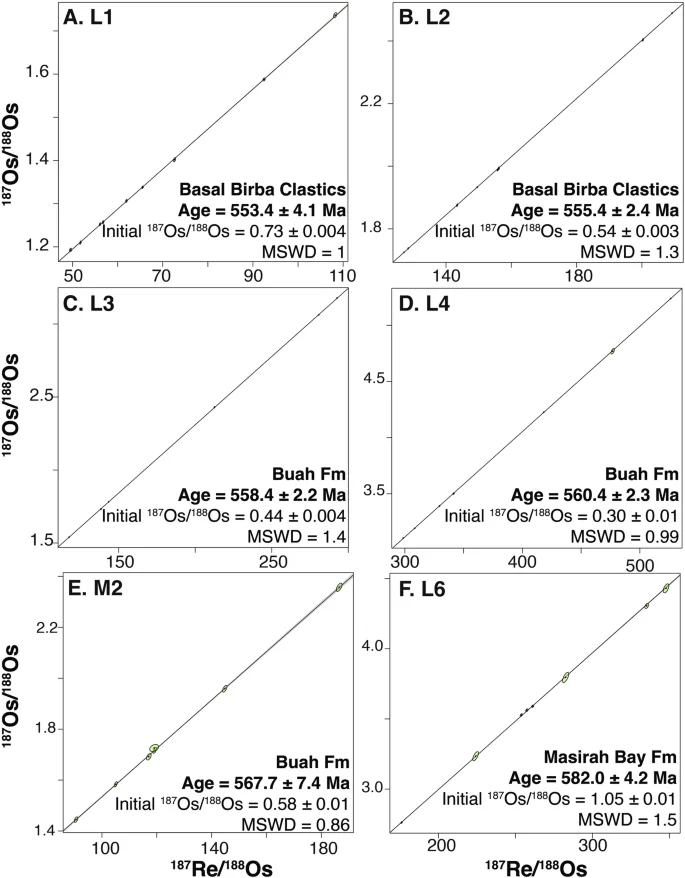
A Sample set L1, Well L. B Sample set L2, Well L. C Sample set L3, Well L. D Sample set L4, Well L. E Sample set M2, Well M. F Sample set L6, Well L.
Initial 187Os/188Os isotope ratios determined for our samples range from 0.3 ± 0.01 to 1.05 ± 0.01(Supplemental Data), and, in general, are more radiogenic upsection. Given limited data density (8 total initial 187Os/188Os isotope ratio measurements from this study and28 over the nearly 100 million years of the Ediacaran Period), and evidence for tectonic reconfiguration and restriction of the Nafun Basin at this time, we do not necessarily interpret these measurements as indicative of global seawater.
New age-depth model for Ediacaran Oman
Our results, in combination with previously published age constraints28,29 are used to develop a stratigraphic Markov chain Monte Carlo age-depth model in a Bayesian framework for the Ediacaran strata of the Sultanate of Oman (Fig. 1). This age-depth model, comprising nine total age constraints on the succession, allows the interpolation of depositional ages for all strata within the succesion. Applying this model, the Shuram excursion occurs at ({573}_{-6}^{+6}) Ma with recovery at ({568}_{-4}^{+5}) Ma and a duration of ({5}_{-5}^{+6}) million years. Most Ediacaran strata in the Nafun Basin were deposited at or after c. 580 Ma in both shallow and deep-water sections (Figs. 1, 3).
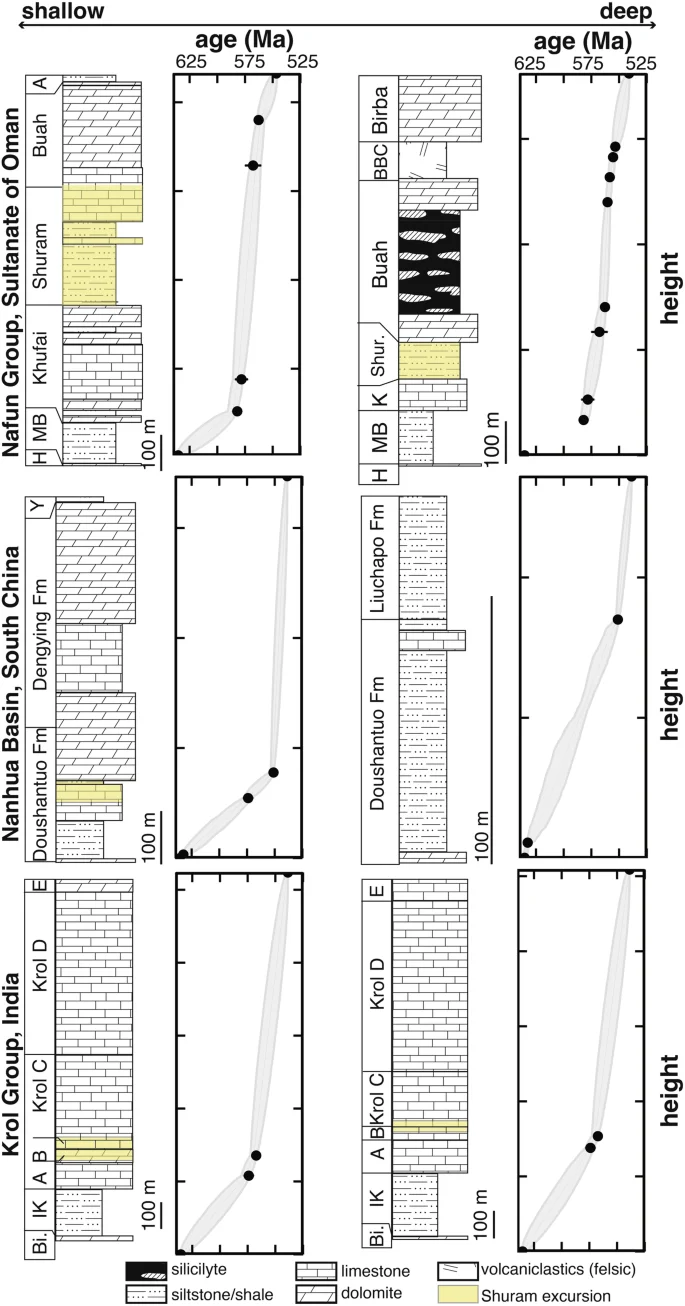
Age depth models for shallower- and deeper-water sections in the Nafun, Nanhua, and Krol basins show that these sections contain relatively thin early Ediacaran strata, with most strata deposited post-c. 580 Ma and post-Shuram excursion. Shaded region is 95% confidence interval. Age constraints, stratigraphic positions of age constraints, and age-depth models are described in Supplementary Data 3-42. Sultantate of Oman: Shallow: Well MQ-1; deep: Well T690. H: Hadash Fm; MB: Masirah Bay Fm; K: Khufai Fm; Shur.: Shuram Fm; BBC: basal Birba clastics; A: Ara Group. Nanhua Basin: Shallow: Jiulongwan–Shipai; deep: Yuanling96,97. Y: Yanjiahe Fm. Krol Basin: Shallow: Mussoorie. Deeper: Nigalidhar98. Bi.: Biani Fm; IK: Infra Krol; A: Krol A; B: Krol B; E: Krol E.
Thin early Ediacaran records across eastern Gondwana
We build age-depth and depositional rate models for Ediacaran successions worldwide, leveraging chemostratigraphic correlation of the Shuram excursion and published age constraints (Supplemental Notes, Supplemental Data). A consistent pattern across the Nafun Basin (Sultanate of Oman), the Yangtze Basin (South China), and the Krol Basin (India) emerges (Fig. 3). In these basins, most strata are of middle and late Ediacaran age, and early Ediacaran strata are comparatively thin. These successions exhibit similar depositional histories, likely due to their eastern Gondwana affinity50,51. These locations transition from passive margin sedimentation to foreland basin during and just after our study interval, capturing the collision of the Arabian Nubian Shield (later part of western Gondwana) with Neoproterozoic India (later part of eastern Gondwana). For simplicity, we refer to these localities as part of “eastern Gondwana”, while acknowledging the evolving nature of this margin during closure of the Mozambique Ocean51,52,53,54,55,56,57,58,59. Backstripping analysis indicates that accommodation increased more rapidly in these locations after c. 580 Ma (Supplemental Fig. S4). An exception is the deeper Yangtze Basin setting, which is more weakly constrained in time because the strata lack a clear Shuram excursion (Fig. 3), but which still shows a slight increase in accumulation rate in the late Ediacaran Period. Southern Australia also has a Gondwanan affinity50 but shows more steady sediment accumulation over the interval (Supplemental Figs. S2, S3).
Globally, other Ediacaran successions, including the Nama Group60,61,62, Siberian platform63, and South American basins including the Bambui, Arroyo del Soldado and Araras groups64, have extensive mid- to late Ediacaran strata and relatively thin early Ediacaran strata (Supplemental Notes). In contrast, successions along the western margin of Laurentia show relatively steady accumulation rates (Supplemental Figs. S2, S3).
A temporal framework for the middle and late Ediacaran Period
The Nafun Basin is among the best-characterized records of environmental change just prior to and during the diversification of early animals5,12,18,19,20,24,25,26,65,66,67,68,69. This succession is well-exposed in outcrop, with hundreds of meters archived in core repository. The preservation, continuity, richness, and robust age control of the Nafun Basin make it a key global reference section for studies of Earth’s environments during the first recorded diversification of animals. With the age model developed here, the ages of most Ediacaran strata in the Nafun Basin are now constrained to within a few million years (Fig. 1). This provides age control and constraints on sedimentation, which is a critical—but often overlooked—parameter for generating accurate mechanistic geochemical models of Ediacaran Earth system evolution.
These results also bear on the duration and extent of Earth’s largest negative carbon isotope excursion, the Shuram excursion. This excursion was first described in Oman before being identified in many middle Ediacaran basins globally. The origin and environmental or evolutionary significance of the Shuram excursion are debated. These new constraints, combined with our new Bayesian age-depth model, limit the Shuram excursion in the Nafun Basin to ({5}_{-5}^{+6}) million years, a meaningful improvement over a previous estimate, based only on two dates, of <15.5 ± 7.0 million years28. Age control on the onset, recovery, and duration of the excursion in the Nafun Basin are wholly consistent with independent constraints from Northwest Canada28. This buttresses interpretations of the excursion as a globally synchronized event, at least at a timescale of several millions of years or less. This, in turn, strengthens support for models of the excursion as either a primary or globally synchronized, early diagenetic event which postdates the Gaskiers glaciation, in contrast to hypotheses suggesting the excursion is globally diachronous70 (Supplemental Table S1).
Condensation and Ediacaran geochemical records
In several basins across the eastern Gondwanan margin, the record of early Ediacaran sedimentation is either condensed, marked by major hiatus(es), or both (Fig. 3). The Nafun Basin and Yangtze Basin both fall on this margin and are among the most intensively characterized Ediacaran successions in the world. Either condensation or the presence of hiatal surfaces has important implications for the interpretation of their geochemical records. Hiatal surfaces would cause gaps, but in Oman, there is no evidence for major hiatal surfaces in basinal cores. Instead, existing geological data support a condensed Masirah Bay Formation (Fig. 3; though note that in grabens, the Masirah Bay Fm can be >1200 m in thickness66). Condensation is also apparent in the Yangtze Basin of South China71. Direct age control on the Krol Group of India is lacking, but the similarities and correlations between the Krol strata and the Nafun Basin52 support early Ediacaran condensation in the Krol Group, as well (Fig. 3). Low net sedimentation rates in the early Ediacaran records from these locations are not only the result of the Sadler effect, the intrinsic property of the sedimentary record in which the sedimentation rate of strata decreases over longer time intervals due to the non-steady nature of sediment accumulation (Supplemental Notes; Supplemental Figs. S5-S7).
A frequently described hypothesis for the appearance and diversification of animals in the Ediacaran Period is that greater environmental oxygenation permitted the evolution of complex, oxygen-dependent animals (e.g., see discussion in refs. 37,72), with geochemical redox proxies, sedimentary phosphate abundance, and organic carbon concentration all feeding into the argument. However, elemental concentrations alone may be misleading during this critical interval of animal evolution, because sedimentation rate exerts a major influence on a range of concentration data used to draw inferences about pO2 and productivity32,73,74. Phosphate availability, for example, is key to both primary production and oxygenation75,76. The concentrations of phosphorus (P) in Ediacaran rocks are fairly static75 but our results demonstrate that depositional rates in key sections are not. Therefore, geochemical models that infer a constant elemental burial flux from steady geochemical concentrations may well underestimate late Ediacaran oxygenation. Conversely, elevated abundances of redox-sensitive elements in lower Ediacaran shales could result from enrichment due to low sedimentation rates, rather than deposition in an oxic water column32.
Similar concerns apply to isotope proxy records. For example, if uranium is reduced in the water column of an anoxic basin, then systematic changes in sedimentation rate would produce large variations in uranium isotope records unrelated to redox changes, and higher sedimentation rates would produce more positive δ238U values—the same signature as increased oxygenation77. Water column reduction of uranium is not observed in modern anoxic basins, but this illustrative sedimentation rate dependency should motivate caution in considering redox proxy records in the absence of robust sedimentation rate data. Indeed, sulfur isotope records used to infer environmental oxygenation5 have proven to be highly dependent on sedimentation rate73.
We also note that sedimentation rate provides a critical control on the preservation of organisms and their traces in the fossil record78. Diverse early macroscopic Ediacaran fossils occur in strata with high sedimentation rates relative to the Nafun and Nanhua basins, such as the Rackla Group of Northwest Canada79 (Supplemental Fig. S2) or the Conception Group of Newfoundland80. The expansion of the late Ediacaran sedimentary record typically aligns with stratigraphic evidence for transgression and the resulting expansion of shallow marine environments (Supplemental Notes and references therein). The expansion of both the fossil and sedimentary record in the late Ediacaran record of North America has been noted81. The laterally heterogenous nature of shallow marine environments has been hypothesized as an evolutionary driver for greater diversity in both late Ediacaran shallow and, indirectly, deep-water communities82. That said, changing sea levels may also have imposed a strong taphonomic bias to the record by altering the ratio of shallow and deep-water deposits, as may be seen in the paleontological record of other eras83.
Clearly, disentangling the true relationships between changes in life and environments through the Ediacaran Period will require that fossils and geochemical data be interpreted within a detailed framework of space, time, taphonomy, and depositional environment. Our results demonstrate the importance of coupling radiometric ages and age depth modeling to constrain and quantify sedimentation rates at both the basin and regional scale when evaluating ocean redox patterns and concomitant evolutionary innovations.
Conclusion
The expanded nature of the late—and the relative thinness or absence of the early—Ediacaran record seen in multiple basins across eastern Gondwana, as well as in basins across southern Namibia60,61,62, Siberia63, and some in South America64, present a key geological limitation on our understanding of the Ediacaran Period. Our findings draw attention to the importance of basins with expanded early Ediacaran sections, like those in northern Namibia84, Mongolia85, northwest Canada86, the Parecis Basin of Brazil87, for improving our understanding of the period geochemically and biologically. The temporal framework developed here for the Nafun Basin provides us with a robustly dated, geochemically well-characterized, exceptionally well-preserved, high-resolution reference section for studies of the middle and late Ediacaran Period. Our results highlight the need for a critical reappraisal of the role of sedimentation and burial rates for understanding how, and if, environmental changes, including increasing oxygenation, were implicated in the emergence and diversification of animal life. Our results lend geochronological support support to field evidence for condensation and/or hiatus in Ediacaran sedimentary records, with far-reaching implications for those working on paleontology, stratigraphy, sedimentology, geochemistry and the overall evolution of the Earth system during this key time interval.
Online Methods
Re-Os geochronology
Six sample sets of organic-rich rock were taken from Wells L and M, two drill cores in the South Oman Salt Basin drilled by Petroleum Development Oman in the last decade. Each group of samples included between 6 and 9 subsamples. These drill cores sample deep-water environments below storm weather wave base. Subsamples were taken vertically, over intervals spanning 0.81 m (L6), 0.80 m (L5), 0.87 m (L4), 0.92 m (L3), 0.97 m (L2), 0.85 m (L1), 1.38 m (M2), and 1.41 m (M1). Although sampled vertically, sample suites show little internal variation in initial 187Os/188Os values (Table S1). Radioisotopic analyses were performed at the Yale Geochemistry and Geochronology Center; the full methodology is described in the Supplementary Text.
These samples’ stratigraphic positions within a key reference well for the South Oman Salt Basin, well TM-6, shown in Fig. 1, following a correlation model based on outcrop, subsurface, geochronological and geochemical data recently adopted by Petroleum Development Oman (Figure S2)88. Well TM-6 is a key reference well for studies of the South Oman Salt Basin and has been widely studied5,89,90,91.
Age-depth modeling
The age-depth models presented here (Fig. 1) are calculated using a stratigraphic Markov chain Monte Carlo model in a Bayesian framework92,93. Due to the large time gap and lack of constraints between the post-Marinoan cap carbonate and our first dated interval in the Nafun Basin, we exclude this section of stratigraphy from the age-depth model. We correlate the post-Marinoan cap carbonate, the Hadash Fm, with the post-Marinoan cap carbonate from the Yangtze Basin, which has a date constrained by CA-ID-TIMS zircon dating30. We use other published geochronological constraints and assume synchroneity of the Shuram excursion globally to develop age-depth models for other Ediacaran basins; more details for each basin are outlined in the Supplement. Backstripping analysis for selected sections was performed using Backstrip (Supplemental Fig. S4)94.
Data availability
All data needed to reproduce the analyses shown here are included in the Supplement and on the Open Science Framework at https://osf.io/kdjux/.
Code availability
Code is available on the Open Science Framework at https://osf.io/kdjux/.
References
-
Hoffman, P. F. et al. Snowball Earth climate dynamics and Cryogenian geology-geobiology. Sci. Adv. 3, (2017).
-
Erwin, D. H. et al. The Cambrian conundrum: early divergence and later ecological success in the early history of animals. Science 334, 1091–1097 (2011).
Google Scholar
-
Sahoo, S. K. et al. Oceanic oxygenation events in the anoxic Ediacaran Ocean. 457–468. https://doi.org/10.1111/gbi.12182 (2016).
-
McFadden, K. A. et al. Pulsed oxidation and biological evolution in the Ediacaran Doushantuo Formation. Proc. Natl. Acad. Sci. USA 105, 3197–3202 (2008).
Google Scholar
-
Fike, D. A., Grotzinger, J. P., Pratt, L. M. & Summons, R. E. Oxidation of the Ediacaran ocean. Nature 444, 744–747 (2006).
Google Scholar
-
Zhang, F. et al. Global marine redox changes drove the rise and fall of the Ediacara biota. Geobiology 17, 594–610 https://doi.org/10.1111/gbi.12359 (2019).
-
Li, Z. et al. Transient and stepwise ocean oxygenation during the late Ediacaran Shuram Excursion: Insights from carbonate δ238U of northwestern Mexico. Precambrian Res 344, 105741 (2020).
Google Scholar
-
Halverson, G. P., Hoffman, P. F., Schrag, D. P., Maloof, A. C. & Rice, A. H. N. Toward a Neoproterozoic composite carbon-isotope record. Bull. Geol. Soc. Am. 117, 1181–1207 (2005).
Google Scholar
-
Grotzinger, J. P., Fike, D. A. & Fischer, W. W. Enigmatic origin of the largest-known carbon isotope excursion in Earth’s history. Nat. Geosci. 4, 285–292 (2011).
Google Scholar
-
Xiao, S. et al. Towards an Ediacaran Time Scale: Problems, Protocols, and Prospects. Episodes 39, 540 (2016).
Google Scholar
-
Gradstein, F. M., Ogg, J. G., Schmitz, M. D. & Ogg, G. M. Geological Time Scale 2020. (Elsevier, 2020).
-
Allen, P. A. The Huqf Supergroup of Oman: Basin development and context for Neoproterozoic glaciation. Earth Sci. Rev. 84, 139–185 (2007).
Google Scholar
-
Allen, P. A., Leather, J. & Brasier, M. D. The Neoproterozoic Fiq glaciation and its aftermath, Huqf Supergroup of Oman. Basin Res. 16, 507–534 (2004).
Google Scholar
-
Amthor, J. E. et al. Extinction of Cloudina and Namacalathus at the Precambrian-Cambrian boundary in Oman. Geology 31, 431–434 (2003).
Google Scholar
-
Osburn, M., Grotzinger, J. & Bergmann, K. Facies, stratigraphy, and evolution of a middle Ediacaran carbonate ramp: Khufai Formation, Sultanate of Oman. Am. Assoc. Pet. Geol. Bull. 98, 1631–1667 (2014).
-
Schröder, S. et al. Stratigraphy and environmental conditions of the terminal Neoproterozoic-Cambrian Period in Oman: evidence from sulphur isotopes. J. Geol. Soc. Lond. 161, 489–499 (2004).
Google Scholar
-
Nicholas, C. J. & Gold, S. E. P. Ediacaran–Cambrian Sirab Formation of the Al Huqf region, Sultanate of Oman. GeoArabia 17, 49–98 (2012).
Google Scholar
-
Bergmann, K. D., Al Balushi, S. A. K., Mackey, T. J., Grotzinger, J. P. & Eiler, J. M. A 600-million-year carbonate clumped-isotope record from the Sultanate of Oman. J. Sediment. Res. 88, 960–979 (2018).
Google Scholar
-
Osburn, M. R., Owens, J., Bergmann, K. D., Lyons, T. W. & Grotzinger, J. P. Dynamic changes in sulfate sulfur isotopes preceding the Ediacaran Shuram Excursion. Geochim Cosmochim. Acta 170, 204–224 (2015).
Google Scholar
-
Stolper, D. A. et al. Paleoecology and paleoceanography of the Athel silicilyte, Ediacaran-Cambrian boundary, Sultanate of Oman. Geobiology 15, 401–426 (2017).
Google Scholar
-
Wu, N., Farquhar, J. & Fike, D. A. Ediacaran sulfur cycle: Insights from sulfur isotope measurements (δ33S and δ34S) on paired sulfate-pyrite in the Huqf Supergroup of Oman. Geochim Cosmochim. Acta 164, 352–364 (2015).
Google Scholar
-
Conway Morris, S., Mattes, B. W. & Chen, M. The early skeletal organism Cloudina: new occurrences from Oman and possibly China. Am. J. Sci. 290, 245–260 (1990).
-
Grosjean, E., Love, G. D., Kelly, A. E., Taylor, P. N. & Summons, R. E. Geochemical evidence for an Early Cambrian origin of the ‘Q’ oils and some condensates from north Oman. Org. Geochem 45, 77–90 (2012).
Google Scholar
-
Love, G. D. et al. Fossil steroids record the appearance of Demospongiae during the Cryogenian period. Nature 457, 718–721 (2009).
Google Scholar
-
Roussel, A., Cui, X. & Summons, R. E. Biomarker stratigraphy in the Athel Trough of the South Oman Salt Basin at the Ediacaran-Cambrian Boundary. Geobiology 18, 663–681 (2020).
Google Scholar
-
Zumberge, J. A. et al. Demosponge steroid biomarker 26-methylstigmastane provides evidence for Neoproterozoic animals. Nat. Ecol. Evol. 2, 1709–1714 (2018).
Google Scholar
-
Burns, S. J. & Matter, A. Carbon isotopic record of the latest Proterozoic from Oman. Eclogae Geologicae Helvetiae 86, 595–607 (1993).
-
Rooney, A. D. et al. Calibrating the coevolution of Ediacaran life and environment. Proc. Natl. Acad. Sci. USA 117, 16824–16830 (2020).
Google Scholar
-
Bowring, S. A. et al. Geochronologic constraints on the chronostratigraphic framework of the Neoproterozoic Huqf Supergroup, Sultanate of Oman. Am. J. Sci. 307, 1097–1145 (2007).
Google Scholar
-
Condon, D. et al. U-Pb Ages from the Neoproterozoic Doushantuo Formation, China. Science 308, 95–98 (2005).
Google Scholar
-
Williams, J. J., Mills, B. J. W. & Lenton, T. M. A tectonically driven Ediacaran oxygenation event. Nat. Commun. 10, 1–10 (2019).
Google Scholar
-
Ostrander, C. M. Mulling and nulling the coeval rise of Ediacaran oxygen and animals. Earth Planet Sci. Lett. 614, 118187 (2023).
Google Scholar
-
Lee, C., Love, G. D., Fischer, W. W., Grotzinger, J. P. & Halverson, G. P. Marine organic matter cycling during the Ediacaran Shuram excursion. Geology 43, 1103–1106 (2015).
Google Scholar
-
Busch, J. F. et al. Global and local drivers of the Ediacaran Shuram carbon isotope excursion. Earth Planet Sci. Lett. 579, 117368 (2022).
Google Scholar
-
Ostrander, C. M. et al. Widespread seafloor anoxia during generation of the Ediacaran Shuram carbon isotope excursion. Geobiology. https://doi.org/10.1111/gbi.12557 (2023).
-
Sperling, E. A. et al. Oxygen, facies, and secular controls on the appearance of Cryogenian and Ediacaran body and trace fossils in the Mackenzie Mountains of northwestern Canada. Bull. Geol. Soc. Am. 128, 558–575 (2016).
Google Scholar
-
Droser, M. L., Tarhan, L. G. & Gehling, J. G. The Rise of Animals in a Changing Environment: Global Ecological Innovation in the Late Ediacaran. Annu Rev. Earth Planet Sci. 45, 593–617 (2017).
Google Scholar
-
Cai, Y., Xiao, S., Li, G. & Hua, H. Diverse biomineralizing animals in the terminal Ediacaran Period herald the Cambrian explosion. Geology 47, 380–384 (2019).
Google Scholar
-
Shen, Y., Zhang, T. & Hoffman, P. F. On the coevolution of Ediacaran oceans and animals. Proc. Natl Acad. Sci. USA 105, 7376–7381 (2008).
Google Scholar
-
Johnston, D. T. et al. Searching for an oxygenation event in the fossiliferous Ediacaran of northwestern Canada. Chem. Geol. 362, 273–286 (2013).
Google Scholar
-
Levashova, N. M. et al. Late Ediacaran magnetic field hyperactivity: Quantifying the reversal frequency in the Zigan Formation, Southern Urals, Russia. Gondwana Res. 94, 133–142 (2021).
Google Scholar
-
Abrajevitch, A. & Van der Voo, R. Incompatible Ediacaran paleomagnetic directions suggest an equatorial geomagnetic dipole hypothesis. Earth Planet Sci. Lett. 293, 164–170 (2010).
Google Scholar
-
McCausland, P. J. A., Van der Voo, R. & Hall, C. M. Circum-Iapetus paleogeography of the Precambrian-Cambrian transition with a new paleomagnetic constraint from Laurentia. Precambrian Res 156, 125–152 (2007).
Google Scholar
-
McCausland, P. J. A., Hankard, F., Van der Voo, R. & Hall, C. M. Ediacaran paleogeography of Laurentia: Paleomagnetism and 40Ar-39Ar geochronology of the 583Ma Baie des Moutons syenite, Quebec. Precambrian Res 187, 58–78 (2011).
Google Scholar
-
Brasier, M. et al. New U-Pb zircon dates for the Neoproterozoic Ghubrah glaciation and for the top of the Huqf Supergroup, Oman. Geology 28, 175–178 (2000).
Google Scholar
-
Le Guerroué, E., Allen, P. A., Cozzi, A., Etienne, J. L. & Fanning, M. 50 Myr recovery from the largest negative δ13 C excursion in the Ediacaran ocean. Terra Nova 18, 147–153 (2006).
Google Scholar
-
Smoliar, M., Walker, R. J. & Morgan, J. W. Re-Os Ages of Group IIA, IIIA, IVA, and IVB Iron Meteorites. Science 271, (1996).
-
Rooney, A. D., Strauss, J. V., Brandon, A. D. & Macdonald, F. A. A Cryogenian chronology: Two long-lasting synchronous Neoproterozoic glaciations. Geology 43, 459–462 (2015).
Google Scholar
-
Rooney, A. D., Yang, C., Condon, D. J., Zhu, M. & Macdonald, F. A. U-Pb and Re-Os geochronology tracks stratigraphic condensation in the Sturtian snowball Earth aftermath. Geology 48, 625–629 (2020).
Google Scholar
-
Hoffman, P. F. & Li, Z. X. A palaeogeographic context for Neoproterozoic glaciation. Palaeogeogr. Palaeoclimatol. Palaeoecol. 277, 158–172 (2009).
Google Scholar
-
Gómez-Pérez, I., Morton, A., Al Rawahi, H. & Frei, D. Oman as a fragment of Ediacaran eastern Gondwana. Geology. https://doi.org/10.1130/G51989.1 (2024).
-
Cozzi, A., Rea, G. & Craig, J. From global geology to hydrocarbon exploration: Ediacaran-early Cambrian petroleum plays of India, Pakistan and Oman. Geol. Soc. Spec. Publ. 366, 131–162 (2012).
Google Scholar
-
Whitehouse, M. J., Pease, V. & Al-Khirbash, S. Neoproterozoic crustal growth at the margin of the East Gondwana continent–age and isotopic constraints from the easternmost inliers of Oman. Int Geol. Rev. 58, 2046–2064 (2016).
Google Scholar
-
Alessio, B. L. et al. Origin and tectonic evolution of the NE basement of Oman: A window into the Neoproterozoic accretionary growth of India? Geol. Mag. 155, 1150–1174 (2018).
Google Scholar
-
de Wall, H., Pandit, M. K., Sharma, K. K., Schöbel, S. & Just, J. Deformation and granite intrusion in the Sirohi area, SW Rajasthan—Constraints on Cryogenian to Pan-African crustal dynamics of NW India. Precambrian Res 254, 1–18 (2014).
Google Scholar
-
Denèle, Y. et al. The Cryogenian arc formation and successive high-K calc–alkaline plutons of Socotra Island (Yemen). Arab. J. Geosci. 5, 903–924 (2012).
Google Scholar
-
Rantakokko, N. E., Whitehouse, M. J., Pease, V. & Windley, B. F. Neoproterozoic evolution of the eastern Arabian basement based on a refined geochronology of the Marbat region, Sultanate of Oman. Geol. Soc., Lond., Spec. Publ. 392, 107–127 (2014).
Google Scholar
-
Merdith, A. S. et al. Extending full-plate tectonic models into deep time: Linking the Neoproterozoic and the Phanerozoic. Earth Sci. Rev. 214, 103477 (2021).
Google Scholar
-
Zhao, Z. et al. Estimating the relationship between South China and Gondwana based on big data analysis. Palaeogeogr Palaeoclimatol Palaeoecol 112439. https://doi.org/10.1016/j.palaeo.2024.112439 (2024).
-
Nelson, L. L. et al. Pushing the boundary: A calibrated Ediacaran-Cambrian stratigraphic record from the Nama Group in northwestern Republic of South Africa. Earth Planet Sci. Lett. 580, 117396 (2022).
Google Scholar
-
Saylor, B. Z., Kaufman, A. J., Grotzinger, J. P. & Urban, F. A composite reference section for terminal Proterozoic strata of southern Namibia. J. Sediment. Res. 68, 1223–1235 (1998).
Google Scholar
-
Hohl, S. V. et al. C, Sr, Nd isotope chemostratigraphy and zircon provenance of the Witvlei Group (Namibia): Neoproterozoic glaciations and seawater evolution. Precambrian Res 372, 106600 (2022).
Google Scholar
-
Pelechaty, S. M. Integrated chronostratigraphy of the Vendian System of Siberia: Implications for a global stratigraphy. J. Geol. Soc. Lond. 155, 957–973 (1998).
Google Scholar
-
Sial, A. N. et al. Correlations of some Neoproterozoic carbonate-dominated successions in South America based on high-resolution chemostratigraphy. Braz. J. Geol. 46, 439–488 (2016).
Google Scholar
-
Grosjean, E., Love, G. D., Stalvies, C., Fike, D. A. & Summons, R. E. Origin of petroleum in the Neoproterozoic-Cambrian South Oman Salt Basin. Org. Geochem 40, 87–110 (2009).
Google Scholar
-
Allen, P. A. & Leather, J. Post-Marinoan marine siliciclastic sedimentation: The Masirah Bay Formation, Neoproterozoic Huqf Supergroup of Oman. Precambrian Res 144, 167–198 (2006).
Google Scholar
-
Cozzi, A., Grotzinger, J. P. & Allen, P. A. Evolution of a terminal Neoproterozoic carbonate ramp system (Buah Formation, Sultanate of Oman): Effects of basement paleotopography. Bull. Geol. Soc. Am. 116, 1367–1384 (2004).
Google Scholar
-
Cozzi, A., Allen, P. A. & Grotzinger, J. P. Understanding carbonate ramp dynamics using δ13C profiles: Examples from the Neoproterozoic Buah Formation of Oman. Terra Nova 16, 62–67 (2004).
Google Scholar
-
Rieu, R., Allen, P. A., Cozzi, A., Kosler, J. & Bussy, F. A composite stratigraphy for the Neoproterozoic Huqf Supergroup of Oman: integrating new litho-, chemo- and chronostratigraphic data of the Mirbat area, southern Oman. J. Geol. Soc. Lond. 164, 997–1009 (2007).
Google Scholar
-
Giles, S. M., Christie-Blick, N. & Lankford-Bravo, D. F. A subaerial origin for the mid-Ediacaran Johnnie valleys, California and Nevada: Implications for a diachronous onset of the Shuram excursion. Precambrian Res 397, 107187 (2023).
Google Scholar
-
Yang, C. et al. The tempo of Ediacaran evolution. Sci. Adv. 7, 9643 (2021).
Google Scholar
-
Hoyal Cuthill, J. F. & Conway Morris, S. Nutrient-dependent growth underpinned the Ediacaran transition to large body size. Nat. Ecol. Evol. 1, 1201–1204 (2017).
Google Scholar
-
Liu, X. et al. Pyrite sulfur isotopes constrained by sedimentation rates: Evidence from sediments on the East China Sea inner shelf since the late Pleistocene. Chem. Geol. 505, 66–75 (2019).
Google Scholar
-
Zindorf, M. et al. Reconstructing oxygen deficiency in the glacial Gulf of Alaska: Combining biomarkers and trace metals as paleo-redox proxies. Chem Geol 558, (2020).
-
Laakso, T. A., Sperling, E. A., Johnston, D. T. & Knoll, A. H. Ediacaran reorganization of the marine phosphorus cycle. Proc. Natl Acad. Sci. 117, 11961–11967 (2020).
Google Scholar
-
Reinhard, C. T. et al. Evolution of the global phosphorus cycle. Nature 541, 386–389 (2017).
Google Scholar
-
Lau, K. V., Lyons, T. W. & Maher, K. Uranium reduction and isotopic fractionation in reducing sediments: Insights from reactive transport modeling. Geochim Cosmochim. Acta 287, 65–92 (2020).
Google Scholar
-
Brett, C. E. & Baird, G. C. Comparative Taphonomy: A Key to Paleoenvironmental Interpretation Based on Fossil Preservation. vol. 1 https://www.jstor.org/stable/3514686?seq=1&cid=pdf (1986).
-
Boag, T. H. et al. Deep-water first occurrences of Ediacara biota prior to the Shuram carbon isotope excursion in the Wernecke Mountains, Yukon, Canada. in Geoconvention vol. 285 (Royal Society Publishing, 2020).
-
Matthews, J. J. et al. A Chronostratigraphic Framework for the Rise of the Ediacaran Macrobiota: New Constraints from Mistaken Point Ecological Reserve, Newfoundland. Bull. Geol. Soc. Am. 133, 612–624 (2021).
Google Scholar
-
Segessenman, D. C. & Peters, S. E. Transgression-regression cycles drive correlations in Ediacaran-Cambrian rock and fossil records. Paleobiology 50, 150–163 (2024).
Google Scholar
-
Mitchell, E. G. et al. The influence of environmental setting on the community ecology of Ediacaran organisms: Ediacaran environmental ecology. Interface Focus 10, (2020).
-
Smith et al. Sea-level change and rock-record bias in the Cretaceous: a problem for extinction and biodiversity studies. Paleobiology 27, 241–253 (2001).
Google Scholar
-
Hoffman, P. F. et al. Snowballs in Africa: sectioning a long-lived Neoproterozoic carbonate platform and its bathyal foreslope (NW Namibia). Earth-Science Reviews 219, 103616 https://doi.org/10.1016/j.earscirev.2021.103616 (2021).
-
Bold, U. et al. Neoproterozoic stratigraphy of the Zavkhan terrane of Mongolia: The backbone for Cryogenian and early Ediacaran chemostratigraphic records. Am. J. Sci. 315, 1–63 (2016).
Google Scholar
-
Moynihan, D. P., Strauss, J. V., Nelson, L. L. & Padget, C. D. Upper Windermere Supergroup and the transition from rifting to continent-margin sedimentation, Nadaleen River area, northern Canadian Cordillera. GSA Bulletin 1–29 https://doi.org/10.1130/b32039.1 (2019).
-
Lamoso, I. S. M. Quimioestratigrafia isotópica (C, O, Sr) de carbonatos neoproterozoicos da Bacia dos Parecis, Cráton Amazônico. (Universidade de São Paulo, São Paulo, 2023). https://doi.org/10.11606/D.44.2023.tde-11042023-085134.
-
Gomez-Perez, I., Farqani, S., Scholten, S., Rovira, A. & Baloushi, B. The Precambrian succession of Oman from Platform to Basin: Predicting reservoir and source rock distribution. In Seventh Arabian Plate Geology Workshop: Pre-Cambrian to Paleozoic Petroleum Systems in the Arabian Plate (2018).
-
Amthor, J. E., Ramseyer, K., Faulkner, T. & Lucas, P. Stratigraphy and sedimentology of a chert reservoir at the Precambrian-Cambrian boundary: The Al Shomou Silicilyte, South Oman Salt Basin. GeoArabia 10, 89–122 (2005).
Google Scholar
-
Forbes, G. A., Jansen, H. S. M. & Schreurs, J. Lexicon of Oman: Subsurface Stratigraphy: Reference Guide to the Stratigraphy of Oman’s Hydrocarbon Basins. (Gulf PetroLink, Manama, Bahrain, 2010).
-
Lee, C. et al. Carbon isotopes and lipid biomarkers from organic-rich facies of the Shuram Formation, Sultanate of Oman. Geobiology 11, 406–419 (2013).
Google Scholar
-
Keller, C. B. Chron.jl: A Bayesian framework for integrated eruption age and age-depth modelling. osf.io. https://doi.org/10.17605/OSF.IO/TQX3F (2018).
-
Bezanson, J., Edelman, A., Karpinski, S. & Shah, V. B. Julia: A Fresh Approach to Numerical Computing. SIAM Rev. 59, 65–98 (2017).
Google Scholar
-
Holland, S. M. Backstrip, version 1.1. www.huntmountainsoftware.com.
-
Pu, J. P. et al. Dodging snowballs: Geochronology of the Gaskiers glaciation and the first appearance of the Ediacaran biota. Geology 44, 955–958 (2016).
Google Scholar
-
Jiang, G., Shi, X., Zhang, S., Wang, Y. & Xiao, S. Stratigraphy and paleogeography of the Ediacaran Doushantuo Formation (ca. 635-551 Ma) in South China. Gondwana Res. 19, 831–849 (2011).
Google Scholar
-
Jiang, G., Kaufman, A. J., Christie-Blick, N., Zhang, S. & Wu, H. Carbon isotope variability across the Ediacaran Yangtze platform in South China: Implications for a large surface-to-deep ocean δ13C gradient. Earth Planet Sci. Lett. 261, 303–320 (2007).
Google Scholar
-
Kaufman, A. J., Jiang, G., Christie-Blick, N., Banerjee, D. M. & Rai, V. Stable isotope record of the terminal Neoproterozoic Krol platform in the Lesser Himalayas of northern India. Precambrian Res 147, 156–185 (2006).
Google Scholar
Acknowledgements
We thank the Ministry of Energy and Minerals of the Sultanate of Oman and Petroleum Development Oman for permission to export samples, publish these results, and for fieldwork and analytical support. We thank Z. Rawahi at PDO in particular for support of this work. We thank Brenhin Keller for assistance applying Chron.jl. K.D.B. acknowledges funding from the Packard Foundation, 2018-68044. A.D.R. acknowledges U.S. National Science Foundation (NSF) grant EAR-2021319. Portions of this paper were developed from the thesis of M.D.C. Constructive feedback from Oli Jagoutz, Tony Prave, Adam Maloof, Fabricio Caxito, Paul Hoffman, and three anonymous reviewers improved this manuscript.
Author information
Authors and Affiliations
Contributions
M.D.C.: Conceptualization, methodology, software, investigation, data curation, writing—original draft, writing—review and editing, visualization. A.D.R.: Conceptualization, methodology, investigation, writing—review and editing, visualization, resources, funding acquisition. AHK: Writing—review and editing. I.G.P.: resources, investigation, writing—review and editing. B.B.: Resources, writing—review and editing. K.D.B.: Conceptualization, methodology, writing—review and editing, visualization, supervision, funding acquisition, resources, project administration.
Corresponding author
Ethics declarations
Competing interests
The authors declare no competing interests.
Peer review
Peer review information
Communications Earth & Environment thanks Fabricio Caxito and the other, anonymous, reviewer(s) for their contribution to the peer review of this work. Primary Handling Editor: Carolina Ortiz Guerrero. A peer review file is available.
Additional information
Publisher’s note Springer Nature remains neutral with regard to jurisdictional claims in published maps and institutional affiliations.
Supplementary information
Supplemental Material
Supplemental data
Transparent Peer Review file
Description of Additional Supplementary Files
Rights and permissions
Open Access This article is licensed under a Creative Commons Attribution 4.0 International License, which permits use, sharing, adaptation, distribution and reproduction in any medium or format, as long as you give appropriate credit to the original author(s) and the source, provide a link to the Creative Commons licence, and indicate if changes were made. The images or other third party material in this article are included in the article’s Creative Commons licence, unless indicated otherwise in a credit line to the material. If material is not included in the article’s Creative Commons licence and your intended use is not permitted by statutory regulation or exceeds the permitted use, you will need to obtain permission directly from the copyright holder. To view a copy of this licence, visit http://creativecommons.org/licenses/by/4.0/.
Reprints and permissions
About this article
Cite this article
Cantine, M.D., Rooney, A.D., Knoll, A.H. et al. Chronology of Ediacaran sedimentary and biogeochemical shifts along eastern Gondwanan margins.
Commun Earth Environ 5, 520 (2024). https://doi.org/10.1038/s43247-024-01630-1
-
Received: 15 January 2024
-
Accepted: 14 August 2024
-
Published: 19 September 2024
-
DOI: https://doi.org/10.1038/s43247-024-01630-1
Comments
By submitting a comment you agree to abide by our Terms and Community Guidelines. If you find something abusive or that does not comply with our terms or guidelines please flag it as inappropriate.