Abstract
Classifying individuals based on metabotypes and lifestyle phenotypes using exploratory factor analyses, cluster definition, and machine-learning algorithms is promising for precision chronic disease prevention and management. This study analyzed data from the NUTRiMDEA online cohort (baseline: n = 17332 and 62 questions) to develop a clustering tool based on 32 accessible questions using machine-learning strategies. Participants ranged from 18 to over 70 years old, with 64.1% female and 35.5% male. Five clusters were identified, combining metabolic, lifestyle, and personal data: Cluster 1 (“Westernized Millennial”, n = 967) included healthy young individuals with fair lifestyle habits; Cluster 2 (“Healthy”, n = 10616) consisted of healthy adults; Cluster 3 (“Mediterranean Young Adult”, n = 2013) represented healthy young adults with a healthy lifestyle and showed the highest adherence to the Mediterranean diet; Cluster 4 (“Pre-morbid”, n = 600) was characterized by healthy adults with declined mood; Cluster 5 (“Pro-morbid”, n = 312) comprised older individuals (47% >55 years) with poorer lifestyle habits, worse health, and a lower health-related quality of life. A computational algorithm was elicited, which allowed quick cluster assignment based on responses (“lifemetabotypes”). This machine-learning approach facilitates personalized interventions and precision lifestyle recommendations, supporting online methods for targeted health maintenance and chronic disease prevention.
Introduction
Lifestyle significantly impacts overall health and well-being1. A number of studies evidence links between population habits and chronic diseases such as cardiovascular events, type 2 diabetes, obesity and certain types of cancer2. A balanced diet with fruits, veggies, plant proteins, and healthy fats reduces non-communicable disease rates3. Contrariwise, processed foods, simple sugars, and saturated fats consumption raises harmful risks4. Exercise decreases the risk of heart disease, enhances mental health, and contributes to control weight; in contrast, sedentary behaviors increase chronic diseases prevalence5. Smoking leads to lung cancer, respiratory and heart morbidities6. On the other hand, moderate alcohol consumption is associated with certain health benefits in specific contexts, particularly for cardiovascular physiology7, but ethanol abuse harms liver and metabolic safety8. Furthermore, sleep is vital, since poor quality is linked to obesity, diabetes, heart problems, and mental disorders9. Lastly, stress affects physical and mental health, whose management contributes to overall well-being10. In this context, Health-Related Quality of Life (HRQoL) measures well-being, assessed through appropriate tools like SF-36 and EQ-5D, as surrogate markers of health status11.
Personalized medicine encompasses factors such as lifestyle, genetics, metabolic traits, and milieu environment for optimal life12. Precision nutrition requires advanced and integrative tools to accurately assess individual features and health categorization based on measurable traits13,15.
In this regard, by implementing innovative statistical methods and machine-learning tools, individuals can be stratified based on common shared characteristics to facilitate targeted clinical prediction and interventions in medicine16,17. Thus, clustering individuals has broader implications, aiding focused epidemiological actions for policy-making, and identifying at-risk populations for preventing chronic diseases18. These strategies enhance precision nutrition’s evidence-based approaches19,21. Likewise, in the digital age, online data collection and web-interventions allow innovative health research and care22,24. This study aims to describe clustered populations and to construct a computational algorithm designed to classify lifemetabotypes (clusters) based on cardiometabolic health, HRQoL and lifestyle factors within the NUTRiMDEA online cohort for health maintenance, with the support of simple machine-learning tools to integrate multiple information and data with precision.
Materials and methods
Study design
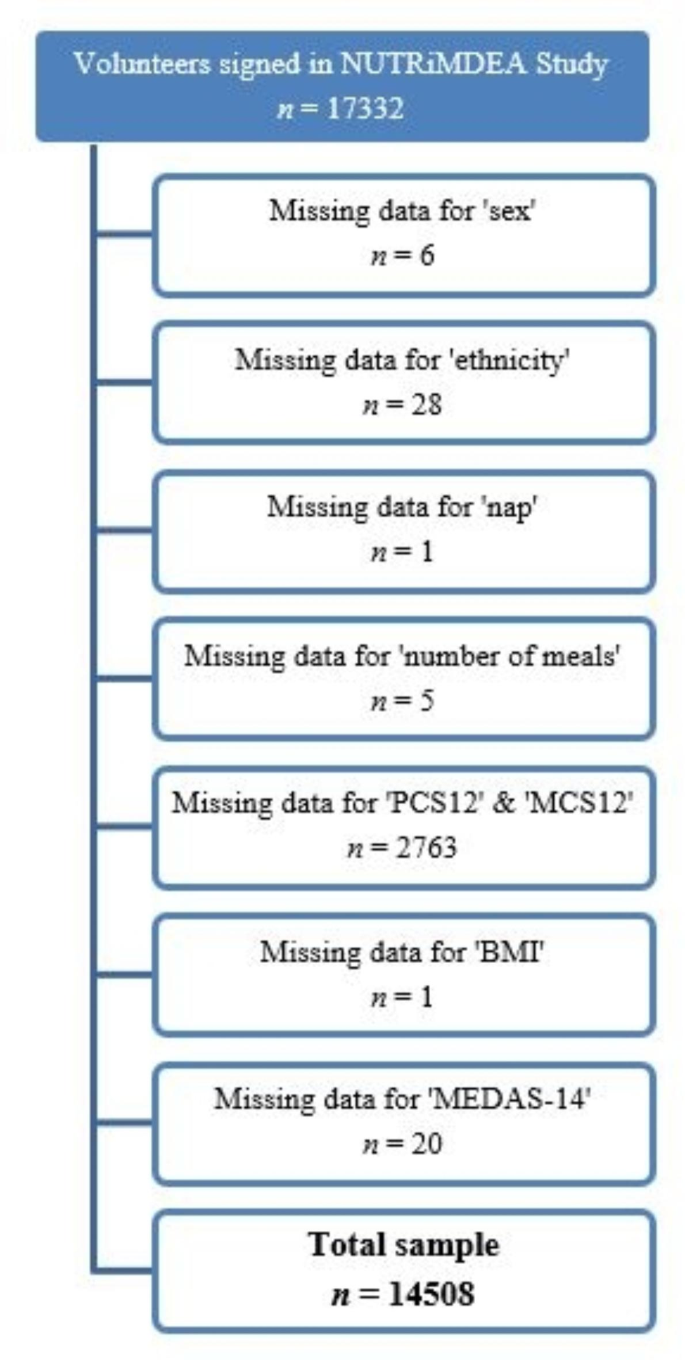
This study is part of the NUTRiMDEA project (Nutrition investigation at IMDEA, Instituto Madrileño de Estudios Avanzados), which aims to analyze online data related to sociodemographic characteristics, HRQoL, nutritional well-being and lifestyle, with focus on precision nutrition and public health. In the period from May to November 2020, a total of 17332 adults participants completed the NUTRiMDEA online survey, which included an informed consent statement, explaining that participants’ anonymous data would be used for scientific purposes upon completion. The study adhered to the Declaration of Helsinki principles and was factually acknowledged by Institutional Review Board of IMDEA CEI (IVC/2020) concerning online research. Only IP addresses were recorded for preventing multiple submissions. The online questionnaire was completed by participants from Argentina, Austria, Belgium, Canada, Chile, Denmark, Ecuador, Spain, United States, France, Ireland, Italy, Mexico, Netherlands, Peru, Portugal, United Kingdom, Colombia, Sweden and Uruguay, with approximately 70% being of Caucasian origin. However, all participants were Spanish-speaking, as the questionnaire was only available in Spanish. The survey collected data on socio-demographics, metabolic background, anthropometrics, and lifestyle using validated questionnaires. The goal was to categorized group or individuals as healthy or ill degrees based on personal metabolic profiles (qualitative and quantitative phenotype categorization) and examine the influence of environmental factors on health and HRQoL. After answering 62 questions, participants received personalized health recommendations. The survey was conducted through two settings: an open survey (OS) on a custom web platform which was freely available at https://nutrimdea2020.questionpro.com/ or rewarded survey (RS) on various online tools. Additional details about the NUTRiMDEA project, as the sample’s characteristics and participant recruitment can be found elsewhere25. After removing missing data, 14508 participants were screened (Fig. 1).

Flowchart diagram of the NUTRiMDEA study.
Survey questionnaires
Physical activity and sedentary behavior data were collected using the validated International Physical Activity Questionnaire (IPAQ) validated for the Spanish population26. This tool assessed weekly durations of light, moderate, and vigorous activities, offering insights into different physical activity levels27. Adherence to the Mediterranean diet was evaluated using the credited 14-item Mediterranean Diet Adherence Screener (MEDAS-14), which captured food consumption patterns such as olive oil, vegetables, fruits, etc. through 14 questions28. Scores ranged from 0 to 14, reflecting adherence to the diet28. Also, the Spanish version of the Short Form-12 Health Survey (SF-12) was performed to measure HRQoL. Derived from the validated SF-36 questionnaire, SF-12 assesses eight health domains like physical functioning and emotional well-being which provides two global scores, the Physical Component Summary (PCS-12) and Mental Component Summary (MCS-12), both ranging from 0 to 100, with higher scores indicating better well-being29.
Statistical analyses
Standard descriptive statistics were employed to calculate mean values and standard deviations (SD) for continuous variables, while frequency with percentages were used for categorical variables. Descriptive values were employed to compare different groups based on sex (female and male) and age (< 40 years and ≥ 40 years) concerning sociodemographic, health-related markers, and lifestyle criteria, which included physical activity, sedentary behavior, sleep patterns, and eating habits. Data normality was assumed due to the sample size and available related information about the analyzed variables.
Parametric continuous variables were compared using the t-Student test, while categorical data were assessed using the chi-square (χ2) test to determine proportions. To analyze interactions between sex and age in relation to continuous variables, a two-way factorial (2 × 2) analysis of variance (ANOVA) was performed. For binary categorical data, logistic regressions were employed, and for polychotomous variables were applied multinomial logistic regressions. Post-hoc analysis to identify specific group comparisons was conducted using the Sidak test. This statistical approach enabled the examination of significant variations among groups and the identification of any interactions between the factors under studied.
To qualitatively and quantitatively categorize the NUTRiMDEA population, an exploratory factor analysis and cluster analysis were conducted, followed by a detailed description of each cluster to identify the idiosyncrasies of each one. A forward stepwise regression was then applied to determine the key variables for developing the computational algorithm, which was created using a multiple linear regression analysis. Lastly, a random forest model was employed to calculate the assignment probabilities for each cluster. A scheme of the process of clustering and computational algorithm obtaining is presented in Supplementary Fig. S1 and the methodology is described in detail below.
Exploratory factor analysis and clustering of lifemetabotypes
To identify the main lifestyle patterns and characteristics of the participants, an exploratory factor analysis was applied to 62 variables. This method uncovers underlying relationships by reducing observed variables into a few key factors, helping to clarify the data structure. In exploratory factor analysis, a latent variable is called a factor and the associations between latent and observed variables are called factor loadings. Factor loadings are standardized regression weights30. To assess the suitability of the data for factor analysis, we conducted the Kaiser-Meyer-Olkin (KMO) test. The KMO ranges from 0 to 1, with zero indicates a disperse correlation matrix and values near one indicating a tight or dense pattern of correlations30. The Scree plot test was conducted to determine the number of factors to retain with values > 1 and the interpretability of the factors. An orthogonal rotation procedure (promax rotation) was applied to the factors to derive uncorrelated factors for easier interpretation. The rotated component matrix provides the factor loadings for each variable31. A visual inspection of the correlation matrix was performed, and we considered an absolute factor loading ≥ 0.30 as significant for each factor. For each participant, factor scores were calculated from the factor obtained in the final analysis. These scores were used to conduct a hierarchical cluster analysis, aiming to identify distinct patterns within the population (lifemetabotypes) according to the statistical weight that each latent variable exerted for each subject. Cluster analysis is a widely used pattern recognition technique, which is able to reveal hidden patterns within datasets32. Clustering analysis was performed using Ward’s hierarchical clustering method to create compact, well-separated clusters32. The clustering process aimed to create homogeneous clusters with minimal within-cluster variance, aided by Ward’s method’s sensitivity to outliers33. The hierarchical structure of Ward’s linkage offered a clear view of the clustering process, visually represented by dendrograms. To determine the optimal number of clusters, the cut-off point was identified and visualized using the Calinski and Harabasz pseudo-F index, which evaluates the clustering quality based on the ratio of between-cluster dispersion to within-cluster dispersion34. This index helped to visualize the optimal number of clusters through dendrograms, which guided the selection of the best clustering solution. The process resulted in the identification of distinct clusters, which provides a useful framework for further analysis of the data set.
Computational algorithm and probability calculation
A forward stepwise regression was performed to determine the variables which should be included in the algorithm development process. This analysis initially starts with zero independent variables and adds one independent variable in each iteration. This model goals to investigate the impact of several independent variables on a single dependent variable35. For each variable, we conducted an F-test of ANOVA, and if the p-value was less than 0.05, the variable was retained in the model; otherwise, it was removed.
After stepwise regression was performed, the specific beta-coefficients (β) were then calculated using linear regression, using the cluster variable as the predicted variable. These beta coefficients provided insights into the strength and direction of the relationships between the independent variables and the cluster variable35. To assess the impact of each variable, R-squared (R2) values were computed to determine the proportion of variance in the cluster variable that can be attributed to the independent variables included in the regression model. This parameter helped to evaluate the contribution of each variable in predicting the cluster outcomes. A computational algorithm formula was obtained using the multiple linear regression approach. In this equation, each variable was multiplied by every specific beta-coefficient, which was determined based on the assigned weight from the regression model for each category. This design allowed for the estimation of the classification for each lifemetabotype, enhancing the accuracy of the classification process.
Finally, to further enhance the classification performance, a random forest model was employed. This model was used to screen the probabilities of participants belonging to different groups or clusters36. This method is a commonly used machine learning algorithm which aggregates the outputs of multiple decision trees to generate a single result. Its ease of use and flexibility have made it popular for both classification and regression tasks. The model used 1000 iterations to estimate the probabilities of participants being classified into different lifemetabotypes groups to improve the reliability of the classification results. By combining these techniques, the study aimed to develop a robust algorithm for accurately classifying participants into various lifemetabotypes based on the provided variables.
All the performed statistical tests were two-tailed; P-values < 0.05 were considered statistically significant. Statistical Analyses were performed using STATA version 18.0, StataCorp, (College Station, TX, USA) and RStudio version 4.3.0.
Results
Descriptive characteristics of NUTRiMDEA population
Participants’ phenotypic characteristics in the NUTRiMDEA study were categorized by sex (female and male) and age (< 40 years and ≥ 40 years), whose data are shown in Tables 1, 2 and 3. Regarding the analysis of factorial interactions between sex and age, significant differences were found in education, home situation, number of meals per day and snacking habits, nap habit, weight, BMI, and PCS12. A higher proportion of women and younger participants declared university education, while the younger population reported a higher rate of students and a lower rate of employment. Younger men were more likely to live alone, whereas older individuals reported living as couples and with children. Regarding cardiometabolic diseases, older man informed a higher prevalence. About family history, females reported a higher prevalence of familial high blood pressure (HBP) and dyslipidemia. Younger females stated more depression, while older men informed a lower incidence. Considering lifestyle, younger men reported a higher rate of the smoking habit, whereas younger women tended to have a lower prevalence, but a higher meal frequency and more snacking habits. Younger individuals, regardless of sex, informed replacing food with snacks more often and consumed more water than older participants. Subjects under 40 years also reported napping longer (> 60 min) and slept more hours at night compared to those over 40 years individuals. The data revealed significant differences in physical activity on age and sex. Older individuals stated spending less time sitting, but older women spent more time sitting than older men. Regardless of age, men self-reported engaging in more moderate physical activity than women. Older men informed participating more in light physical activity, while younger men engaged in more intense physical activity. Older women performed less intense physical activity. Men obtained a higher level of total METs-min/week than women, irrespective of age. Older men had a higher BMI, while younger women had a lower BMI. Additionally, woman and older individuals showed a higher score on the MDS14. Regarding HRQoL, younger people had a higher PCS12 score, regardless of sex, while men and older individuals had a better MCS12 score, and young women scored lower on MCS12.
Exploratory factor analysis and selection of variables
After the exploratory factor analysis of 62 variables and the scree plot test, 19 factors with an eigenvalue greater than 1 explaining 57.5% of the total variance were obtained. The resulting KMO measure was 0.7578, which is above the rule-of-thumb cut-off for KMO, whose values should generally be above 0.60 for sampling adequacy. Subsequently, the orthogonal rotation procedure (promax rotation), a visual inspection of the correlation matrix was performed, and we considered an absolute factor loading ≥ 0.30 as significant for each factor (Supplementary Fig. S2). The variables related to HRQoL were most relevant in factor (1) Age, sex, cardiometabolic health, some aspects of HRQoL, and smoking habits determined factor (2) Factor 3 comprised questions related to the Mediterranean diet, while smoking habits, and some aspects of HRQoL were included in factor 4. Family medical history and physical activity for factors 5 and 6 were dominant. Living situation was relevant for factor 5 and 7, while prevalence of obesity and smoking were important for factor 8. Factor 9 consisted of sleeping and smoking habits. Factor 10 contained aspects of food. Factor 11 was related to living in couple, sleeping, and snacking habits. For factor 12 live alone, with others and the occupation were most involved variables. Ethnicity and use of olive oil as the main fat in meals were important for factor 13. Sex, diabetes prevalence, consumption of legumes, and physical exercise were contained in factor 14. Factor 15 comprised questions related to the nap habit and feeling calm and quiet in the HRQoL questionnaire. Dyslipidemia and added salt in dishes were significant contributors for factor 16. Living with the elderly and prevalence of diabetes were relevant for factor 17. While living with the elderly and consuming more white meat than red and processed were important for factor 18. Lastly, factor 19 was associated with education, wine consumption, servings of fish and shellfish per week, and consuming more white meat than red and processed meat. After the hierarchical cluster analysis, resulted 5 lifemetabotypes, which are presented descriptively in dendrograms (Fig. 2).

Dendrogram. Phenotypic description of cluster analysis. As can be seen on the abscissa axis, the dendrogram graphically represents the number of groups. Within each group, the corresponding population number is shown (n). The colors show the 5 optimal clusters used to characterize into phenotypes.
Clustering information
The clustering technique yielded 5 clusters. After analyzing variables for each cluster, phenotypic characteristics were identified (Table 4 and Supplementary Tables S1 and S2). Cluster 1, labeled ‘Westernized Millennial’, encompassed 967 mainly 18-40-year-old participants, predominantly female, Caucasian, with university education, and either employed or students. Most reported living with others. This cluster stated no significant prevalence of cardiometabolic diseases or family history, but nearly half informed frequent sadness or depression. Respondents of this cluster declared the highest red/processed meat consumption, medium-low Mediterranean diet adherence, and medium physical activity levels. This cluster also had the highest non-smoker percentage, with smokers reporting the fewest cigarettes smoked daily. The PCS12 score was medium, while the MCS12 score was medium-low.
Cluster 2 ‘Healthy’ included 10,616 volunteers. This group informed being mainly middle-aged (40–55 years), with a slightly higher proportion of women compared to men, and predominance of Caucasians over Hispanics. Most participants declared having university education, living in couple and with children, being employed, maintaining normal weight, having no cardiometabolic diseases, but a family history of HBP and dyslipidemia, no snacking habit between meals, non-smokers, and no depression symptoms. This population obtained a high adherence to the Mediterranean diet and a high level of moderate physical activity and achieved a medium score in HRQoL.
Cluster 3, named “Mediterranean Youth-Adult”, comprised 2013 participants. This group primarily consisted of young and middle-aged individuals (25–55 years), with a higher proportion of women and Caucasians. Participants were university-educated, employed, and lived alone. This cluster informed the lowest prevalence of obesity, diabetes, and familial history compared to other clusters. They self-reported minimal depression symptoms and the highest adherence to the Mediterranean diet. Their physical activity level was moderate, but sedentary hours were high. Most were non-smokers, with a medium HRQoL score.
Cluster 4, ‘Pre-morbid’ (n = 600), included diverse age groups, more women, comprising both Caucasians and Hispanics, and often educated at university. Participants informed living with elders, and being employed, students, or unemployed. Many were overweight, declared family HBP and dyslipidemia history. About half experienced depression and most were non-smokers. They self-reported frequent snacking and adding salt. Adherence to the Mediterranean diet was low, but they engaged in slightly more physical activity. The PCS12 was medium, while the MCS12 was relatively lower.
Cluster 5 ‘Pro-morbid’ (n = 312) involved middle-aged to elderly individuals, more women, and Caucasians. Mostly declared having university or professional education and living with a partner and children. The cluster included varying proportions of employed, retired, unemployed and disabled individuals. The participants had a balanced distribution between normal weight and overweight, with a noticeable prevalence of obesity. This cluster informed the highest prevalence of cardiometabolic diseases and family history as well as more depressive symptoms. They self-reported sleeping less than 7–8 h per night and had the lowest water intake. Sedentary hours ranged from 5 to 7 h/day to 8–10 h/day. Adherence to the Mediterranean diet, physical activity, and PCS12 were low, while the MCS12 was medium.
Computational algorithm development
After the forward stepwise regression was performed, the final model identified the following variables: age (18–25 years / 25–40 years / 40–55 years / 55–70 years / >70 years), sex (Female /Male / Do not specify), t-shirt size (XS / S / M / L / XL / XXL), occupation (Unemployed / Student / Disability / Retired / Houseworker / Employed), ethnicity (Caucasian / European / Hispanic / Latin / African / Asian / Mestizo / Other / Prefer not to specify), live alone, with older, with other (Yes / No), sleep weekdays (10 h per day), prevalence of obesity and diabetes (Yes / No), familial obesity, diabetes and HBP (Yes / No / DKDA), water (1–2 glasses per day / 3–4 glasses per day / 5–6 glasses per day / 7–8 glasses per day / 9–10 glasses per day / >10 glasses per day), number of meals (1 or 2 meals per day / 3 meals per day / 4 meals per day / 5 meals per day / ≥6 meals per day), red and processed meats, and butter/cream/margarine (Never or rarely / 1 serving per day / ≥2 servings per day), sugar sweetened beverages (Never or rarely / 1 or 2 servings per day / ≥3 servings per day), fish and seafood (Never or rarely / 1 or 2 servings per week / ≥3 servings per week), preference for white over red meat (Yes / No), moderate physical activity (hours / week), self-perception of health (Excellent / Very good / Good / Fair / Poor), limited in moderate activities and climbing stairs (Yes, limited a lot / Yes, limited a little / No, not limited at all), accomplished less due to physical health or emotional problems (Yes / No), limited in work or other activities (Yes / No), didn’t work as carefully due to emotional problems (Yes / No), pain (Not at all / A little bit / Moderately / Quite a bit / Extremely), downhearted and blue, and calm and peaceful (All of the time / Most of the time / A good bit of the time / Some of the time / A little of the time / None of the time).
The beta coefficients (β) of the variables selected for the development of the computational algorithm and the variance contribution of model (R2) of each variable is presented in Supplementary Table S3. The variables that contributed the most to the model were: live with older (27.8%), live alone (12.9%), live with other (6.6%) and limited in moderate activities (1.3%).
A computational algorithm was obtained through the formula that allowed estimating the classification of each lifemetabotype (Fig. 3). When the probability of the participants being classified into different groups or clusters was calculated by the random forest algorithm, the following results were obtained: cluster 1 had an 81.9% of being classified in said group, cluster 2 a 94.6%, cluster 3 an 82.5%, cluster 4 a 79.7% and cluster 5 a 77.5% (Supplementary Table S4).

Computational algorithm for the classification of phenotypes. Intercept = 3.5092.
Discussion
Integrating phenotypical data and grouping individuals based on metabolic, clinical, and lifestyle traits, has been effective for precision medicine and tailored dietary interventions16,19,37,38. In this online cross-sectional study, we clustered 14,508 adults using statistical methods and a computational algorithm for objective group assignment. Anthropometric, metabolic, and HRQoL features were quantitatively compared among different age and sex groups. Noteworthy, the descriptive interaction analyses revealed important effect modification associated to sex and age concerning sociodemographic, dietary, physical activity and HRQoL variables, with value in preventing chronic diseases39. The cohabitation variable was key in identifying lifemetabotypes, reflecting socioeconomic factors’ importance40. Previous research using machine-learning has highlighted that lifestyle, socioeconomic and demographic factors (diet, physical activity, smoking, sleep, education, work, income, environment, ethnicity.) influence the prevalence of chronic diseases, so understanding these factors is essential to characterize population and to assess and prevent disease risk40,41.
Our investigation identified a smaller-sized ‘high-risk’ cluster with unfavorable profiles, enabling targeted interventions and making clustering particularly effective in identifying extreme observations. Indeed, phenotyping has potential for tailored prevention/intervention strategies42. A comparable project in Spain (PLENUFAR7) support categorization value in assessing health risks clusters14. In this study, a computational algorithm was developed to classify an individual in the lifemetabotypes obtained, based on key variables that demonstrated significant influence within the model. Different medical societies have created guidelines based on clinical criteria and algorithms to be able to better treat and manage chronic disease such as European Association for the Study of the Liver (EASL), American Heart Association (AHA) and American Diabetes Association (ADA). Machine-learning algorithms are crucial in enhancing disease diagnoses, prognosis, and prevention31,41.
Advances in phenotype data collection have increased, with internet and mobile technologies now being explored for faster and broader phenotyping in large populations41. Our study collected data online, through internet-linked systems which allows for valuable insights into population health and lifestyle through easily self-reported data and a wide geographic reach43,44 However, this approach also has drawbacks, such as technological bias from excluding individuals without internet access or limited computer skills45. Additionally, there is no control over who completes the questionnaire or the influence of others on responses46. Self-reported methods may also lead to inaccuracies47, such as participants underestimating their weight and overestimating their height48,49, often resulting in selection, measurement and response biases.
In this context, strengths and weaknesses of online surveys compared to face-to-face consultations for health screening have been previously studied50. It is worth noting that the validity of self-reported data collection has been supported by studies such as the SUN cohort51, Food4Me52,53, Nurses’ Health Study54, Health Professionals Follow-up Study55, and PROM study56, which support the validity of the findings obtained through online recruited populations and the reliability of the data in terms of representativeness, legitimacy, and timeliness, covering health, sociodemographic, anthropometric, dietary and lifestyle data. The PREDIMED study also supports the online methodology, showing that remote nutritional intervention appears to be effective in increasing adherence to the Mediterranean diet pattern57. Furthermore, the large sample size and use of multiple online platforms improve sample diversity, enhancing heterogeneity and representation47. Another advantage of surveys is that they are conducted in natural settings and typically involve simpler random probability sampling compared to experimental studies. This approach allows statistical inferences about the broader population, enhancing the study’s external validity46. Furthermore, this approach avoids interviewer bias and is beneficial for sensitive topics due to the increased anonymity. However, it is suitable only when questions are clear, simple, and the population is literate and speaks a common language46. Another significant strength was the possibility of collecting a wide range of information using validated tools. While web-based methods offer quick and broad data access easily applicable in healthcare settings, further research is needed to determine whether these strategies can improve prognostic accuracy beyond traditional models for preventing chronic disease and public health actions.
On the other hand, our analysis is limited to available dataset variables; clustering outcomes depend on selected variables’ quality and data completeness16. Machine-learning models lack easily interpretable variable coefficients, hindering causal relationship establishment. Furthermore, additional validation in diverse populations and with different risk stratification methods is convenient for cluster analysis wider applications16.
Personalized medicine at individual level requires costly and complex data collection and accurate models for tailored advice. Alternatively, group-level personalization is a more practical option19. Our online study’s clustering algorithm may offer a solution to these challenges in clinical settings by quantitatively integrating information. To our knowledge, this is the pioneering study of its kind, with specific focus on preventing chronic disease. This approach aids in understanding health variability and offers potential for targeted interventions. The innovative algorithm and accurately classified individual phenotypes, will contribute to precision well-being knowledge and personalized interventions for chronic disease prevention and public health policies implementation in extensive online populations using web-based tools.
Data availability
The datasets used and/or analyzed during the current study are available from the corresponding author under a formal and substantiated request.
References
-
Hautekiet, P. et al. A healthy lifestyle is positively associated with mental health and well-being and core markers in ageing. BMC Med. 20(1), 328. https://doi.org/10.1186/s12916-022-02524-9 (2022).
Google Scholar
-
Budreviciute, A. et al. Management and prevention strategies for non-communicable diseases (NCDs) and their risk factors. Front. Public Health 8, 574111. https://doi.org/10.3389/fpubh.2020.574111 (2020).
Google Scholar
-
Gantenbein, K. V. & Kanaka-Gantenbein, C. Mediterranean Diet as an Antioxidant: The Impact on Metabolic Health and Overall Wellbeing. Nutrients 13(6), 1951. https://doi.org/10.3390/nu13061951 (2021)
-
Elizabeth, L., Machado, P., Zinöcker, M., Baker, P. & Lawrence, M. Ultra-processed foods and health outcomes: A narrative review. Nutrients 12(7), 2020. https://doi.org/10.3390/nu12071955 (1955).
Google Scholar
-
Ekelund, U. et al. Dose-response associations between accelerometry measured physical activity and sedentary time and all cause mortality: Systematic review and harmonised meta-analysis. BMJ 366, l4570. https://doi.org/10.1136/bmj.l4570 (2019).
Google Scholar
-
Loretan, C. G., Cornelius, M. E., Jamal, A., Cheng, Y. J. & Homa, D. M. Cigarette smoking among us adults with selected chronic diseases associated with smoking, 2010–2019. Prev. Chronic Dis. 19, E62. https://doi.org/10.5888/pcd19.220086 (2022).
Google Scholar
-
Barbería-Latasa, M., Gea, A. & Martínez-González, M. A. Alcohol, drinking pattern, and chronic disease. Nutrients 14(9), 2022. https://doi.org/10.3390/nu14091954 (1954).
Google Scholar
-
Shield, K. et al. National, regional, and global burdens of disease from 2000 to 2016 attributable to alcohol use: A comparative risk assessment study. Lancet Public Health 5, e51–e61. https://doi.org/10.1016/S2468-2667(19)30231-2 (2020).
Google Scholar
-
Gao, C. et al. Sleep duration/quality with health outcomes: An umbrella review of meta-analyses of prospective studies. Front. Med. (Lausanne) 8, 813943. https://doi.org/10.3389/fmed.2021.813943 (2021).
Google Scholar
-
Baumer, Y. et al. By what molecular mechanisms do social determinants impact cardiometabolic risk?. Clin. Sci. (Lond) 137(6), 469–494. https://doi.org/10.1042/CS20220304 (2023).
Google Scholar
-
Kaplan, R. M. & Hays, R. D. Health-related quality of life measurement in public health. Annu. Rev. Public Health 43, 355–373. https://doi.org/10.1146/annurev-publhealth-052120-012811 (2022).
Google Scholar
-
Cesario, A. et al. Personalized clinical phenotyping through systems medicine and artificial intelligence. J. Pers. Med. 11(4), 265. https://doi.org/10.3390/jpm11040265 (2021).
Google Scholar
-
Ribot-Rodriguez, R. et al. Cardiometabolic health status, ethnicity and health-related quality of life (HRQoL) disparities in an adult population: NutrIMDEA observational web-based study. Int. J. Environ. Res. Public Health 19(5), 2948. https://doi.org/10.3390/ijerph19052948 (2022).
Google Scholar
-
García-Perea, A. et al. Nutritional and lifestyle features in a mediterranean cohort: An epidemiological instrument for categorizing metabotypes based on a computational algorithm. Medicina (Kaunas) 60(4), 610. https://doi.org/10.3390/medicina60040610 (2024).
Google Scholar
-
Kirk, D., Catal, C. & Tekinerdogan, B. Precision nutrition: A systematic literature review. Comput. Biol. Med. 133, 104365. https://doi.org/10.1016/j.compbiomed.2021.104365 (2021).
Google Scholar
-
Sharma, A. et al. Cluster analysis of cardiovascular phenotypes in patients with type 2 diabetes and established atherosclerotic cardiovascular disease: A potential approach to precision medicine. Diabetes Care 45(1), 204–212. https://doi.org/10.2337/dc20-2806 (2022).
Google Scholar
-
Braude, I. et al. Machine learning for predicting elective fertility preservation outcomes. Sci. Rep. 14(1), 10158. https://doi.org/10.1038/s41598-024-60671-w (2024).
Google Scholar
-
Liu, S. H., Li, Y. & Liu, B. Exploratory cluster analysis to identify patterns of chronic kidney disease in the 500 cities project. Prev. Chronic Dis. 15, E60. https://doi.org/10.5888/pcd15.170372 (2018).
Google Scholar
-
Palmnäs, M. et al. Perspective: Metabotyping-a potential personalized nutrition strategy for precision prevention of cardiometabolic disease. Adv. Nutr. 11(3), 524–532. https://doi.org/10.1093/advances/nmz121 (2020).
Google Scholar
-
Pigsborg, K. & Magkos, F. Metabotyping for precision nutrition and weight management: hype or hope?. Curr. Nutr. Rep. 11(2), 117–123. https://doi.org/10.1007/s13668-021-00392-y (2022).
Google Scholar
-
Hillesheim, E. & Brennan, L. Metabotyping: A tool for identifying subgroups for tailored nutrition advice. Proc. Nutr. Soc. 82(2), 130–141. https://doi.org/10.1017/S0029665123000058 (2023).
Google Scholar
-
Ng, B. P. & Park, C. Accessibility of telehealth services during the COVID-19 pandemic: A cross-sectional survey of medicare beneficiaries. Prev. Chronic Dis. 18, E65. https://doi.org/10.5888/pcd18.210056 (2021).
Google Scholar
-
Mahmoodi, M., Farajkhoda, T., Nadjarzadeh, A. & Zareei Mahmoodabadi, H. Online positive-oriented counseling, taking vitamin D3 tablet, online lifestyle modification training on premenstrual syndrome: A 3-armed randomized clinical trial. Sci. Rep. 13(1), 16631. https://doi.org/10.1038/s41598-023-43940-y (2023).
Google Scholar
-
Bossi, F. et al. Mindfulness-based online intervention increases well-being and decreases stress after Covid-19 lockdown. Sci. Rep. 12, 6483. https://doi.org/10.1038/s41598-022-10361-2 (2022).
Google Scholar
-
Higuera-Gomez, A. et al. HRQoL and nutritional well-being dissimilarities between two different online collection methods: Value for digital health implementation. Digit. Health 8, 20552076221138316. https://doi.org/10.1177/20552076221138316 (2022).
Google Scholar
-
Rodríguez-Muñoz, S., Corella, C., Abarca-Sos, A. & Zaragoza, J. Validation of three short physical activity questionnaires with accelerometers among university students in Spain. J. Sports Med. Phys. Fitness 57(12), 1660–1668. https://doi.org/10.23736/S0022-4707.17.06665-8 (2017).
Google Scholar
-
Lee, P. H., Macfarlane, D. J., Lam, T. H. & Stewart, S. M. Validity of the International Physical Activity Questionnaire Short Form (IPAQ-SF): A systematic review. Int. J. Behav. Nutr. Phys. Act. 8, 115. https://doi.org/10.1186/1479-5868-8-115 (2011).
Google Scholar
-
García-Conesa, M. T. et al. Exploring the validity of the 14-item Mediterranean Diet Adherence Screener (MEDAS): A cross-national study in seven European countries around the mediterranean region. Nutrients 12(10), 2960. https://doi.org/10.3390/nu12102960 (2020).
Google Scholar
-
Schmidt, S. et al. Reference guidelines for the 12-Item Short-Form Health Survey version 2 based on the Catalan general population. Med. Clin. (Barc.) 139(14), 613–625. https://doi.org/10.1016/j.medcli.2011.10.024 (2012).
Google Scholar
-
Schreiber, J. B. Issues and recommendations for exploratory factor analysis and principal component analysis. Res. Social Adm. Pharm. 17(5), 1004–1011. https://doi.org/10.1016/j.sapharm.2020.07.027 (2021).
Google Scholar
-
DeGregory, K. W. et al. A review of machine learning in obesity. Obes. Rev. 19(5), 668–685. https://doi.org/10.1111/obr.12667 (2018).
Google Scholar
-
Gere, A. Recommendations for validating hierarchical clustering in consumer sensory projects. Curr. Res. Food Sci. 6, 100522. https://doi.org/10.1016/j.crfs.2023.100522 (2023).
Google Scholar
-
Apfel, N. & Liang, X. Agglomerative hierarchical clustering for selecting validinstrumental variables. J. Appl. Econ. https://doi.org/10.1002/jae.3078 (2024).
Google Scholar
-
Nowak-Brzezińska, A. Enhancing the efficiency of a decision support system through the clustering of complex rule-based knowledge bases and modification of the inference algorithm. Complexity 1, 2065491. https://doi.org/10.1155/2018/2065491 (2018).
Google Scholar
-
Kolasa-Wiecek, A. Stepwise multiple regression method of greenhouse gas emission modeling in the energy sector in Poland. J. Environ. Sci. (China) 30, 47–54. https://doi.org/10.1016/j.jes.2014.09.037 (2015).
Google Scholar
-
Chen, H. et al. Identification of energy metabolism-related biomarkers for risk prediction of heart failure patients using random forest algorithm. Front. Cardiovasc. Med. 9, 993142. https://doi.org/10.3389/fcvm.2022.993142 (2022).
Google Scholar
-
O’Donovan, C. B. et al. Metabotyping for the development of tailored dietary advice solutions in a European population: The Food4Me study. Br. J. Nutr. 118(8), 561–569. https://doi.org/10.1017/s0007114517002069 (2017).
Google Scholar
-
Hillesheim, E. & Brennan, L. Metabotyping and its role in nutrition research. Nutr. Res. Rev. 33(1), 33–42. https://doi.org/10.1017/s0954422419000179 (2020).
Google Scholar
-
Lonnie, M. & Wadolowska, L. Empirically derived dietary-lifestyle patterns and cardiometabolic health in young men: A review. Proc. Nutr. Soc. 79(3), 324–330. https://doi.org/10.1017/s002966512000693x (2020).
Google Scholar
-
Scheinker, D., Valencia, A. & Rodriguez, F. Identification of factors associated with variation in US county-level obesity prevalence rates using epidemiologic vs machine learning models. JAMA Netw. Open 2(4), e192884. https://doi.org/10.1001/jamanetworkopen.2019.2884 (2019).
Google Scholar
-
Zitnik, M. et al. Machine learning for integrating data in biology and medicine: principles, practice, and opportunities. Inf. Fusion 50, 71–91. https://doi.org/10.1016/j.inffus.2018.09.012 (2019).
Google Scholar
-
de Toro-Martín, J., Arsenault, B. J., Després, J. P. & Vohl, M. C. Precision nutrition: A review of personalized nutritional approaches for the prevention and management of metabolic syndrome. Nutrients 9(8), 913. https://doi.org/10.3390/nu9080913 (2017).
Google Scholar
-
Ribot-Rodríguez, R., Higuera-Gómez, A., San-Cristobal, R., Micó, V. & Martínez, J. A. Comparison of seven healthy lifestyle scores cardiometabolic health: Age, sex, and lifestyle interactions in the NutrIMDEA web-based study. J. Epidemiol. Glob. Health 13(4), 653–663. https://doi.org/10.1007/s44197-023-00140-1 (2023).
Google Scholar
-
Higuera-Gómez, A. et al. Lifestyle and health-related quality of life relationships concerning metabolic disease phenotypes on the nutrimdea online cohort. Int. J. Environ. Res. Public Health 20(1), 767. https://doi.org/10.3390/ijerph20010767 (2022).
Google Scholar
-
Heponiemi, T. et al. The role of age and digital competence on the use of online health and social care services: A cross-sectional population-based survey. Digit. Health 8, 20552076221074484. https://doi.org/10.1177/20552076221074485 (2022).
Google Scholar
-
Bowling, A. Research Methods in Health: Investigating Health and Health Services. (ed. 5th, 2021).
-
Ibarra, J. L., Agas, J. M., Lee, M., Pan, J. L. & Buttenheim, A. M. Comparison of online survey recruitment platforms for hard-to-reach pregnant smoking populations: Feasibility study. JMIR Res. Protoc. 7(4), e101. https://doi.org/10.2196/resprot.8071 (2018).
Google Scholar
-
Lecube, A. et al. Factors accounting for obesity and its perception among the adult Spanish population: Data from 1,000 computer-assisted telephone interviews. Obes. Facts 13(4), 322–332. https://doi.org/10.1159/000508111 (2020).
Google Scholar
-
Savane, F. R. et al. Validation of self-reported weight and height university population and factors associated with differences between self reported and measured antropometrics. Nutr. Hosp. 28(5), 1633–1638. https://doi.org/10.3305/nh.2013.28.5.6671 (2013).
Google Scholar
-
Steel, J. S., Godderis, L. & Luyten, J. Disclosure in online vs. face-to-face occupational health screenings: A cross-sectional study in Belgian hospital employees. Int. J. Environ. Res. Public Health 18(4), 1460. https://doi.org/10.3390/ijerph18041460 (2021).
Google Scholar
-
Martínez-González, M. A., Sanchez-Villegas, A., De Irala, J., Marti, A. & Martínez, J. A. Mediterranean diet and stroke: Objectives and design of the SUN project. Seguimiento Universidad de Navarra. Nutr. Neurosci. 5(1), 65–73. https://doi.org/10.1080/10284150290007047 (2002).
Google Scholar
-
Celis-Morales, C., Foster, H., O’Donovan, C., Woolhead, C. & Marsaux, C. Validation of Web-based self-reported socio-demographic and anthropometric data collected in the Food4Me study. Proc. Nutr. Soc. 73, E78. https://doi.org/10.1017/S0029665114001074 (2014).
Google Scholar
-
Celis-Morales, C. et al. How reliable is internet-based self-reported identity, socio-demographic and obesity measures in European adults?. Genes Nutr. 10(5), 28. https://doi.org/10.1007/s12263-015-0476-0 (2015).
Google Scholar
-
Bao, Y. et al. Origin, methods, and evolution of the three nurses’ health studies. Am. J. Public Health 106(9), 1573–1581. https://doi.org/10.2105/ajph.2016.303338 (2016).
Google Scholar
-
Khandpur, N. et al. Categorising ultra-processed foods in large-scale cohort studies: evidence from the Nurses’ Health Studies, the Health Professionals Follow-up Study, and the Growing Up Today Study. J. Nutr. Sci. 10, e77. https://doi.org/10.1017/jns.2021.72 (2021).
Google Scholar
-
Rowen, D., Carlton, J. & Elliott, J. PROM validation using paper-based or online surveys: Data collection methods affect the sociodemographic and health profile of the sample. Value Health 22(8), 845–850. https://doi.org/10.1016/j.jval.2019.03.015 (2019).
Google Scholar
-
Goni, L. et al. A remote nutritional intervention to change the dietary habits of patients undergoing ablation of atrial fibrillation: Randomized controlled trial. J. Med. Internet Res. 22(12), e21436. https://doi.org/10.2196/21436 (2020).
Google Scholar
Acknowledgements
We acknowledge participants as well as NUTRiMDEA Research Group members for their invaluable support, in addition to CIBERobn for credited aid.
Author information
Authors and Affiliations
Contributions
J.A.M. and R.S-C. were responsible for the conceptualization. A.H-G., V.O., R.S-C. and J.A.M. were responsible of methodology. Investigation was developed by A.H-G., R.R-R., R.S-C., I.E-S., A.D., M.P.P. and J.A.M. A.H-G. and V.O. were responsible for data analysis. A.H-G. was responsible for writing and original draft preparing. J.A.M. was responsible for critically revising the manuscript. A.D., M.P.P. and J.A.M. were responsible of coordination and financial support. All authors contributed and reviewed to the article and approved the submitted version.
Corresponding author
Ethics declarations
Competing interests
The authors declare no competing interests.
Additional information
Publisher’s note
Springer Nature remains neutral with regard to jurisdictional claims in published maps and institutional affiliations.
Electronic supplementary material
Below is the link to the electronic supplementary material.
Supplementary Material 1
Rights and permissions
Open Access This article is licensed under a Creative Commons Attribution-NonCommercial-NoDerivatives 4.0 International License, which permits any non-commercial use, sharing, distribution and reproduction in any medium or format, as long as you give appropriate credit to the original author(s) and the source, provide a link to the Creative Commons licence, and indicate if you modified the licensed material. You do not have permission under this licence to share adapted material derived from this article or parts of it. The images or other third party material in this article are included in the article’s Creative Commons licence, unless indicated otherwise in a credit line to the material. If material is not included in the article’s Creative Commons licence and your intended use is not permitted by statutory regulation or exceeds the permitted use, you will need to obtain permission directly from the copyright holder. To view a copy of this licence, visit http://creativecommons.org/licenses/by-nc-nd/4.0/.
Reprints and permissions
About this article
Cite this article
Higuera-Gómez, A., de la O, V., San-Cristobal, R. et al. Computational algorithm based on health and lifestyle traits to categorize lifemetabotypes in the NUTRiMDEA cohort.
Sci Rep 14, 24835 (2024). https://doi.org/10.1038/s41598-024-75110-z
-
Received: 21 May 2024
-
Accepted: 01 October 2024
-
Published: 22 October 2024
-
DOI: https://doi.org/10.1038/s41598-024-75110-z
Keywords
- Exploratory factor analyses
- Clustering
- Machine-learning
- Lifestyle
- Public health
- Precision medicine