
Abstract
Biodiversity is increasingly threatened by local extinction under global climate change. This may reflect direct effects of climate on poorly adapted native species or increased impacts of exotic species in these conditions, but their relative importance is poorly understood. By examining global occurrence records of 142 plant species found in the Yangtze River Valley, we found that the climatic niches of exotic species differed from those of natives, mainly reflecting exotics being most common in warmer, drier and more isothermal climates in their native ranges. These differences in climatic niches, especially temperature, predicted invasion intensity in 459 plots along a 1,800-km transect in the Yangtze River Valley. On the basis of this strong match between model predictions and field survey results, we predict that invasions will probably be more intense in future climatic conditions, especially from warming at the coldest sites. The direct negative effect of warming on native diversity was larger than the indirect effects mediated through increased invasions. However, moderate invasion increased communities’ overall species diversity. More broadly, our study highlights the role of exotic species in the ecological response of regional biodiversity to global climate change.
Main
Understanding the ecological responses of biodiversity to climate change is a major focus of ecology1,2. Global climate has and will continue to undergo dramatic changes, which may lead to the decline of resident communities, in part by increasing the risk of local extinctions3,4,5. Exotic species invasions often coincide with these declines, so in many cases invaders may cause native diversity loss. However, whether native diversity loss is driven by exotic species or simply responding independently to climate change has long been debated6,7,8,9,10. Determining whether loss of native diversity and exotic invasion are two covarying aspects driven by climate change is a key step in reconciling these debates. Several global meta-analyses have clearly shown that exotic species benefit more from global climate change than native species11,12,13. In other words, climate change has the potential to increase the fitness differences between exotic and native species by giving exotics fitness advantages as conditions become more suitable for them and/or by negatively impacting the persistence of natives as conditions become less suitable for them14,15. Although much research has been devoted to comparing the differential responses of exotic and native species to climate change, the underlying causes are poorly understood. Notably, it remains unclear whether climatic niche differences between exotic and native species contribute to exotic species benefitting more from climate change.
The climatic niche defines the climatic conditions that a species can occupy, and it is predicted that populations that occur in conditions at the climatic niche centroid will have the highest fitness, with fitness gradually decreasing towards the margins where conditions are barely suitable16,17. However, in some practical cases, the observed higher abundance does not occur at the centre of their climatic conditions due to imbalanced spatial sampling or insufficient sampling range18. Nonetheless, the climatic niche is a species-level property useful in determining where species can occur and in testing for species-level selection by climate change19,20. In a changing climate, species will shift their geographic ranges to keep within their climatic niche21. The global naturalization of exotic species has been shown to track their climatic niches22,23,24 and they may even expand into new habitats by slightly shifting their niches25. For native species, range shifts often lag behind climate change due to factors such as demographic inertia and biotic interactions26,27. These lagging tail populations are increasingly vulnerable to decline due to disequilibrium with the new climate, thus contributing to local extinction debt1,28. In this scenario, invasions by exotic species will accelerate the extinction of native populations due to climate-induced asymmetric competition. Taking temperature as an example, in introduced ranges, exotic populations tend to originate from warmer native ranges such as lower elevations or lower latitudes29,30,31, implying that exotic species have a higher temperature niche than the native species with which they co-occur. If this is true, it would be very useful in explaining why exotic species benefit more from climate warming than natives. Studies on plants asynchronously migrating with climate warming in alpine systems may be a microcosm of the invasion process, showing how alpine plants fail in new competition with thermally adapted species from lower altitudes32. Therefore, comparing differences in the climatic niches of co-occurring exotic and native species will yield valuable insights into explaining the different levels of invasion in current conditions and predicting future climate responses of biodiversity.
Here we used a combination of climatic niche estimates based on global occurrence records and a field survey to explore how climatic niches govern the severity of exotic species invasions and native diversity loss under different climate conditions (Fig. 1). We conducted a field survey of 459 plots across a ~1,800-km transect along the Yangtze River Valley in China (Methods) to: (1) estimate climatic niches of the 142 plant species observed by examining global occurrence records for each species to generate distributions for 19 bioclimatic variables (Extended Data Table 1). The native range climatic median (NCM) of each species represents its climatic niche centroid; (2) predict the effect of each climatic variable on exotic versus native species performances by examining how values in the field sites compared with the NCMs of each species; (3) test how each climatic variable impacts exotic versus native species in nature by examining the relationships of exotic and native richness to climate variability among field sites; (4) predict future invasion trends in this region by repeating these analyses using future (100 years) climate conditions at the field sites; and (5) test how exotic species compensate for the loss of native species by examining changes in species richness as communities shifted from native to exotic plant dominance.
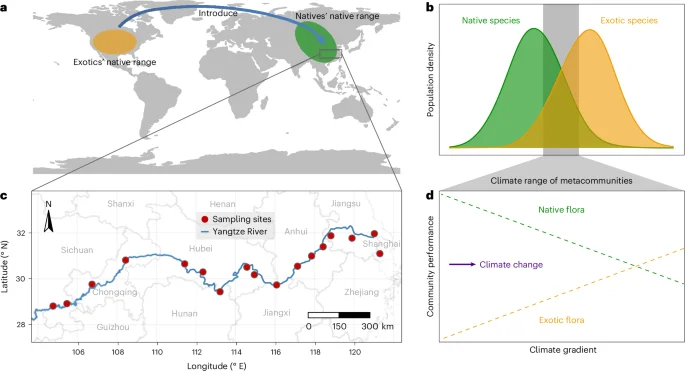
a, Native ranges of exotic and native plant species. b, Differences in climatic niches of exotic and native species in their native ranges along with climate conditions across field sites. c, A field survey of 459 plots spanning more than 1,800 km along the Yangtze River Valley in China. d, Dependence of performances of exotic and native floras in the field metacommunity on current climate variation among field sites, and predicted effects of future climate on plant invasions.
Results
Climatic niche differences
Differences in climatic niches between exotic and native species underlie their differential responses to climate conditions. We found that the climatic niches of exotic plant species were distinct from those of native species with significant differences between exotic and native species for 17 of the 19 bioclimatic variables (Fig. 2). First, niches of exotic species were characterized by higher temperatures (average temperature [B01]), which was reflected by warmer winters (annual minimum temperature [B06], higher temperature of coldest quarter [B11]), warmer dry seasons (B09) and hotter summers (B05). Second, niches of exotic species were characterized by a more isothermal climate (B03 = B02/B07) which reflected both a larger mean diurnal range (B02) and smaller temperature annual range (B07). Third, niches of exotic species were characterized by drier overall (annual precipitation [B12]), rainy seasons (wettest month [B13], wettest quarter [B16]) and summers (B18), but more rain in the dry season (driest month [B14] and driest quarter [B17]) and winter (B19). Finally, niches of exotic species were characterized by lower climate seasonality (temperature [B04] and precipitation [B15]). Exotic and native species niches were similar in terms of temperature in the wettest (B08) or warmest (B10) quarters.
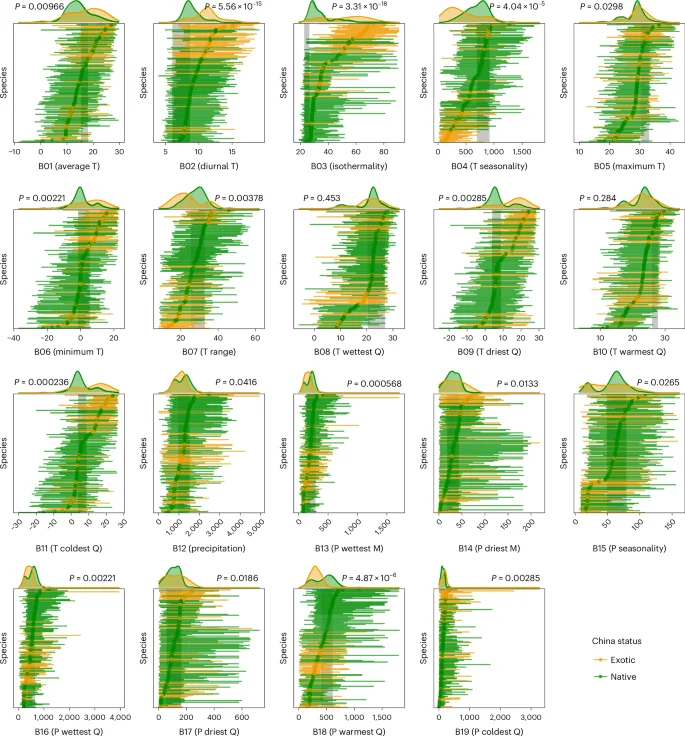
Each point with horizontal line represents a species’ climatic median with 1% to 99% percentiles in its native range. The grey bands indicate the climate range across field sites in the Yangtze River Valley. T, temperature; P, precipitation; Q, quarter; M, month. The top of each panel shows the adjusted P value for the difference in climatic medians of exotic (orange) and native (green) species based on ANOVAs. More detailed statistical information can be found in Extended Data Tables 2 and 3.
Predicted and field performances
The performances of exotic and native species in a given community depend not only on their climatic niche differences but also on how suitable the climate is for them (that is, the distance from the site’s climate to the species’ climatic niche centroid). In the Yangtze River Valley, the predicted effects of bioclimatic variables on invasion intensity based on climatic niches almost always matched the patterns we found in the field survey (Fig. 3). Specifically, invasions were predicted to be more severe (Fig. 3a) when it is warmer overall (B01) and in winters (B06, B11), and invasions were indeed more severe in these conditions in our field survey (Fig. 3b). Moreover, invasions were predicted to be less severe when diurnal temperature range was larger (B02), conditions were more isothermal (B03), or precipitation was higher overall [B12] and during the wettest month [B13], patterns that were all observed in the field surveys. There were two variables that were predicted but did not have a significant effect in the field (precipitation in the wettest [B16] or warmest [B18] quarter). Some variables were significantly related to invasion in the field survey but were not predicted to have an effect (climate seasonality ([B04] and [B15]); temperature in summer extreme [B05], wettest quarter [B08] or driest quarter [B09]; temperature annual range [B07]; or precipitation in the driest month [B14], driest quarter [B17] or coldest quarter [B19]). When focusing only on the seven variables (B01, B02, B03, B06, B11, B12, B13; Extended Data Tables 2 and 3) that were significant in all three aspects: climatic niche differences (that is, exotic versus native species niche differences), predicted effect on invasions (that is, differences from NCMs) and observed invasion patterns in the field (that is, exotic versus native richness responses), the predicted patterns were completely consistent with richness responses in the field.
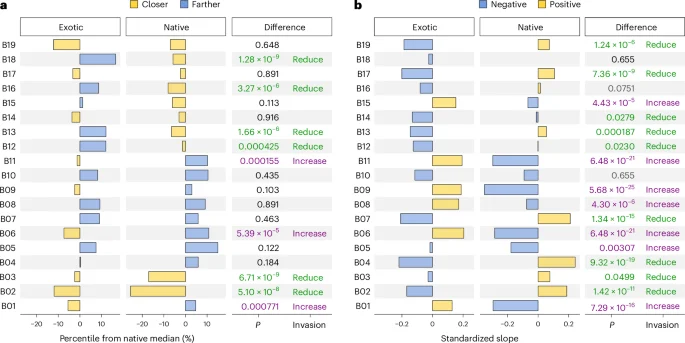
a, Effects of bioclimatic variables on each species were predicted to be positive when the maximum observed value across field survey sites was closer to NCMs than was the minimum value. Adjusted P values on the right are from ANOVAs that tested whether the predicted effects depended on species status (exotic versus native). b, Observed effects were calculated as the slopes of species richness versus bioclimatic variables across field sites. Adjusted P values on the right indicate whether the slopes depended on species status (exotic versus native). Yellow (closer/positive) and blue (farther/negative) bars indicate better and worse conditions, respectively. ‘Increase (purple)’ and ‘Reduce (green)’ indicate how a change in that bioclimatic variable from minimum to maximum across field sites was predicted or observed to affect exotic plant invasions. The full names of the bioclimatic variables are shown in Extended Data Table 1, and full statistical results are shown in Extended Data Tables 2 and 3.
There were three main climatic effects on invasion after taking into account the correlation among bioclimatic variables (Extended Data Fig. 1). First, warmer climates, especially warmer winters, increased exotic plant invasions (B01, B06, B11). Warmer temperatures across the field sites made conditions closer to the NCMs of exotic species (that is, more suitable) and farther away from those of native species (that is, less suitable; Figs. 2 and 3a). This resulted in the exotic flora in the metacommunity being better adapted to current temperatures than the native flora that was adapted to cooler temperatures (Extended Data Fig. 2). Second, a more isothermal climate (B03) reduced invasion and this effect was also associated with a larger mean diurnal range (B02). Exotic species were adapted to a larger diurnal range than native species (Fig. 2), with temperature variation at field sites closer to the NCMs of native species (Fig. 3a). Third, more precipitation (B12), especially during the rainy season (B13), reduced invasion. Exotic species were adapted to more arid climates than those in the Yangtze River area (Fig. 2). Thus, higher precipitation across field sites increased differences from the NCMs of exotic species (Fig. 3a), which may lead to less intense invasions (Extended Data Fig. 2). In other words, increased aridity will increase invasion intensity.
Future invasion trends
We explored future climate scenarios (100 years from now) with a predicted mean temperature increase of 3.3 °C and annual precipitation increase of 9%33, accompanied by a 1 °C increase in mean diurnal range34 in the region. First, warming is predicted to increase invasions throughout the Yangtze River Valley survey sites (Fig. 4). The effects of warming are predicted to be more severe in the site that is currently the coldest where conditions will become better for exotics and worse for natives compared with the site that is currently the warmest where conditions will become worse for natives but remain similar for exotics. Second, increased diurnal temperature variation is predicted to reduce invasions at the least variable sites where conditions will improve more for native than for exotic species. However, it is predicted to increase invasions at the most variable sites where conditions improve for exotic species but worsen for native species (Fig. 4). This shift is due to the fact that the diurnal range at the most variable sites is already very close to the NCMs of native species, and further increases will move away from the natives’ NCMs and get closer to that of exotics (Fig. 2, B02). Third, increased precipitation is not predicted to impact invasion at either the driest site where conditions will tend to improve for both exotic and native species, or at the wettest site where conditions will become similarly worse for both exotic and native species (Fig. 4). This ecosystem dependence is most probably influenced by differences in the differences between climate conditions at the field sites and the climatic medians of species. Overall, these changes are predicted to create better conditions for exotic species across all sites while not changing the suitability for natives such that invasions will become more severe.
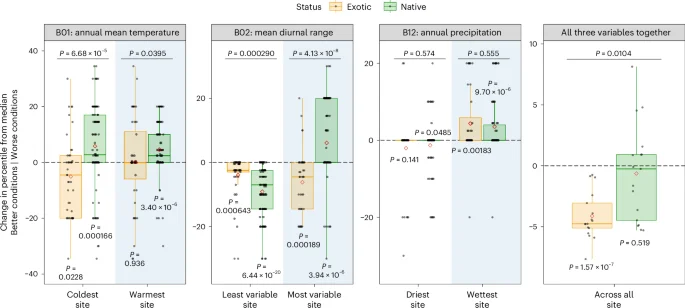
Median values in the native range were compared to current and future (+100 years; +3.3 °C) temperatures at the warmest and coldest sites, diurnal range (+1 °C) at the least and most variable sites, and increased precipitation (+9%) at the driest and wettest sites. For each of these cases, an ANOVA (or a two-sided paired t-test for comparisons across all sites) was used to test whether the predicted effects depended on species status (P value above the line; n = 142 [individual site], n = 17 [across all sites]). Two-sided Welch t-tests were used to examine differences from zero (P value following each box-and-whisker plot; n = 44 exotics and n = 98 natives [individual site], n = 17 [across all sites]). Boxplots show median (centre line), mean (diamond), interquartile range (IQR, box), 1.5 times IQR (whiskers), and individual data points (dots) for each site and status. Negative values (closer to median) indicate that climate changes had positive effects on exotic or native species, while positive values (farther from median) indicate negative effects.
Source data
Compensation of native diversity loss by exotics
The declines in native species diversity were primarily affected by temperature and secondarily by human activities (Extended Data Fig. 3). In the process of a community shifting from being dominated by native plants to being dominated by exotic plants, the loss of natives reduces the overall species diversity, while the accumulation of exotics increases the overall species diversity, and species diversity is highest when exotics and natives are approximately equally abundant (Fig. 5).
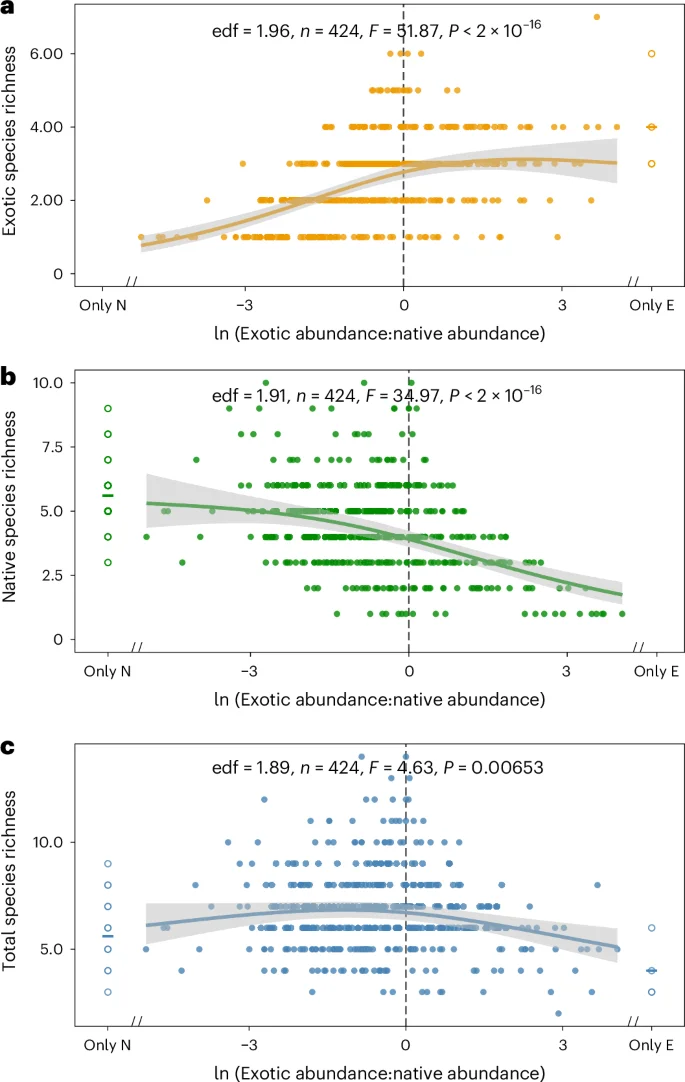
a–c, Effects on exotic species (a), native species (b) and overall species (c). The solid lines are fitted curves and the shaded areas in grey are 95% confidence intervals based on generalized additive mixed models and ANOVA with quasi-Poisson zero structure. edf, effective degrees of freedom. The vertical dashed lines indicate equal abundance of exotic and native plants, with the left side indicating dominance by native plants and the right side indicating dominance by exotic plants. Plots containing only native plants (31 plots) and plots containing only exotic plants (4 plots) were excluded from these models. The open circles on the left and right represent the richness of native plants and exotic plants, respectively. The centre lines indicate mean values.
Discussion
Understanding the differences between exotic and native species is a core goal of biological invasion research. A number of previous studies have compared competition-related traits in resident and established exotics to meet this goal35,36. However, traits related to environmental filtering could reflect species’ preadaptation to the climate in introduced ranges37. These traits may reflect the climatic conditions they experienced in their native range, which in turn shape their climatic niche. For example, some exotic plants from tropical areas tend to have C4 photosynthesis pathways, which allows them to successfully establish in warm habitats. As the global climate warms, exotic species migrate to higher elevations and latitudes to fill newly created, but unfilled, temperature niches by tracking favourable climates30,31, so they will potentially be able to occupy higher temperature niches than their co-occurring residents in the introduced range. Therefore, on the basis of climatic niche, we can predict whether an exotic species will be able to naturalize in a given climate zone and how they will respond to climate change.
The Yangtze River Valley has a subtropical monsoon climate characterized by hot, wet summers. Our predictions and field surveys show that warmer climates increase exotic plant invasions, whereas more isothermal climates and higher precipitation reduce invasions. Overall, temperature-related changes most strongly affected the severity of exotic plant invasions in the Yangtze River Valley (Extended Data Fig. 3). A recent study on globally invasive trees also found that temperature was the most important driver in determining invasion occurrence38. Understanding current invasion processes is a powerful tool for predicting future changes in biodiversity. In the context of global climate change, the Yangtze River Valley is also experiencing substantial climate change, especially increases in winter temperatures39. Under the predicted climate scenario of the next 100 years in the Yangtze River Valley, climate warming will continue to promote plant invasion, the increase in the diurnal range is expected to gradually shift from suppressing invasion to promoting invasion, and changes in precipitation are unlikely to drastically impact invasion. These changes will, overall, create better conditions for exotic species.
Globally, there are more than 13,000 species of plants, approximately the size of the native European flora, that have been naturalized somewhere else on Earth40. Disagreement persists over whether the exotic species have caused substantial negative impacts on native communities and how they should be managed41,42,43. Some argue that exotic species are not drivers of community change, but simply passengers along for the environmental ride6,7,8. We found that the decline of native diversity and the prevalence of exotic species in a metacommunity are two covarying processes driven by climate change. This suggests caution in inferring causal relationships on the basis of correlations between exotic and native diversity. On the basis of our findings, we propose that exotic plant invasions represent a rational species turnover process in the ecological responses of biodiversity driven by climate change. Although other factors, such as natural enemy escape, play a role in influencing invasion, we believe that these factors operate within a macroscopic framework of climate-dominated environmental filters.
Methods
Metacommunity and field survey
The term ‘metacommunity’ is used to describe a set of interacting local ecosystems that are connected through the migration or exchange of species44. Bioregional connectivity is necessary to prevent dispersal barriers of the species. Eliminating barriers will help independently estimate climatic effects on species distributions by allowing species to fill their fundamental niches. Rivers and their associated shipping activities act as connectors to relieve species dispersal limitation, rendering plant communities distributed along river banks an ideal system for our study of climate-driven invasions.
To obtain plant occurrence data for a metacommunity, we conducted a field survey in the middle and lower reaches of the Yangtze River along a ~1,800-km transect during the 2018 growing season (June to August). The Yangtze River originates from the Tibetan Plateau and runs across most of China from west to east. The climate type of the middle and lower reaches is mainly subtropical monsoon climate. The annual mean temperature across all surveyed sites varied from 15.3 to 18.5 °C, and the annual precipitation ranged from 994 to 1,498 mm yr−1. Our surveys were conducted across sites in 17 cities along Yangtze Valley (Fig. 1c). In each city, we randomly selected three communities on the outskirts of the city for investigation. We avoided agricultural and artificial (that is, ornamental) vegetation. At each community, one 15 × 15 m2 sample area was randomly established, and then nine 1 × 1 m2 plots were set up in each sample area. In total, we set up 459 plots in 51 communities. These plots are dominated by herbaceous plant communities with few woody plant seedlings. We recorded the number of plant species in all plots. For those species that were difficult to identify in the field, we collected plant specimens and brought them back to the laboratory for confirmation.
Native range and climatic niches
We used Plants of the World Online (https://powo.science.kew.org/) to determine the native range of each plant species. If a plant was native in part of a country (for those subdivided in the database), we considered it native to the entire country except for the Russian Federation for which we followed the division between Europe and Asia at the Ural Mountains. We classified two plant species (Cinnamomum camphora, Vigna radiata) that were reported as being introduced to China >2,000 years ago as native. Finally, we obtained 44 exotic species and 98 native species.
The climatic niches of species are generally estimated by matching species occurrences with spatial climate data45. We obtained occurrence records from Global Biodiversity Information Facility (https://www.gbif.org/) for each of the 142 species. We used bioclimatic data from WorldClim (https://www.worldclim.org/) to determine the values for each of 19 bioclimatic variables for each occurrence of each species in their native range. Then, for each bioclimatic variable for each species, we determined the values for minimum and maximum along with the 1st, 5th, 10th, 25th (1st quartile), 50th (median), 75th (3rd quartile), 90th, 95th and 99th percentile and interpolated the distributions linearly between these points.
Statistical analyses
To compare climatic niche differences between exotic and native species, we ran 19 separate linear mixed-effects models (LMMs) testing whether NCMs depended on species status using the ‘lme4’ R package46. Analysis of variance (ANOVA) with Satterthwaite’s method was applied to determine the significance level through the ‘lmerTest’ R package47 (the unit of replication was species). We included (or not, in the case of singularity fit) family as a random intercept term to account for potential taxonomic autocorrelation in the residuals of the models. Furthermore, two covariates (climatic niche breadth and symmetry) were included in these models to explore potential effects of varying sampling effort among continents and geographical barriers. Specifically, climatic breadth is the range from the 1% to the 99% percentile of a species’ distribution at climatic conditions, which was used to control for potential effects of undersampling the true niche size of species. To avoid the influence of extreme records, we therefore did not use a range from minimum to maximum values to represent climatic breadth. Climatic symmetry is the ratio of the climate range from the 1% and 99% percentiles to the median (climate range of the shorter side divided by that of the longer side), which was used to control for the effects of spatial imbalance in sampling (for example, range truncated by coastlines or mountains). The value range of symmetry is 0 (median is at one of the extremes) to 1 (perfect symmetry on either side of the mean). To control for false discovery rate due to multiple comparisons, we applied the Benjamini–Hochberg procedure for each predictor to adjust the P values across all 19 bioclimatic variables using the ‘p.adjust’ R function. Climatic breadth and symmetry had significant effects on the NCMs of some bioclimatic variables but had no effects on those of others (Extended Data Table 2). Overall, these effects were less likely to be lopsided in favour of exotic or native species (Extended Data Table 3).
To predict the dependence of plant invasion severity on bioclimates at the field survey sites, we estimated how suitable the bioclimatic conditions were for native versus exotic species. For each bioclimatic variable, we first estimated how far the lowest value at the field survey sites (for example, for B01, the coldest site) was from the NCM of each species in terms of percentiles (that is, if the average temperature at the coldest site was in the 20th percentile in the distribution of temperatures in which a plant species occurs in the native range, we gave a value of 30 = |50−20|). Then we repeated this for the field survey site with the highest value (for example, for B01, the warmest site). Next, we used the differences in these values as an estimate of the direction and magnitude of the effect of that bioclimatic variable on the performance of that species. For example, if going from the survey site with the lowest to the highest annual mean temperature (B01) would on average bring the survey site temperature 5.5 percentile points closer to the NCMs for exotic species and 4.7 percentile points farther from the NCMs for native species, this predicts that invasions will be more severe in the warmest site compared with the coldest site. Finally, we conducted a similar set of LMMs and ANOVAs to test whether the predicted effects of each bioclimatic variable depended on species status (the unit of replication was species). We also adjusted the P values across all 19 bioclimatic variables using the same procedure. In these models, the potential effects of taxonomic autocorrelation, varying sampling effort among continents and geographical barriers were also controlled.
To estimate the effects of future climate change for the variables that impacted current invasion severity, we conducted a set of ANOVAs and t-tests with predicted future (100 years) average temperature (B01, +3.3 °C) and annual precipitation (B12, +9%)38 along with diurnal temperature variation (B02, +1 °C)34. In these analyses, we compared the differences in values from the NCMs under current conditions for warming at the warmest and coldest sites, increased precipitation at the driest and wettest sites, and increased diurnal variation at the least and most variable sites. For each of these cases, we performed an ANOVA to test whether the predicted effects depended on species status, and t-tests to examine differences from zero (the unit of replication was species). We performed another analysis with each field site as a replicate in which we examined combined effects of changes in all three bioclimatic variables (B01, B02, B12). At each field site, we calculated the three-dimensional Euclidean distance of all 142 plant species from current versus future conditions to their NCMs for each field site. We used a paired t-test to test whether the predicted effects (current − future distance to NCM) depended on species status, and t-tests to examine differences from zero (the unit of replication was field site).
To compare the relative effects of bioclimatic variables on the richness of exotic and native plants at field survey sites, we ran 19 separate LMMs using the ‘lme4’ R package46. We applied ANOVAs with Satterthwaite’s method to determine the significance level of the interactions between bioclimatic variables and species status using the ‘lmerTest’ R package47 (the unit of replication was richness entry). All variables were scaled before including them in the models. We included the random factors ‘community identity nested in city’ to control for city- and community-specific variation and ‘plot identity nested in community’ to control for exotic and native species richness being measured in the same plot. We also adjusted the P values across all 19 bioclimatic variables. The estimates were used to indicate the direction and magnitude of the effects of bioclimatic variables on the richness of exotic and native plants.
To assess how well exotic and native flora are equilibrated with the climates at field sites, we first calculated the means of NCMs involving annual mean temperature (B01) and annual precipitation (B12) for all species in a plot by abundance weighting, and then used the distances from the NCM means to the climates at field sites to indicate the deviation degrees of community and climate. The closer the distance is to zero, the better the community matches the climate. We used multivariate ANOVA (MANOVA) with Pillai method to compare the degrees of deviation from climate (B01 and B12) between exotic and native communities, and separately examined the degrees of deviation in B01 and B12 using paired t-test (the unit of replication was plot). Plots containing only native plants (31 plots) or only exotic plants (4 plots) were not included in these paired tests.
To examine how exotic species replace native species, we ran three separate generalized additive mixed models (GAMMs) with quasi-Poisson zero structure in the ‘mgcv’ R package48 using the ‘gamm’ function (the unit of replication was plot). Sampling site identity was used as a random factor. GAMM applies non-parametric smoothing to explanatory variables and can thus model nonlinear relationships49,50. The reason GAMMs were used is because we found that species richness responds nonlinearly with increasing exotic dominance. Model comparisons based on Akaike information criterion values also show that nonlinearity has better fits than linearity. The log-transformed ratio of exotic to native abundance in each plot was used to indicate the dominance degree of exotic plants. Because four plots did not include native species, it was not possible to calculate the exotic/native abundance ratio, and 31 plots did not include exotic species and could not be log transformed, hence these 35 plots (7.6% of all plots) were excluded from the models.
To decompose the relative contributions of biotic and abiotic factors to exotic and native species diversity, we conducted variation partitioning analysis with the ‘rdacca.hp’ function and RDA method in the ‘rdacca.hp’ R package51 (the unit of replication was plot). The richness of exotic species was explained by four aspects: temperature, precipitation, human activity and propagule pressure. Native species richness was explained by four aspects: temperature, precipitation, human activity and invasion by exotic species. Climatic variables included B01, B02, B03, B06, B11, B12 and B13, which impacted invasion severity (Extended Data Table 2). The variables involving human activities were population density and gross domestic product. Propagule pressure for exotic species was expressed as the distance from the field site to the estuary. The impact of invasions on native species was represented by exotic species richness. All variables were scale transformed. The relative effect of estimates is the percentage of the variance of each group variables that accounts for the variance of all four groups.
Reporting summary
Further information on research design is available in the Nature Portfolio Reporting Summary linked to this article.
Data availability
The data supporting the findings of this study are available on figshare at https://doi.org/10.6084/m9.figshare.26165212 (ref. 52). Data on plant global occurrences are publicly available at the Global Biodiversity Information Facility (https://www.gbif.org/). Bioclimatic data are publicly available at WorldClim (https://www.worldclim.org/). Source data are provided with this paper.
Code availability
R scripts used in the analyses are available at https://doi.org/10.6084/m9.figshare.26165212 (ref. 52).
References
-
Norberg, J., Urban, M. C., Vellend, M., Klausmeier, C. A. & Loeuille, N. Eco-evolutionary responses of biodiversity to climate change. Nat. Clim. Change 2, 747–751 (2012).
Google Scholar
-
Urban, M. C. et al. Improving the forecast for biodiversity under climate change. Science 353, aad8466 (2016).
Google Scholar
-
Holzmann, K. L., Walls, R. L. & Wiens, J. J. Accelerating local extinction associated with very recent climate change. Ecol. Lett. 26, 1877–1886 (2023).
Google Scholar
-
Roman-Palacios, C. & Wiens, J. J. Recent responses to climate change reveal the drivers of species extinction and survival. Proc. Natl Acad. Sci. USA 117, 4211–4217 (2020).
Google Scholar
-
Wiens, J. J. Climate-related local extinctions are already widespread among plant and animal species. PLoS Biol. 14, e2001104 (2016).
Google Scholar
-
Thomas, C. D. & Palmer, G. Non-native plants add to the British flora without negative consequences for native diversity. Proc. Natl Acad. Sci. USA 112, 4387–4392 (2015).
Google Scholar
-
Didham, R. K., Tylianakis, J. M., Hutchison, M. A., Ewers, R. M. & Gemmell, N. J. Are invasive species the drivers of ecological change? Trends Ecol. Evol. 20, 470–474 (2005).
Google Scholar
-
MacDougall, A. S. & Turkington, R. Are invasive species the drivers or passengers of change in degraded ecosystems? Ecology 86, 42–55 (2005).
Google Scholar
-
Gurevitch, J. & Padilla, D. K. Are invasive species a major cause of extinctions? Trends Ecol. Evol. 19, 470–474 (2004).
Google Scholar
-
Hulme, P. E. et al. Challenging the view that invasive non-native plants are not a significant threat to the floristic diversity of Great Britain. Proc. Natl Acad. Sci. USA 112, E2988–E2989 (2015).
Google Scholar
-
Sorte, C. J. et al. Poised to prosper? A cross-system comparison of climate change effects on native and non-native species performance. Ecol. Lett. 16, 261–270 (2013).
Google Scholar
-
Jia, J., Dai, Z., Li, F. & Liu, Y. How will global environmental changes affect the growth of alien plants? Front. Plant Sci. 7, 1623 (2016).
Google Scholar
-
Liu, Y. et al. Do invasive alien plants benefit more from global environmental change than native plants? Glob. Change Biol. 23, 3363–3370 (2017).
Google Scholar
-
Giejsztowt, J., Classen, A. T. & Deslippe, J. R. Climate change and invasion may synergistically affect native plant reproduction. Ecology 101, e02913 (2020).
Google Scholar
-
Lilley, P. L. & Vellend, M. Negative native–exotic diversity relationship in oak savannas explained by human influence and climate. Oikos 118, 1373–1382 (2009).
Google Scholar
-
Perez-Navarro, M. A. et al. Comparing climatic suitability and niche distances to explain populations responses to extreme climatic events. Ecography 2022, e06263 (2022).
Google Scholar
-
Broennimann, O. et al. Distance to native climatic niche margins explains establishment success of alien mammals. Nat. Commun. 12, 2353 (2021).
Google Scholar
-
Sagarin, R. D. & Gaines, S. D. The ‘abundant centre’ distribution: to what extent is it a biogeographical rule? Ecol. Lett. 5, 137–147 (2002).
Google Scholar
-
Rosenblad, K. C., Perret, D. L. & Sax, D. F. Niche syndromes reveal climate-driven extinction threat to island endemic conifers. Nat. Clim. Change 9, 627–631 (2019).
Google Scholar
-
Grinder, R. M. & Wiens, J. J. Niche width predicts extinction from climate change and vulnerability of tropical species. Glob. Change Biol. 29, 618–630 (2023).
Google Scholar
-
Wang, Y., Pineda-Munoz, S. & McGuire, J. L. Plants maintain climate fidelity in the face of dynamic climate change. Proc. Natl Acad. Sci. USA 120, e2201946119 (2023).
Google Scholar
-
Petitpierre, B. et al. Climatic niche shifts are rare among terrestrial plant invaders. Science 335, 1344–1348 (2012).
Google Scholar
-
Liu, C., Wolter, C., Xian, W. & Jeschke, J. M. Most invasive species largely conserve their climatic niche. Proc. Natl Acad. Sci. USA 117, 23643–23651 (2020).
Google Scholar
-
Neelavar Ananthram, A. et al. Niche shift in invasive species: is it a case of ‘home away from home’ or finding a ‘new home’? Biodivers. Conserv. 31, 2625–2638 (2022).
Google Scholar
-
Atwater, D. Z., Ervine, C. & Barney, J. N. Climatic niche shifts are common in introduced plants. Nat. Ecol. Evol. 2, 34–43 (2018).
Google Scholar
-
Hagedorn, F., Gavazov, K. & Alexander, J. M. Above- and belowground linkages shape responses of mountain vegetation to climate change. Science 365, 1119–1123 (2019).
Google Scholar
-
Bertrand, R. et al. Changes in plant community composition lag behind climate warming in lowland forests. Nature 479, 517–520 (2011).
Google Scholar
-
Jackson, S. T. & Sax, D. F. Balancing biodiversity in a changing environment: extinction debt, immigration credit and species turnover. Trends Ecol. Evol. 25, 153–160 (2010).
Google Scholar
-
Géron, C. et al. Urban alien plants in temperate oceanic regions of Europe originate from warmer native ranges. Biol. Invas. 23, 1765–1779 (2021).
Google Scholar
-
Zhang, Z. et al. The poleward naturalization of intracontinental alien plants. Sci. Adv. 9, eadi1897 (2023).
Google Scholar
-
Iseli, E. et al. Rapid upwards spread of non-native plants in mountains across continents. Nat. Ecol. Evol. 7, 405–413 (2023).
Google Scholar
-
Alexander, J. M., Diez, J. M. & Levine, J. M. Novel competitors shape species’ responses to climate change. Nature 525, 515–518 (2015).
Google Scholar
-
Christensen, J. H. et al. in Climate Change 2007: The Physical Science Basis (eds Solomon, S. et al.) 847–940 (Cambridge Univ. Press, 2007).
-
Huang, X. et al. Increasing global terrestrial diurnal temperature range for 1980–2021. Geophys. Res. Lett. 50, e2023GL103503 (2023).
Google Scholar
-
van Kleunen, M., Weber, E. & Fischer, M. A meta-analysis of trait differences between invasive and non-invasive plant species. Ecol. Lett. 13, 235–245 (2010).
Google Scholar
-
Suda, J., Meyerson, L. A., Leitch, I. J. & Pysek, P. The hidden side of plant invasions: the role of genome size. New Phytol. 205, 994–1007 (2015).
Google Scholar
-
Divisek, J. et al. Similarity of introduced plant species to native ones facilitates naturalization, but differences enhance invasion success. Nat. Commun. 9, 4631 (2018).
Google Scholar
-
Delavaux, C. S. et al. Native diversity buffers against severity of non-native tree invasions. Nature 621, 773–781 (2023).
Google Scholar
-
Su, B. D., Jiang, T. & Jin, W. B. Recent trends in observed temperature and precipitation extremes in the Yangtze River basin, China. Theor. Appl. Climatol. 83, 139–151 (2006).
Google Scholar
-
van Kleunen, M. et al. Global exchange and accumulation of non-native plants. Nature 525, 100–103 (2015).
Google Scholar
-
Davis, M. et al. Don’t judge species on their origins. Nature 474, 153–154 (2011).
Google Scholar
-
Sax, D. F., Schlaepfer, M. A. & Olden, J. D. Identifying key points of disagreement in non-native impacts and valuations. Trends Ecol. Evol. 38, 501–504 (2023).
Google Scholar
-
Sax, D. F., Schlaepfer, M. A. & Olden, J. D. Valuing the contributions of non-native species to people and nature. Trends Ecol. Evol. 37, 1058–1066 (2022).
Google Scholar
-
Leibold, M. A. et al. The metacommunity concept: a framework for multi-scale community ecology. Ecol. Lett. 7, 601–613 (2004).
Google Scholar
-
Liu, X. et al. Realized climatic niches are conserved along maximum temperatures among herpetofaunal invaders. J. Biogeogr. 44, 111–121 (2016).
Google Scholar
-
Bates, D., Mächler, M., Bolker, B. M. & Walker, S. C. Fitting linear mixed-effects models using lme4. J. Stat. Softw. 67, 1–48 (2015).
Google Scholar
-
Kuznetsova, A., Brockhoff, P. B. & Christensen, R. H. B. lmerTest package: tests in linear mixed effects models. J. Stat. Softw. 82, 1–26 (2017).
Google Scholar
-
Wood, S. N. Generalized Additive Models: An Introduction with R 2nd edn (CRC, 2017).
-
Wood, S. N. & Augustin, N. H. GAMs with integrated model selection using penalized regression splines and applications to environmental modelling. Ecol. Modell. 157, 157–177 (2002).
Google Scholar
-
Wood, S. N., Pya, N. & Säfken, B. Smoothing parameter and model selection for general smooth models. J. Am. Stat. Assoc. 111, 1548–1563 (2016).
Google Scholar
-
Lai, J. S., Zou, Y., Zhang, J. L. & Peres-Neto, P. R. Generalizing hierarchical and variation partitioning in multiple regression and canonical analyses using the rdacca.hp R package. Methods Ecol. Evol. 13, 782–788 (2022).
Google Scholar
-
Chen, P. et al. Deterministic responses of biodiversity to climate change through exotic species invasions. figshare https://doi.org/10.6084/m9.figshare.26165212 (2024).
Acknowledgements
We thank J. Ren, Q. Dong, B. Nie and J. Yi of Wuhan Botanical Garden for help in the field survey, and D. Sax of Brown University for comments on an earlier draft of this paper. This study was funded by the National Natural Science Foundation of China (31822007 and 32071660 to W.H.).
Author information
Authors and Affiliations
Contributions
W.H., E.S. and P.C. designed the research. C.S., Z.T. and W.Q. collected the field data. E.S. and P.C. assembled the literature data. E.S. and P.C. analysed the data. W.H., E.S. and P.C. wrote the initial draft of the paper. All authors contributed to the revisions.
Corresponding author
Ethics declarations
Competing interests
The authors declare no competing interests.
Peer review
Peer review information
Nature Plants thanks the anonymous reviewers for their contribution to the peer review of this work.
Additional information
Publisher’s note Springer Nature remains neutral with regard to jurisdictional claims in published maps and institutional affiliations.
Extended data
Extended Data Fig. 1 Correlation coefficients of bioclimatic variables in field sites.
A positive value (red) indicates a positive correlation and a negative value (blue) indicates a negative correlation.
Extended Data Fig. 2 Climatic equilibriums of exotic and native floras in field metacommunity.
Each point represents the distance from the NCM mean of all occurrences for plants in a plot to the field site climates (annual mean temperature [B01] and annual precipitation [B12]). Ellipses represent 95% confidence intervals. The closer the distance is to the center of coordinates, the better the community matches the climate. A MANOVA with Pillai method was used to compare the degree of deviation from climates between exotic and native communities (B01 and B12 together). Two-sided paired t-test was used to test that in B01 (t = 16.5, P < 2.2×10⁻¹⁶) and B12 (t = −3.32, P = 0.000964) separately (n = 424 plots). The marginal boxplots are separate statistics for the temperature and the precipitation. In these boxplots, the line inside the box is the median, the box is the 25–75% percentile, the lines outside the box are the minimum and maximum values excluding outliers, and the points are outliers.
Extended Data Fig. 3 Relative contributions of biotic and abiotic factors to exotic and native plant diversity based on variance partitioning.
Climatic variables included were B01, B02, B03, B06, B11, B12, and B13, which each significantly impacted invasion severity (Extended Data Table. 2). The variables involving human activities were human population density and gross domestic product. Propagule pressure for exotic species was expressed as the distance from the field site to the estuary. The impact of invasions on native species was represented by exotic richness. The relative effect of estimates is the percentage of the variance of each group variables that accounts for the variance of all four groups (n = 459 plots).
Supplementary information
Reporting Summary
Source data
Source Data Fig. 4
Statistical source data.
Rights and permissions
Open Access This article is licensed under a Creative Commons Attribution-NonCommercial-NoDerivatives 4.0 International License, which permits any non-commercial use, sharing, distribution and reproduction in any medium or format, as long as you give appropriate credit to the original author(s) and the source, provide a link to the Creative Commons licence, and indicate if you modified the licensed material. You do not have permission under this licence to share adapted material derived from this article or parts of it. The images or other third party material in this article are included in the article’s Creative Commons licence, unless indicated otherwise in a credit line to the material. If material is not included in the article’s Creative Commons licence and your intended use is not permitted by statutory regulation or exceeds the permitted use, you will need to obtain permission directly from the copyright holder. To view a copy of this licence, visit http://creativecommons.org/licenses/by-nc-nd/4.0/.
Reprints and permissions
About this article
Cite this article
Chen, P., Shen, C., Tao, Z. et al. Deterministic responses of biodiversity to climate change through exotic species invasions.
Nat. Plants (2024). https://doi.org/10.1038/s41477-024-01797-7
-
Received: 27 April 2024
-
Accepted: 28 August 2024
-
Published: 18 September 2024
-
DOI: https://doi.org/10.1038/s41477-024-01797-7