Abstract
Extreme heat events are increasingly common, and if these align with pollen development, they can alter pollen nutrient composition. However, no studies have examined how the timing of heat relative to bud development affects the role of pollen in plant pollination and bee health. To explore this, we exposed highbush blueberry plants to extreme heat (37.5 °C) or normal (25 °C) conditions for 4 h across several floral bud stages. Pollen was analyzed for protein, carbohydrate, and amino acid content. We found that blueberry floral buds vary in their sensitivity to heat, with bud swell being the most heat-sensitive developmental stage with significant reductions in pollen protein, total and several individual amino acids. When pollen from blueberry plants exposed to the same conditions was fed to Osmia lignaria larvae, we found that individuals fed heat-stressed pollen were 7 times more likely to die compared to those fed non-stressed pollen. Blueberry flowers exposed to the same conditions were used for a hand pollination study, where we observed a 39% reduction in fruit set following heat stress at bud swell. This study reveals how extreme heat can disrupt both plant pollination and bee survival through changes in pollen nutritional composition.
Introduction
Pollen is the link between flowering plants and bees, as most angiosperms require insect-mediated pollination for their reproduction1,2, and most bees rely on pollen to fulfill their nutritional needs3. However, extreme heat can inhibit the development and performance of pollen4,5,6,7with potential consequences for plants, bees, and their interactions8. Heat-driven reductions in pollen quality are expected to affect plant reproduction4,5,6, but the consequences for bees consuming heat stressed pollen are still unclear9,10,11,12. Specifically, no research has assessed the mechanisms driving the effects of heat stressed pollen diets on bee behavior, development, and survival. However, previous studies suggest that heat-altered pollen nutrition could affect bee health8,10. Understanding the consequences of extreme heat on pollen nutrition will be increasingly important in natural and managed pollination systems as climate change continues to intensify, particularly during floral development.
Extreme heat conditions can alter pollen quality, with adverse effects on pollen development and performance6. Under normal conditions, the layer of nutritive cells between the anther wall and sporogenous tissue (tapetum), transfers nutrients coming from the phloem to the locular fluid, then into pollen microspores13. Heat stress can cause degradation of tapetum cells, altering sequestration of carbohydrates, proteins, lipids, and amino acids in developing microspores6,13,14,15,16. These metabolites are essential for pollen development and functioning and altered concentrations can cause male sterility6,15,16,17. In turn, this can cause reduced fruit set, seed set, and crop yield6. While male gametophyte development is considered the most heat sensitive process in plants, the timing of heat exposure across various developmental stages (i.e., microsporogenesis and microgametogenesis) can influence the severity of damage including changes in pollen nutrient concentration, performance, and fertilization6. Plant species can also vary widely in their sensitivity to extreme heat, yet a limited diversity of crops have been investigated, with a focus on annual crops4,6,17,18despite the potential for greater heat sensitivity in spring-blooming plants, such as perennial fruit crops19.
Northern highbush blueberry (Vaccinium corymbosum L.) is a spring-blooming crop that evolved in regions with cold winters and mild summers20,21. The optimal temperature for growth aligns with historical spring temperatures, between 20 and 25 °C7,21. However, temperate blueberry growing regions have increasingly experienced periods of extreme heat in spring during bud development and bloom. In 2018, temperatures at Michigan blueberry farms exceeded 35 °C for several hours, which was > 20 °C hotter than typical conditions for that region and time of year (Global Historical Climatology Network), followed by a ~ 30% reduction in yield compared to the previous year22. This heat wave occurred over two days when floral bud development ranged from bud swell to anthesis, or approximately 25% bloom (enviroweather.msu.edu). Blueberry pollen exposed to brief extreme heat exposure (37.5 °C for 4 h) can significantly inhibit pollen germination and tube growth in vitro7, which could limit fertilization and berry production, as observed in 2018. As discussed above, heat stress can cause altered or reduced concentrations of metabolites including proteins, carbohydrates, and amino acids, which support pollen development and subsequent functioning, including pollen germination and tube growth. However, no studies have evaluated the consequences of heat stress for blueberry pollen metabolites, which may provide insight into the driving mechanisms of crop loss following periods of heat stress. Additionally, evaluating differences in blueberry pollen nutrition at various floral developmental stages is entirely unexplored, but necessary to help determine when pollen development is most sensitive to extreme heat conditions.
Even less attention has been given to determine how heat stressed pollen affects bee health, despite growing concerns for bee declines as climate change intensifies23. Changes in pollen nutrients following heat stress could adversely affect bee pollinators as pollen provides protein, carbohydrates, lipids, and amino acids necessary for bee development and survival as larvae and adults8,10,13,14,24. Despite this, there is little information on how brief exposure to extreme heat alters the nutritional profile of pollen and the consequences for bees. Nutritional studies suggest that unbalanced pollen diets can alter bee fecundity, foraging, and survival24,25,26,27, with the progeny exhibiting altered development timing, sex ratios, body size, and mortality28,29,30,31. For example, low-protein diets can inhibit ovarian and egg development32,33and diets lacking essential amino acids can cause delayed nest initiation and prevent brood production3,34,35,36. Most studies exploring how different pollen nutrition affects bees have focused on the different nutritional profiles among plant species, often grown under optimal conditions25,37,38,39, and the consequences for social bees. However, 75% of the world’s bee species are solitary40, and many of these taxa, such as Osmia, are exhibiting population declines23,41. Brief extreme heat exposure to host plants, including blueberry and lacy phacelia (Phacelia tanacetifolia) during floral bud development and bloom can have catastrophic consequences for Osmia lignaria, including 70% lower egg production and 60% larval mortality among those that consumed heat stressed pollen12. These results suggest that brief heat exposure may alter pollen nutrition from plants that otherwise are sufficient for supporting bee health. However, it is unclear whether maternal effects could have influenced larval development and survival given that female bees were provided heat stressed host plants upon emergence. The effects of heat stressed pollen diets on brood development and survival, regardless of mother bee health, are largely unknown and require greater exploration.
To understand the underlying mechanisms of short-term extreme heat affecting pollen nutritional content, bee survival, and plant fertilization, we analyzed the metabolite composition of northern highbush blueberry pollen collected from plants exposed to heat stressed (HT: 37.5 °C) or non-stressed (CT: 25 °C) conditions for 4 h at several floral developmental stages. We also fed Osmia lignaria larvae diets of blueberry and phacelia pollen exposed to CT or HT conditions, or a host diet (collected by mother bees), and observed their development and survival as larvae and adults. Lastly, we explored the consequences of heat stress on blueberry fruit production by hand pollinating flowers exposed to HT or CT conditions at various floral developmental stages.
Results
Carbohydrate analysis
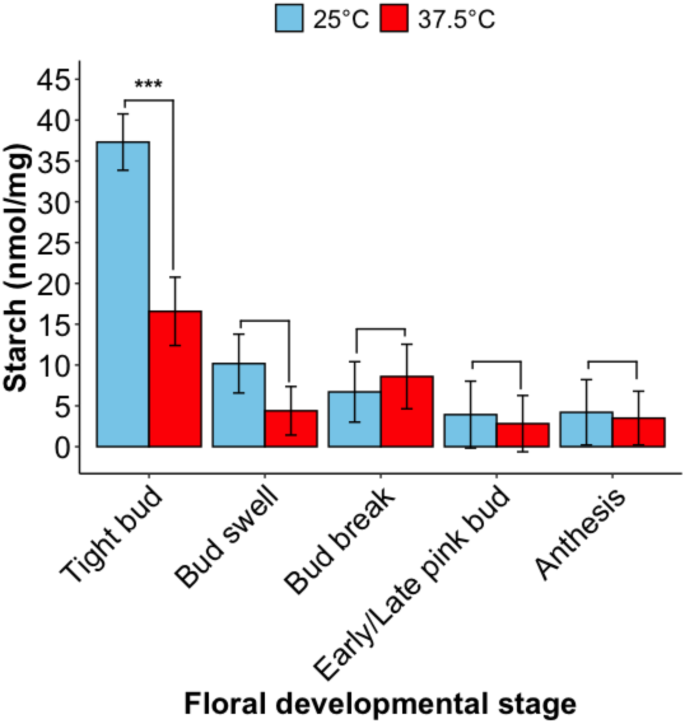
To determine the effect of temperature treatment on pollen carbohydrate composition, starch and soluble sugars (glucose, sucrose) were quantified from pollen grains collected from ‘Bluecrop’ flowers exposed to HT (37.5 °C, 4 h) or CT (25 °C, 4 h) at different floral developmental stages. The starch content of blueberry pollen was significantly affected by temperature treatment at one floral bud developmental stage (Fig. 1: F = 4.24, df = 4, p = 0.003). Exposure to HT at the tight bud stage significantly reduced pollen starch content by 56% compared to CT pollen (t = 4.56, p = 0.0001). At bud swell, pollen starch content was 57% lower in HT pollen compared to CT pollen, but was not statistically significant (t = 1.54, p = 0.14). Across all developmental stages pooled together, exposure to HT reduced pollen starch content by 35% compared CT pollen (CT: 13.24 ± 5.10 nmol/mg versus HT: 8.63 ± 5.05 nmol/mg) (F = 5.59, df = 1, p = 0.02). The soluble sugar content of blueberry pollen was not significantly affected by temperature treatment at any floral bud developmental stage, both for glucose (χ²=7.28, df = 4, p = 0.12) and sucrose (χ²=0.97, df = 4, p = 0.43) (Table 1).

The mean (± SE) starch content of northern highbush blueberry pollen (cv. ‘Bluecrop’) from flowers exposed to either CT (25 °C, 4 h) or HT (37.5 °C, 4 h) at tight bud, bud swell, bud break, early/late pink bud, or anthesis floral bud stages. All pollen was collected at the anthesis stage for metabolite analysis. Significant differences between means (<0.05) are indicated by the asterisks above error bars (*** = p < 0.0001).
Protein analysis
Soluble protein content in blueberry pollen was significantly affected by temperature treatment at one floral developmental stage, but otherwise no significant difference between treatments was found (Fig. 2: F = 1.89, df = 4, p = 0.11). At bud swell, exposure to HT conditions reduced protein content by 22% (t = 2.89, p = 0.006). The total protein content in CT pollen was 160.3 ± 12.6 µg/mg and 124.3 ± 12.2 µg/mg in HT pollen.

Mean (± SE) soluble protein content of northern highbush blueberry (cv. ‘Bluecrop’) pollen from flowers exposed to either CT (25 °C, 4 h) or HT (37.5 °C, 4 h) at tight bud, bud swell, bud break, early/late pink bud, or anthesis developmental stages. All pollen was collected at the anthesis stage for metabolite analysis. Significant differences between means (<0.05) are indicated by the asterisks above error bars (‘**’ = p ≦ 0.01).
Amino acid analysis
The total amino acid content of blueberry pollen was significantly affected by temperature treatment at only one developmental stage (Fig. 3: χ²=15.66, df = 4, p = 0.004). At bud swell, HT conditions significantly reduced total amino acid content in pollen by 35% compared to CT pollen (z=−4.20, p< 0.0001). Essential amino acids, including arginine, histidine, isoleucine, leucine, lysine, methionine, phenylalanine, threonine, tryptophan, and valine are necessary for bee development and survival42, and we found that the HT treatment had no significant effect on total essential amino acid content across all developmental stages (Fig. 4: χ²=5.19, df = 4, p = 0.27). However, HT treatment had a significant effect on total non-essential amino acids at one developmental stage (Fig. 4: χ²=9.54, df = 4, p = 0.05), where exposure to HT at bud swell significantly reduced non-essential amino acids by 38% compared to CT pollen (z=−3.49, p = 0.0005).

Mean (± SE) total amino acid content of northern highbush blueberry pollen (cv. ‘Bluecrop’) from flowers exposed to either CT (25 °C, 4 h) or HT (37.5 °C, 4 h) at tight bud, bud swell, bud break, early/late pink bud, or anthesis developmental stages. All pollen was collected at the anthesis stage for metabolite analysis. Significant differences between means (<0.05) are indicated by the asterisks above error bars (‘***’ = p ≦ 0.0001).

Mean (± SE) essential (left) and non-essential (right) amino acid content in northern highbush blueberry (cv. ‘Bluecrop’) pollen from flowers exposed to either CT (25 °C, 4 h) or HT (37.5 °C, 4 h) at tight bud, bud swell, bud break, early/late pink bud, or anthesis developmental stages. All pollen was collected at the anthesis stage for metabolite analysis. Significant differences between means (<0.05) are indicated by the asterisks above error bars (‘***’ = p ≦ 0.0001).
Temperature exposure had variable effects on levels of specific amino acids across developmental stages (Table S1). At the tight bud stage, temperature treatment had no effect on individual amino acids. At bud swell, HT significantly reduced levels of aspartate, glutamate, methionine, proline, and lysine. At bud break, concentrations of asparagine, glutamate, arginine, lysine, tryptophan, tyrosine, phenylalanine, leucine, and isoleucine were significantly higher in pollen from HT plants. At the early/late pink bud stage, significant reductions in methionine and proline were observed after HT exposure while asparagine, serine, threonine, arginine, lysine, tryptophan, tyrosine, valine, phenylalanine, leucine, isoleucine, and glutamine all increased. Exposure to HT at anthesis significantly reduced glutamine concentrations, whereas it significantly increased glutamate, threonine, proline, arginine, lysine, tryptophan, tyrosine, valine, phenylalanine, cysteine, and isoleucine. Of the 19 amino acids quantified, the top five most abundant in blueberry pollen were proline, aspartate, asparagine, glutamate, and arginine.
Blueberry fruit set
Temperature treatment had a significant effect on fruit set at one developmental stage only (Table 2: χ2 = 12.02, df = 2, p = 0.21). At bud swell, exposure to HT significantly reduced fruit set by 39% (z = 2.32, p = 0.02), where the proportion fruit set for CT plants was 0.95 ± 0.05 compared to 0.58 ± 0.13 for HT plants.
Osmia lignaria development and survival
Pollen diet treatment (CT, HT, or host) had a significant effect on O. lignaria larval survival (Fig. 5: χ²=12.2, df = 2, p = 0.002). Larvae consuming pollen from HT plants were ~ 7 times more likely to die before pupation compared to larvae consuming CT pollen (coef = 1.94, exp(coef) = 6.97, s.e.(coef) = 0.80, z = 2.42, p = 0.02). Larval survival was not significantly different between CT and host pollen diets (coef = 0.51, exp(coef) = 1.67, s.e.(coef) = 0.92, z = 0.56, p = 0.58). The probability of larval survival at various developmental stages was also significantly affected by diet treatment (Figure S1: χ²=49.67, df = 2, p < 0.001). Larvae consuming HT pollen had a significant reduction in survival at cocoon spinning and fully spun cocoon stages, compared to those consuming a CT diet (z = 2.58, p = 0.03) and Host diet (z = 2.43, p = 0.04). The probability of larval survival at both cocoon spinning and fully spun cocoon stages was 0.89 ± 0.09 (CT), 0.87 ± 0.11 (Host), and 0.39 ± 0.20 (HT), resulting in a 56% and 55% reduction in larval survival for the HT diet group compared CT and Host diets, respectively. Across all developmental stages, no significant difference in larval survival was observed between CT and Host pollen diets. Larval developmental stage (egg/1st instar-fully spun cocoon) and pollen diet treatment had a significant effect on development duration (χ²=1996.9, df = 2, p < 0.001), but temperature treatment of diet pollen (CT or HT) had no significant effect on larval development timing at any stage (z = -1.94-1.49, p = 0.13-0.97). Diet treatment also had no significant effect on adult emergence timing, for male and female bees (χ²=0.009, df = 2, p = 0.92). Among the emerged females, the time to emergence was 21.46 ± 1.77 days (CT), 24.86 ± 2.57 days (HT), and 25.60 ± 1.95 days (Host). No male brood emerged from the HT diet, but those that consumed CT diet took 9.22 ± 1.49 days to emerge and those that consumed a Host diet took 11.29 ± 1.93 days to emerge. Adult longevity was also not significantly affected by diet type (χ²=0.40, df = 2, p = 0.53), where temperature treatment of diet pollen (CT or HT) had no significant effect on adult longevity for female brood (z=-1.64-1.75, p = 0.19-0.23) and no male brood survived to adulthood among the HT diet group.

Kaplan-Meier survival probability curve of Osmia lignaria larvae fed with pollen collected by mother bees (Host) or fed with pollen diets collected from plants (blueberry and phacelia) exposed to control temperature conditions (25 °C, 4 h) or heat stressed conditions (37.5 °C, 4 h).
Discussion
Nutrient rich pollen is required to support fertilization in plants and meet the dietary needs of insect pollinators3,13. Most studies have focused on the direct consequences of heat stress on plants or bees, but few have explored the indirect consequences of extreme heat on pollination systems8. In this study, we quantified the nutritional content of northern highbush blueberry pollen to assess the role of heat stress on pollen nutrition and the down-stream consequences for blueberry fertilization and native bee development and survival. We found that the sensitivity, or resilience, to extreme heat differed across blueberry floral developmental stages and metabolites. For example, at bud swell, lower concentrations of pollen protein, total amino acids, and several individual amino acids were observed following heat stress. Reductions in pollen starch (tight bud) and several individual amino acids (early/late pink bud and anthesis) were also observed following heat stress, suggesting potential consequences for plant fertilization and bee diet quality. Other amino acids increased following heat stress (bud break, early/late pink bud, anthesis), with possible resilience for fertilization but potentially negative effects for bee health. Validating these findings, 57% of Osmia lignaria larvae that consumed pollen from heat stressed plants died before pupation and no male progeny survived to adulthood. Blueberry fertilization was also reduced following brief heat stress, as indicated by 39% lower fruit set following exposure to extreme heat at bud swell. Overall, this study provides evidence for a nutritional mechanism through which extreme heat stress affects blueberry pollinators and fertilization and highlights the importance of interdisciplinary studies for uncovering the consequences of extreme heat in pollination systems.
Consequences of heat stress on pollen development, functioning, and fertilization
At tight bud, exposure to four hours of extreme heat reduced pollen starch levels by 56%, yet no other metabolite assessed was significantly affected by heat, suggesting intermediate heat tolerance at this blueberry floral stage. Reduced starch concentrations but unchanged sucrose concentrations in pollen from plants exposed to heat at tight bud could indicate disruptions in sugar metabolism rather than transport processes13,43, but further testing is required to confirm this. Reductions in pollen starch content following heat stress at tight bud could have adverse effects for subsequent flower development44and mitigating abiotic stress45,46. Despite the lower concentration of starch observed at tight bud following heat exposure, starch levels were still higher at this stage than the other developmental stages, regardless of temperature exposure. It is unclear why starch content was higher compared to latter developmental stages, given that all pollen assessed in this study was collected at the anthesis stage. During normal pollen development the peak of starch accumulation occurs at the bicellular pollen stage17 and goes down as pollen matures. Nonetheless, our findings suggest that starch concentrations were sufficient to support pollen development and subsequent metabolism and germination, regardless of heat exposure, given that fruit set was unaffected by heat stress at tight bud. Future studies should determine the pollen developmental stage occurring during tight bud in this crop and further explore how temperature conditions affect pollen and pollination, particularly under prolonged periods (> 4 h) or repeated exposure of extreme heat.
Soon after tight bud, blueberry floral buds transition into bud swell where previously dormant microspore mother cells (MMC) are likely undergoing meiosis47. This stage is considered tolerant to cold temperatures20, yet no studies have investigated heat tolerance in blueberries at this developmental stage. We found that bud swell had substantial sensitivity to heat stress, showing reductions in pollen protein, total amino acids, several individual amino acids, and proportion of fruit set. In other plants, extreme heat during MMC meiosis can result in premature degradation of tapetal cells, altered amino acid biosynthesis, inhibited nitrogen assimilation, reduced protein quality, and pollen sterility6,13,17,48. The reductions in specific pollen metabolites following heat stress at bud swell are similar to other crops45,48,49,50,51,52,53,54,55,56,57,58, showing that MMC meiosis is a critical time for nutrient metabolism and partitioning, with important consequences for pollen development and performance6. We also found that proline was significantly reduced following heat stress at bud swell, and proline is an important amino acid required for pollen development and fertility59,60,61. During normal development, proline helps prevent protein denaturation, protects cellular structures, and provides energy for pollen tube growth5,60,62. Glutamate, an amino acid that plays a central role in plant nitrogen metabolism63, was also significantly reduced following heat stress at bud swell. Glutamate is a precursor for proline, arginine, asparagine, and GABA synthesis in plants, all of which play important roles in response to heat shock60,63. The glutamate derivative GABA plays an important role in pollen tube growth and guidance60,64, therefore reductions in glutamate following heat stress could have negative effects on pollen germination, pollen tube growth, and fertilization. Significant reductions in methionine were also observed at bud swell following heat stress; since this amino acid is a precursor for ethylene production in plants65, this reduction could have negative repercussions for heat tolerance, pollen quality, and pollen performance5,18,66. Aspartate was also significantly reduced following heat stress at bud swell and is central to plant nutrition and stress responses67, and is a precursor for many other amino acids67,68,69. Changes in pollen aspartate levels following heat stress could affect downstream processes, including glycolysis and the TCA cycle67, with negative consequences for pollen maturation and pollen tube growth68,70,71. Lysine, which plays an important role in the TCA cycle, abiotic and biotic stress responses in plants and starch metabolism72,73, was also significantly reduced following heat stress at bud swell, and may have contributed to observed trends of reduced pollen starch content. Overall, these findings indicate that bud swell in northern highbush blueberry is highly sensitive to brief exposure of extreme heat with negative consequences on pollen quality, performance, and subsequent fruit production.
Our results suggest the bud break stage, when flowers begin to differentiate between bud scales, has some resilience to heat stress. Starch, sucrose, and glucose levels were relatively unchanged by extreme heat at this stage, so it is unlikely that heat induced any substantial changes in sugar-starch utilization, metabolism, or transport at bud break6. Protein levels were also not significantly affected by heat stress at bud break. Higher levels of asparagine and glutamate also suggest pollen heat tolerance at bud break as these amino acids play an important role in heat shock response60,63. Data in the present study support this, as exposure to heat stress at bud break had no significant effect on fruit set. At the early/late pink bud stage, when floral corollas become visible as the stamen elongates, the lower methionine and proline concentrations following heat stress exposure may have adverse effects for pollen development and performance5,18,59,60,61,62,66,74. However, several other amino acids increased at this stage, potentially aiding in thermotolerance as suggested by the lack of effect on fruit set. At anthesis (i.e., flower opening), blueberry pollen microspores have matured into pollen grains and are prepared for dehiscence and dispersal by a pollinator. In this study, exposure to extreme heat for 4 h at anthesis had no significant effect on pollen protein or carbohydrate content, and several amino acids, such as glutamate and proline, significantly increased. However, glutamine concentrations were significantly reduced following heat stress at anthesis and may play an important role in pollen functioning75,76. While fruit set was not assessed for the anthesis developmental stage in this report, a previous study7 found that ‘Bluecrop’ pollen exposed to 37.5 °C for 4 h in vitro significantly inhibited pollen tube growth (74%) and pollen germination (39%) compared to pollen exposed to 30 °C. Given most of the pollen nutrients from the anthesis stage were unaffected by heat stress, yet pollen viability was substantially reduced by heat stress in vitro, it is clear that further research is needed to assess the effect of heat stress at this developmental stage.
Consequences of heat stress on pollen nutrient quality and bee nutrition
As a primary diet source for bees3,24,77,78, unbalanced pollen nutrient composition can hinder bee development, fecundity, resilience to stress, and survival3,25,26,27,29,30,79. Bees are particularly sensitive to altered pollen nutrition, either in excess or deficiencies, given their high metabolic activity and low energy stores that ultimately requires a well-balanced diet for proper development and functioning24,80,81. In a recent study, O. lignaria females were provided blueberry, phacelia, and clover plants exposed to extreme heat (37.5 °C, 4 h) or non-stressed (25 °C, 4 h) conditions at 25% bloom, exposing a range of floral buds from bud swell to anthesis12. Female bees provided plants exposed to extreme heat laid 70% fewer eggs compared to those provided non-stressed host plants, and 60% of the developing larvae died before completing development. In that study12, female Osmia bees only had access to heat stressed or non-stressed plants in field cages, so the altered nutritional content of heat stressed pollen diets could have had affected oocyte development and egg quality82, which could have consequences for brood development and survival. In the present study, we removed any potential maternal effects by providing Osmia lignaria larvae the same amount of pollen diet, collected from plants exposed to heat stressed or non-stressed conditions, or a host pollen diet collected from mother bees. While larvae provided non-stressed or host pollen diets experienced similarly high survival rates, O. lignaria larvae consuming pollen from heat stressed plants experienced significant reductions in larval survival, particularly at later developmental stages (i.e., cocoon spinning) as brood prepare for metamorphosis and winter dormancy. It is also important to note that in Walters et al. (2024) and the present study, all adult bees and developing brood were reared under the same optimal conditions, amplifying the role of a heat stressed pollen diet on bee health and performance.
While nectar is often considered the main source of carbohydrates for bees, pollen carbohydrates provide energy needed for the biosynthesis of proteins, tissues, and enzymes necessary for bee development and survival83,84. Pollen carbohydrate content is particularly important for solitary bees, such as Osmia85, given their larval pollen provisions are comprised of mostly pollen and a small amount of nectar. As such, carbohydrates may be limited in solitary bee provisions3,85. Previous studies indicate that carbohydrates have a stronger effect on Osmia larval growth, development, and survival to pupation than protein85,86, and Osmia prefer “starchy pollen”83,87. In the present study, a significant reduction in pollen starch content (35%) was observed following extreme heat stress across all blueberry floral developmental stages, which could adversely affect pollen digestion and bee nutrition in several ways. For instance, the outer exine layer of pollen is indigestible to bees3,83, so disturbance (like germination) is needed to allow the release and extraction of nutrients3. Failure of germination, either before or during digestion, may inhibit starch depolymerization and limit bees’ access to digestible sugars, amongst other nutrients83. Walters and Isaacs (2023) revealed significant reductions in pollen germination and tube growth in ‘Bluecrop’ pollen exposed to extreme heat, which could limit bee digestion and their capacity to access nutrition3,83. Additionally, while pollen soluble sugar concentrations (sucrose, glucose) were not significantly affected by heat exposure in the present study, the starch depolymerization and digestive process previously described suggests that lower pollen starch content could also inhibit bees access to digestible, soluble sugars. Thus, exposure to heat stress may inhibit the total nutrient supply available in pollen and impede processes necessary for pollen digestion and nutrient uptake. Additionally, the reduced pollen protein levels observed following extreme heat exposure is likely a key driver of the 70% reduction in egg laying observed in O. lignaria bees reported by Walters et al. (2024)12, given that egg-laying female bees require a sufficient protein diet to properly develop their ovaries and eggs32,33,82,88. Future studies are needed to study oocyte maturation and ovary size after feeding on heat stressed pollen to confirm this in Osmia bees and other bee taxa. Pollen protein content is also important for larval development3,89, where previous work reports that transplanted O. lignaria eggs only survived on the richest protein diets to support development to adulthood89. In this context, it is likely that the substantial reductions in Osmia larval survival reported in this study and by Walters et al. (2024) was caused by a combination of altered pollen nutrient availability and poor pollen digestion following plant exposure to extreme heat.
Amino acids are crucial for bee growth, somatic maintenance, reproduction, and longevity36,38,77,90, and solitary bees like Osmia bicornis and O. cornuta struggle to develop on diets with low total amino acids36. The heat-induced changes in pollen amino acid content may have contributed to reduced O. lignaria survival in present and previous studies12. However, we recognize that the total amino acid content from non-stressed (i.e., control) plants at bud swell was higher than non-stressed pollen at other developmental stages. It is unclear why total amino acid levels were higher in the bud swell control group given that all pollen was collected at anthesis, and may require additional assessments. Some researchers have hypothesized that the consequences of altered amino acid diets on bee fitness is contingent on the concentration and/or ratio of individual amino acids present in the diet, as certain amino acids (or interactions between amino acids) could result in toxic side effects or impair certain physiological processes91,92,93,94. This aligns with the present and previous studies12, where extreme heat exposure increased certain essential and non-essential amino acids, yet O. lignaria larvae fed pollen from heat stressed blueberry plants experienced significantly higher mortality rates. It is possible that altered concentrations of amino acids contributed to nutrient imbalance, contributing to bee mortality. Delineating the concentrations and combinations of individual amino acids that may impair (or improve) bee functioning and survival has received little attention, particularly for solitary bees, and requires further research. Thus, reports from other well-studied insect taxa such as Drosophila flies may provide insights for this research direction. For instance, Grandison et al. (2009) compared the lifespan and fecundity of Drosophila under different amino acid diets and found that methionine was important for fecundity and egg quality. Under restricted diets devoid of all essential amino acids except methionine, Drosophila fecundity increased and was even comparable to unrestricted diets where all essential amino acids were present91. In the present study, methionine was significantly reduced in blueberry pollen following heat stress at bud swell and early/late pink bud and was one of the least abundant amino acids present in the pollen samples. Therefore, exposure to extreme heat may exacerbate already low concentrations of methionine, amplifying heat-induced nutrient imbalances for bees. Furthermore, other studies have found that restricting levels of leucine, isoleucine, and valine in Drosophila diets can extend longevity and induce stress resistance95,96. In the present study, blueberry plants exposed to heat stress at various developmental stages had significantly higher levels of isoleucine, leucine, and valine in pollen. While all these amino acids are considered essential for bees, it is possible that increases in these amino acids, along with reductions in other amino acids, resulted in nutritional imbalance following heat stress. Our results highlight that greater exploration of the amino acid-bee development link is needed to further elucidate mechanisms connecting heat extremes to effects on egg laying and survival in O. lignaria. Development of an artificial diet system for Osmia larvae, similar to previously described methods91, could facilitate exploration of how specific amino acid nutrient ratios influence bee development and survival.
This research is among the first to examine how brief extreme heat exposure during floral development affects the nutritional content of pollen and the downstream consequences on the pollination system. Altered concentrations of blueberry pollen protein, starch, total amino acids and several individual amino acids were found following heat stress, which likely contributed to lower pollen germination and tube growth7, and in turn, reduced blueberry fruit set. The effects were dependent on crop growth stage, highlighting the importance of pollen developmental stage in how the effects on extreme heat are expressed. The changed composition of blueberry pollen following heat stress also made it less nutritionally suitable for O. lignaria bees, contributing to reduced female fecundity and higher larval mortality rates12. Our results suggest that studies evaluating the effects of direct heat stress for plants or bees may underestimate the consequences of climate change on bee-plant interactions and future crop production. Broadening our understanding from direct, isolated stressors to indirect and interactive stressors is important for understanding how climate change is affecting pollination systems and emphasizes the important role of pollen nutrition. An additional implication of this research is that mitigation strategies are needed to protect the nutritional content of pollen under extreme heat conditions, to protect plant pollination and the pollinators that are essential to support crop yields.
Materials and methods
Plant material and maintenance
Dormant 2-year-old northern highbush blueberry ‘Bluecrop’ bushes were purchased in late winter in 2021 and 2022 (Hartmann Nursery, Grand Junction, Michigan and DeGrandchamp Farms, South Haven, Michigan). ‘Bluecrop’ was selected as it is the mostly widely grown blueberry cultivar in Michigan97and was used in related studies7,12. The bushes were immediately placed in dark cold storage (MSU Horticultural Teaching and Research Center, Holt, Michigan) at 2 °C until at least 1200 chilling hours had been accumulated. Thereafter, bushes were moved from cold storage into the MSU greenhouses (East Lansing, MI) as needed for experiments, maintained at 22 ± 5 °C and 16 h photoperiod. Plants were watered regularly, and soil pH was monitored every 3–4 weeks to ensure it remained < 6.0. When necessary, bushes were treated with Jobe’s Organics soil acidifier (calcium sulfate (80%), sulphur (18%), and bentonite clay (2%), Easy Gardener Products, Inc., Waco, Texas) according to the manufacturer’s label. Osmocote Smart-Release Plant Food Flower and Vegetable (nitrogen (14%), available phosphate (14%), soluble potash (14%), The Scotts Company, Marysville, Ohio) granules were also added to potted blueberry bushes following the manufacturer’s label.
Blueberry temperature treatments
Following placement in the greenhouse, blueberry bushes were randomly assigned to either a control (CT: 25 °C for 4 h) or high temperature (HT: 37.5 °C for 4 h) treatment. The temperature for the HT regime reflected recently experienced extreme heat events where daily maximum temperatures exceeded 35 °C for 4 h during blueberry bloom (Global Historical Climatology Network) and aligned with recent, related studies7,12. Prior to exposure, ‘Bluecrop’ bushes were randomly assigned to a floral developmental stage, including tight bud, bud swell, bud break, early pink bud/late pink bud, or anthesis (Figure S2). The bushes were monitored daily to assess development, ensuring the correct floral developmental stage was exposed. Using colored twist ties, individual floral buds were identified and marked prior to exposure, where twist ties were loosely (but securely) wrapped around the shoot just below a given floral bud targeted for treatment. Once bushes reached the targeted developmental stage, ‘Bluecrop’ plants were taken from the greenhouse and exposed to temperature treatments using environmental growth chambers (Darwin Chambers, St. Louis, MO) set to CT and HT conditions (60 ± 5% relative humidity), and temperatures were monitored every 30 min using HOBO temperature loggers (Onset Computer Corporation, Bourne, MA). Plants were assigned in pairs such that multiple plants received the HT or CT treatment at the same time in each chamber. Following temperature treatment, the bushes were immediately returned to the greenhouse and maintained under the conditions described above.
Pollen collection and sample preparation for biochemical assays
Pollen grains were collected at the anthesis stage regardless of when temperature treatments (CT or HT) occurred during floral development. To ensure that the pollen and flowers used for experiments were fresh (within 24 h of anthesis), open flowers on each bush were marked by lightly dotting the corolla with a permanent marker98. Thus, the following day, any open flower without a mark had been open for less than 24 h. Pollen was released from the blueberry flower anthers by touching a vibrating sonication tool (AeroGarden, Boulder, Colorado) onto the outside of the corolla, collecting pollen into a 1.5 mL microcentrifuge tube (hereafter referred to as vial), allowing pollen to accumulate at the bottom of the vial. Each vial contained pollen from a single collection date, blueberry bush, and developmental stage. Fresh pollen weight was measured using a precision balance by taking an ‘empty’ weight of 1.5 mL centrifuge tube vial (prior to collection) and a ‘filled’ tube weight (after collection), with the difference providing the fresh pollen weight. The number of flowers, as well as the location on the bush canopy from which flowers were collected (e.g., top, mid, low), was also recorded and can be found in data files available at FigShare (https://doi.org/10.6084/m9.figshare.27948096.v1). After collection, vials containing pollen grains were stored in a −80 °C freezer until ready for analysis. Across all developmental stages and temperature treatments, pollen was collected from 434 blueberry bushes.
To prepare samples for biochemical assays, vials with pollen were removed from the − 80 °C freezer in small batches for short durations (10 min or less) to combine pollen from separate vials into new 2 mL conical flat bottom microcentrifuge tubes (Fisherbrand™ Premium Microcentrifuge 2.0 mL tubes, Waltham, MA, USA). For each biochemical assay, pollen was weighed and combined (within a given temperature treatment and developmental stage) to meet the pollen weight needed for each method. With the exception of the tight bud stage, six replicates were prepared for both temperature treatments (CT, HT) across all blueberry floral bud developmental stages where pollen amounts per sample ranged from 5 to 16 mg for the protein assay, 8–15 mg for the carbohydrate assay, and 5–12 mg for the amino acids assay. Pollen was limited at the tight bud developmental stage and thus received less pollen (1–7 mg) and fewer replicates (4) across all metabolite assays. Differences in pollen weights did not affect the quality of the assays, and variation in weight per replicate was accounted for in the final measurement calculations across all assays performed. Immediately after pollen was combined into the tubes, samples were placed back in the − 80 °C freezer until they were ready for metabolite extraction.
Carbohydrate extraction and biochemical assay
Sucrose, glucose, and starch extractions and assays were adapted99 to accommodate small amounts of sample. To prepare for grinding frozen pollen samples, each centrifuge vial had a sanitized 2 mm stainless steel ball (Thermo Scientific, Waltham, MA, USA) added to the pre-weighed pollen sample. Sample vials were placed in a mill block and placed back in a −80 °C freezer for 5 min. The block containing pollen samples was placed in a Retsch MM 301 vibratory mill (Verder Scientific Inc., Newton, PA) and milled twice, each for 1 min at 30 Hz (e.g., 30.0 1/s). Pollen samples were milled to open pollen exine walls to ensure pollen metabolites were available for bioassays. Immediately after grinding pollen samples, vials were placed in ice. Then, 300 µL of chilled 3.5% (v/v) perchloric acid was added to each sample and vortexed for ~ 5 s, then placed back on ice for 5 min to incubate. After incubation, samples were centrifuged in a pre-chilled (4 °C) Eppendorf 5417R Refrigerated Centrifuge (Eppendorf North America, Inc. Westbury, NY, USA) for 10 min at 20,817 RCF (i.e., 14,000 RPM). After centrifuging, vials contained liquid (i.e., supernatant) and a condensed pellet of pollen at the bottom of the vial. In a new 1.5 mL microcentrifuge vial, 200 µL of supernatant was transferred and used for glucose and sucrose assays. In the vials still containing pollen pellets, 850 µL of 80% ethanol was added to each vial, then placed in the − 80 °C freezer and were used the following day for starch extraction. For glucose and sucrose extractions, 70 µL of neutralizing buffer (2 M KOH, 150 mM HEPES, 10 mM KCl, 250 mL milli-Q water) was added to each vial, raising the sample pH close to 7.0, and vortexed for 5 s. Samples were then placed in a pre-chilled centrifuge (4 °C) for 2 min at 20,817 RCF. From these vials, 200 µL of supernatant was aliquoted to a new 1.5 mL centrifuge vial and immediately stored in the − 80 °C freezer until ready for the soluble sugars (glucose, sucrose) assay.
For starch extraction, vials previously placed in −80 °C freezer with 80% ethanol were removed from the freezer and vortexed for ~ 15 s. The vials were then centrifuged at 4 °C and 20,817 RCF for 5 min. The ethanol supernatant was then removed by pipetting. This step was repeated (add 80% ethanol, vortex, centrifuge, discard ethanol) twice, then placed in a 70 °C dri-bath for 1–2 min to dry out any remaining ethanol. After drying, 250 µL of 0.2 M KOH was added to each vial and vortexed for ~ 5 s to resuspend the pollen pellet in KOH solution. The samples were then placed in a preheated dri-block set to 95 °C and incubated for 30 min. The samples were then allowed to cool for 2–5 min at room temperature, then 45 µL of 1 M acetic acid was dispensed to each tube and vortexed for 5 s. An enzyme cocktail was prepared containing 2 µL amyloglucosidase stock (Megazyme, Catalog No. E-AMGDF-40ML) and 50 µL ⍺-amylase stock (Megazyme, Catalog No. E-ANAAM). To make this enzyme cocktail, we combined 2 µL amyloglucosidase stock and 50 µL ⍺-amylase stock multiplied by the number of samples (and an extra 5 µL to account for potential pipette error), resulting in 130 µL of amyloglucosidase stock and 3,250 µL of ⍺-amylase stock dispensed into a sterile 15 mL vial. Then, 52 µL of the enzyme cocktail was dispensed into each sample vial and vortexed for ~ 5 s. The vials containing starch extractions were then set in tube racks and placed on an orbital shaker (VWR, Radnor, PA) set to 20 °C at 20 RPM for 48 h to allow enzymatic digestion of starch.
For the carbohydrate measurements, an NADPH-linked protocol100 was used. Soluble sugars (glucose, sucrose) were measured by adding 5 µL of the sugar extracts to a clear, 96-well acrylic plate. Using a multi-channel pipette, 195 µL of enzyme assay solution (150 mM HEPES buffer (pH 7.2), 50 mM NADP, 50 mM ATP, 0.25 U/µL G6PDH) was added to each well. The 96-well plate was then placed in a microplate reader (FilterMax F5 Multi-Mode microplate reader, Molecular Devices LLC, San Jose, CA) where endpoint absorbances at 340 nm were measured and then logged by SoftMax® Pro plate reader software (Molecular Devices LLC, San Jose, CA). After reading a stable baseline, the reaction was activated by adding 5 µL of hexokinase (HXK) enzyme to each well and a kinetic measurement assay (λ = 340 nm) was started until the absorbances stabilized. Although the setting was labeled “Kinetic” the assay was an end point assay since the change in absorbance was only observed to identify when the reaction stabilizes before logging the absorbance data. The resulting absorbances were then used to calculate the glucose concentration. For sucrose determination, 10 µL of invertase (INV) was added to each well and the plate was incubated at 37 °C for 30 min, after incubation an end-point assay was started (λ = 340 nm). The absorbances were then used for sucrose calculations. The same 96-well plate was used for glucose and sucrose assays. For the starch assay, 5 µL of starch extracts and 195 µL of assay solution (see above) were pipetted into a fresh 96-well acrylic plate and a kinetic assay was started until a stable baseline was achieved. Invertase (10 µL) was then added, and the samples incubated at 37 °C for 1 h to break down any remaining sucrose before starting the kinetic assay at 340 nm. The absorbance data from these assays were then used to calculate the molar concentration using the following formula:
Molar concentration = (ΔAbsorbance ÷ 6220) ÷ (0.003 * total volume of solution in the well in µL) * 240e-6 ÷ 5e-6.
Where 6220 is the extinction coefficient of NADPH at 340 nm, 0.003 is the multiplication factor to calculate path length in a standard 96-well plate, 240e-6 is the volume of the well in Liters, and 5e-6 is the sample volume in Liters. Molar concentration was then converted to moles per sample and accounting for sample volumes and pollen weights, concentrations in nmol/mg (sugars) or nmol/mg (starch) was calculated. Finally, the units were converted to µg/mg for reporting sucrose and glucose.
Protein extraction and biochemical assay
Methods for protein extraction from pollen were adapted for small samples from an existing protocol101. Breaking open pollen samples for protein extraction via Restch mill followed the same protocol described above. Chilled protein extraction buffer (50 mM HEPES, 5 mM MgCl2, 1 mM EDTA, 10% [v/v] glycerol, 50 mL Milli-Q water, pH 7.5) was added to each pollen sample, with 200 µL extraction buffer added per vial. Milled pollen samples suspended in the extraction buffer were vortexed for 10 s, then shaken for 10 s, and immediately placed back on ice. These vials were then placed in a pre-chilled (4 °C) Eppendorf 5417R Refrigerated Centrifuge (Eppendorf North America, Inc. Westbury, NY, USA) run at 20,817 RCF for 10 min. After centrifugation, 150 µL of the supernatant was transferred to a new 2.0 mL microcentrifuge vial. If disturbed, pollen vials were run for another 10 min in the centrifuge, as described above. Vials with the pollen protein extracts were placed back in the − 80 °C freezer until biochemical assays.
Total soluble protein quantification was conducted using a NanoOrange®Protein Quantitation Kit (Invitrogen, Ltd., Paisley PA4 9RF, UK), where bovine serum albumin (BSA) was used as the protein standard. This assay provides highly accurate detections of total soluble proteins with improved sensitivity compared to the more common absorption-based protein solution assays102 and does not require large amounts of pollen for assessments. Minimizing the amount of pollen required for the assay is crucial given the time and labor limitations involved in pollen collection from blueberry and allowed for a more robust statistical analysis by increasing the number of replications. The protein assay was performed following the manufacturer’s instructions. Briefly, the protein quantitation diluent was prepared along with the BSA standard solution (provided in the kit). Using the 2 µg/mL BSA stock solution, 0, 0.6, 0.8, 1, 3, 6, and 10 µg/mL BSA were prepared. Both protein quantitation diluent and protein standard curve solutions were made immediately before the assays. Protein extract samples were then taken out of the − 80 °C freezer and thawed on ice. Once thawed, vials were vortexed for ~ 30 s then placed in a pre-chilled centrifuge (4 °C, 20,817 RCF) for 5 min and then placed on ice immediately. From each sample, 10 µL of supernatant was moved into a new 2.0 mL centrifuge vial and 490 µL of chilled protein extraction buffer (described above) was added producing a 1:50 protein sample dilution.
For the assay reaction, 5 µL of the 1:50 diluted protein sample was dispensed into a new 2.0 mL microcentrifuge vial along with 205 µL of the NanoOrange® solution then vortexed for ~ 5 s. Vials containing the standard curve and pollen samples were incubated on an aluminum block pre-heated to 95 °C for 10 min and covered with aluminum foil to protect samples from light. Another aluminum block was then set on top of the vials to prevent the lids from opening. After incubation, the samples and standard solutions were transferred to a tube rack and left to cool at room temperature for 20 min and covered with an aluminum sheet to protect them from light. After cooling down, vials were placed in a pre-chilled centrifuge (4 °C, 13,000 RCF) for 1 min. Exactly 200 µL of standard curve solutions and diluted pollen protein extracts were transferred to a black, flat-bottom 96-well plate and loaded into a microplate reader (FilterMax F5 Multi-Mode microplate reader, Molecular Devices LLC, San Jose, CA) controlled by the SoftMax® Pro plate reader software (Molecular Devices LLC, San Jose, CA). The excitation wavelength was set at 485 nm and emission at 595 nm. Fluorescence measurements of the standard solutions were then plotted against their BSA concentrations (0–10 µg/mL) to create a standard curve and was then used to calculate the total soluble protein concentrations of pollen samples. Considering the dilution, sample volume used and the original extract volume, the final total soluble protein was then calculated and expressed in µg/mg pollen.
Amino acid extraction and biochemical assay
Free amino acids extraction and assay was performed following the protocol by the Michigan State University Mass Spectrometry and Metabolomics Core (MSMC) (Protocol MSMC-002 version 1.1). The amino acid internal standards 13C, 15N stable isotope-labeled amino acid internal standards) were provided by the MSMC and also served as the extraction buffer. To prepare the internal standards, pelletized labeled amino acids was resuspended in 1 mL sterile Milli-Q water for a 1000X strength and the extraction buffer and was prepared at 1X strength. Breaking open pollen samples for amino acid extraction via Restch mill followed the same protocol provided above. After milling, 400 µL of extraction solvent was added to each sample, vortexed for ~ 3 s, then incubated in a dri-bath at 90 °C for 5 min. Samples were left to cool on ice for ~ 1 min before centrifugation at 13,000 RCF and 4 °C for 10 min. After, 100 µL of supernatant was dispensed into a new 1.5 mL vial. The supernatant was mixed with an equal volume of 10 mM PFHA, then vortexed for ~ 3 s until homogenized. The samples were again centrifuged (13,000 RCF at 4 °C) for 5 min, then placed on ice. In glass inserts placed inside a Liquid Chromatography (LC) autosampler vials, 200 µL of amino acid extract was dispensed and capped, then stored in the − 80 °C freezer until ready for amino acids quantification using UPLC- MS/MS Waters Xevo TQ-S Micro tandem MS (Mildford, MA) operated in a positive model with an electrospray ionization (ESI) interface in the MSU MSMC facility. Reagent blanks were also prepared in LC autosampler vials, including Milli-Q.
Standard curve vials were positioned on the carousel before and after the amino acid samples. For the standard curve, ½ serial dilutions of unlabeled amino acids prepared with 20 mM PFHA in water at 50 µM, 12.5 µM, 3.13 µM, 0.78 µM, 0.195 µM, 0.049 µM, and 0.012 µM concentrations were prepared. The protocol allowed for the assessment of 19 amino acids including arginine, histidine, isoleucine, leucine, lysine, methionine, phenylalanine, threonine, tryptophan, valine, alanine, asparagine, aspartate, cysteine, glutamate, glutamine, proline, serine, and tyrosine. The individual amino acid concentrations were quantified by the MassLynx Mass Spectrometry Software (Waters Corporation, Milford, MA). The calculated amino acid concentrations (µM) were then converted to a final unit of µg/mg.
Effects of extreme heat on blueberry fruit set
‘Bluecrop’ bushes were exposed at several floral bud developmental stages, including tight bud, bud swell, bud break, early pink bud, or late pink bud growth stages to CT (25 °C, 4 h) or HT (37.5 °C, 4 h) conditions. Following placement in the greenhouse, bushes were randomly assigned to a developmental stage and temperature treatment. Blueberry bushes were monitored daily to assess floral bud development, ensuring plants were exposed at the correct time. For each developmental stage, we used 12 bushes, with six bushes exposed to CT conditions and six exposed to HT conditions. Floral developmental stages on bushes were marked and monitoring using colored twist ties, as described above. From the floral buds selected for treatment, colored twist ties were again used to randomly assign floral buds to be hand pollinated or to be a pollen donor. At least six floral bud locations were selected per bush, where three floral buds were randomly assigned to be pollinated or to be a pollen donor. Across all bushes and developmental stages, we selected apical buds for treatments as the number of flowers found in inflorescence buds is negatively correlated with distance from shoot tip103. From each selected floral bud, several flowers developed, but only 2–3 flowers were kept per location for pollination treatments, typically resulting in six flowers to be pollinated and six flowers used to collect pollen for donor pollen (i.e., typically 12 total flowers per plant). However, depending on flower health and availability, as few as four and as many as 13 flowers were used per plant for each pollination treatment. Flowers considered unhealthy or showing signs of disease were excluded from the experiment. In some cases, entire bushes were excluded from analysis if they showed significant signs of disease.
Flowers assigned to be pollen donors were used to collect pollen from flowers on the same plant as those to be pollinated. Thus, the donor and recipient flowers experienced the same temperature treatment at the same developmental stage, and all flowers in this study were self-pollinated. Pollen was collected from at least the same number of flowers being hand-pollinated, ensuring sufficient pollen available to saturate floral stigmas for optimal fertilization. Monitoring flower age to ensure fresh pollen was used (within 24 h of anthesis) and pollen collection follows the same methods described in previous sections. Flowers were self-pollinated by dipping the end of a fine, clean paint brush in the microcentrifuge vial containing the recently collected donor pollen and lightly touching it to the surface of the flower stigma until there was an even layer of pollen saturating the stigma. Hand-pollination flowers were bagged using small, white mesh jewelry bags which remained until fruit collection. Bagging flowers helped ensure that no cross contamination or additional pollination could occur while flowers and berries developed in the greenhouse. Once all flowers were treated, identified, and bagged, all other flowers and flower buds were removed from the whole bush. Flowers not used for treatments were removed to provide maximum resource allocation for the experimental flowers and subsequent berries.
Blueberry bushes were maintained in the greenhouse throughout berry development and ripening under optimal conditions (22 ± 5 °C, 16:8 L: D). Treated flowers were checked daily to monitor ovary swelling (indicating fruit growth or flower abortion), green fruit growth, and timing of berry color change (from pink to blue). Green berries, aborted flowers, and small, dried berries with no juice or flesh were excluded from fruit set analyses, as these are not considered marketable fruit. Flowers were considered to have successfully set fruit if the berries turned 100% blue. The proportion fruit set was determined by dividing the number of berries developed by the number of flowers hand pollinated.
Effects of extreme heat on Osmia lignaria development and survival
In this experiment, we minimized maternal effects by equally distributing Osmia larvae to CT, HT, or Host (i.e., mother bee collected) pollen diets. Pollen used for larval bee diets was collected from ‘Bluecrop’ blueberry bushes and phacelia plants (Phacelia tanacetifolia), exposed to CT (25 °C, 4 h) or HT (37.5 °C, 4 h) conditions. Phacelia seeds were purchased from L.A. Hearn Company (King City, CA) and sown in 1 L plastic pots with a mixture of potting soil (Michigan Grower Products, Inc., Galesburg, MI) and field soil at a 50:50 ratio. Approximately 20 pots of phacelia were sown each week and watered as needed (January-April 2023) to ensure sufficient blooming plants for experiments. For both species, exposure to CT or HT conditions occurred at approximately 25% bloom. Plants were exposed at this phenology stage to mimic the 2018 extreme heat event described above, it allowed for a wider breadth of floral developmental stages exposed to heat (from bud swell to anthesis), and was similar to conditions in our recent study12. Blueberry and phacelia plants were randomly assigned to a temperature treatment and exposed to assigned conditions in growth chambers in pairs, where 2–6 plants would be exposed to CT or HT conditions at the same time. Following a 4 h temperature treatment in growth chambers, plants were promptly brought back to the greenhouse and kept under optimal conditions (20–25 °C, 16:8 L: D).
While blueberry pollen collection was performed by hand (see above), phacelia pollen was collected using female Osmia cornifrons because O. cornifrons were available and forage readily on phacelia flowers. Osmia cornifrons were obtained from Meyer Bees (Minooka, IL) and moved from overwintering conditions to emergence conditions (20–22 °C) in late April 2023. Bees were reared in the laboratory using two 0.3 × 0.3 m plastic mesh cages (BioQuip, Rancho Dominguez, CA) next to a window for natural light, with 20 male and 10 female cocoons present in each cage. Bees took 3–5 days to emerge and were provided sugar water (50% sucrose) ad libitum via a dental wick in a glass flask which was replaced every week. Once emerged, bees mated 2–3 days later. At the same time as bee rearing, we set up two 3.7 × 1.8 m mesh field cages (BioQuip, Rancho Dominguez, CA), spaced 1 m apart in the MSU greenhouses. A random number generator was used to assign cages to receive either CT or HT plants. Within each cage, a nest box was placed on the opposite end from the opening, facing east using previously described methods27. Phacelia plants exposed to CT or HT conditions were promptly placed into respective field cages following exposure, with approximately 30 phacelia plants in each cage. A plastic container (27.9 × 16.8 × 13.7 cm) was filled with mud from the MSU Entomology Research farm and placed in front of nest boxes to support brood cell construction. Six females were released in each cage and allowed to forage on phacelia plants. Nest boxes were checked daily, and when available, pollen provisions were collected in the evening when female bees were not actively flying. In the lab, eggs were immediately removed from provisions and discarded and vials containing pollen were weighed then stored in a −80 °C freezer until ready for diet preparation.
To make artificial pollen diets, blueberry and phacelia pollen was removed from the − 80 °C freezer and vials containing CT or HT pollen were combined (within a temperature treatment group and plant type) to homogenize samples. For each provision, a total mass of 180 mg of pollen was provided to each egg, containing 170 mg of blueberry pollen and 10 mg of phacelia pollen, combined with 144 mg of sugar water (50% sucrose) for a total pollen provision weight of 324 mg per bee. Thus, each larva received the same amount of pollen provision. Sterilized tools were used to combine, mix, and place provisions in sterilized 48-well cell culture plates. This in vitro rearing method using cell culture plates was similar to that used in recent studies12,104,105. Once diets from CT and HT plants were placed in well plates, they were placed back in the − 80 °C freezer for up to 5 days until ready for egg placement.
To collect eggs for this experiment, approximately 800 cocoons were purchased from the Osmia Bee Company (Cincinnati, Ohio). Six trap nest boxes (using previously described methods27) were placed at three different locations around MSU campus and the Lansing area, where actively blooming floral resources were abundant, and mud was available for brood partitioning. At each trap nest location, approximately 250 bees were released in early May 2023. Trap nests were checked daily for brood production, where eggs and associated pollen provisions were collected the same day eggs were laid, or within two days. Egg collection occurred at night, minimizing disturbance and potential damage to mother bees and eggs, and conducted from May 9th 2023-May 22nd 2023. Sterilized featherweight forceps (BioQuip, Rancho Dominguez, CA) were used to place each egg and associated pollen provision in a 1.5 mL centrifuge vial with a piece of sterilized aluminum foil placed inside, holding them upright. These were transferred to the lab and each pollen provision was weighed on a precision balance (Mettler Toledo, Columbus, OH), accurate to 1 mg. Following collection, each egg was randomly assigned to a well plate (1–7) and diet treatment (Host, CT, or HT). Host pollen, or the pollen provision collected by mother bees from trap nests, was set aside and mixed to create a homogenized sample. Then, 324 mg was weighed and randomly placed in 48-well cell culture plates, along with CT and HT pollen diets. Collected eggs were carefully transferred to assigned diet and well plate, where typically six eggs were placed on each plate, allowing two eggs per diet treatment, per well plate. Across the seven well plates, 15 eggs received a CT diet, 14 eggs received an HT diet, and 14 eggs received a Host diet.
Well plates containing Osmia brood were kept in a dark environmental growth chamber (22 °C + 60% RH) and were removed for brief periods every 1–2 days to assess larval survival and growth stage using a dissecting microscope. We recorded developmental stages as egg/1st instar, 2nd/3rd instar, 3rd/4th instar, 5th instar, cocoon spinning or fully spun cocoon12,106. Eggs were considered alive if they appeared undamaged (no holes, not deflated), and larvae were considered alive if they were moving or if spiracles on the side of the body were dilating, indicating breathing. Developing offspring were maintained at 22 °C + 60% RH for 120 days, then moved to pre-wintering conditions (21 days: 14 °C + 60% RH), wintering conditions (120 days: 4 °C + 60% RH) and finally emergence conditions (22 °C + 60% RH). Once well plates were moved to emergence conditions, brood were checked daily to determine the timing of emergence and the longevity of adult survival in the absence of food. The longevity of Osmia lignaria adults in the absence of food reflects the quality of diet received as larvae and survival under natural conditions when food sources are limited104,107. Once adult bee progeny died, they were removed from well plates and sexed.
Data analysis
All statistical analyses were conducted using R (version 4.2.3)108. Generalized linear mixed-models (GLMM) and linear mixed-models (LMM) (‘lme4’ package)109 were used to determine the effects of temperature treatment (CT, HT) on pollen metabolites at various floral developmental stages (tight bud, bud swell, bud break, early/late pink bud, and anthesis), fruit set at various floral developmental stages (tight bud, bud swell, bud break, early pink bud, and late pink bud), and Osmia lignaria development and survival across different developmental stages (egg/1st instar-fully spun cocoon) among three different diet types (Host, CT, or HT). A mixed effect Cox model (‘coxme’ and ‘survival’ packages)110,111 was used to determine the effect of diet type on the probability of O. lignaria larval survival. Final models were selected based on the nature of the data taken (i.e., count vs. continuous), meeting the assumptions of the model distribution, assessing the lowest AIC model scores (‘bbmle’ and ‘stats’ packages)108,112, the model deviance residuals (‘base’ package)108, and other model performance metrics (‘performance’ package)113. GLMM and LMM model assumptions were checked with scaled residuals using ‘performance’ and ‘car’ packages113,114. To test the assumptions of mixed effect Cox models, we quantified the relationship between scaled Schoenfeld residuals and time (‘finalfit’ package)115. All models described below adequately met model distribution assumptions. Test statistics were calculated using Likelihood Ratio Tests (LRT) (‘stats’ package)108. The ‘stats’, ‘emmeans’ and ‘multcomp’ packages116,117were used for pairwise comparisons between temperature treatments within a developmental stage and to derive means and standard errors of response variables from models. Figures were made using the ‘ggplot2’, ‘ggsignif’, ‘ggsurvfit’, and ‘survival’ packages110,118,119,120.
Linear mixed models (LMM) were used to test the effects of temperature exposure on nutrient content of blueberry pollen, including starch, sucrose, protein, and several individual amino acids (asparagine, aspartate, glutamate, proline, arginine, phenylalanine) across all floral developmental stages (tight bud through anthesis). Random effects including in these models included replicate, bush identity, pollen collection date, and flower location. A GLMM with a gamma distribution and inverse link function was used to test the effects of temperature exposure on glucose, total amino acids, essential and non-essential amino acids, and several individual amino acids (serine, threonine, methionine, histidine, lysine, tryptophan, tyrosine, valine, leucine, alanine, cysteine, isoleucine, glutamine).
A GLMM with a negative binomial distribution was used to test the effect of pollen diet on O. lignaria larval development. The number of days until each larval developmental stage was reached was included as the response variable (or for egg/1st instar, number of days at that stage), and larval developmental stage and diet treatment were included as interactive fixed effects. The location of the stem that each egg was collected from, and the well plate number that larvae were reared in, were included as random effects. A mixed effect Cox model was used to test the effect of diet treatment on larval survival over time, using the same random effects above plus the date each egg was collected. A GLMM with a binomial distribution and logit link function was used to determine the effect of diet treatment on larval survival for each developmental stage, using survival as the response variable and diet treatment and larval developmental stage as interactive fixed effects. In this model, the date of egg collection, the location of the stem it was collected from, and the well plate number were included as random effects. Among individuals who survived to adulthood, a GLMM with a negative binomial distribution was used to test the effect of pollen diet on the number of days until emergence and the number of days alive as an adult. Diet treatment and sex were included as interactive fixed effects, and the location of the stem individuals were collected from, and the well plate number in which larvae were reared, were included as random effects.
To test the effects of temperature exposure on blueberry fruit set a GLMM with a binomial distribution and logit link function was used, where the response variable was a binary indicator for fruit set success or failure. Blueberry floral developmental stage and temperature treatment were included as fixed effects and replicate and bush code were included as random effects.
Data availability
All data files and R code from this study can be found at FigShare: https://doi.org/10.6084/m9.figshare.27948096.v1.
References
-
Klein, A. M. et al. Importance of pollinators in changing landscapes for world crops. Proc. R. Soc. B Biol. Sci. 274, 303–313 (2007).
-
Ollerton, J., Winfree, R. & Tarrant, S. How many flowering plants are pollinated by animals? Oikos 120, 321–326 (2011).
Google Scholar
-
Roulston, T. H. & Cane, J. H. Pollen nutritional content and digestibility for animals. Plant. Syst. Evol. 222, 187–209 (2000).
Google Scholar
-
Zinn, K. E., Tunc-Ozdemir, M. & Harper, J. F. Temperature stress and plant sexual reproduction: uncovering the weakest links. J. Exp. Bot. 61, 1959–1968 (2010).
Google Scholar
-
Raja, M. M. et al. Pollen development and function under heat stress: from effects to responses. Acta Physiol. Plant. 41, (2019).
-
Lohani, N., Singh, M. B. & Bhalla, P. L. High temperature susceptibility of sexual reproduction in crop plants. J. Exp. Bot. 71, 555–568 (2020).
Google Scholar
-
Walters, J. & Isaacs, R. Pollen germination and tube growth in northern highbush blueberry are inhibited by extreme heat. HortScience 58, 635–642 (2023).
Google Scholar
-
Walters, J., Zavalnitskaya, J., Isaacs, R. & Szendrei, Z. Heat of the moment: extreme heat poses a risk to bee–plant interactions and crop yields. Curr. Opin. Insect Sci. 52, 100927–100927 (2022).
Google Scholar
-
Greenop, A. et al. Equivocal evidence for colony level stress effects on bumble bee pollination services. Insects 11, 1–17 (2020).
Google Scholar
-
Descamps, C., Jambrek, A., Quinet, M. & Jacquemart, A. L. Warm temperatures reduce flower attractiveness and bumblebee foraging. Insects 12, 1–13 (2021).
Google Scholar
-
Hemberger, J. A., Rosenberger, N. M. & Williams, N. M. Experimental heatwaves disrupt bumblebee foraging through direct heat effects and reduced nectar production. Funct. Ecol. 37, 591–601 (2023).
Google Scholar
-
Walters, J., Barlass, M., Fisher, R. & Isaacs, R. Extreme heat exposure of host plants indirectly reduces solitary bee fecundity and survival. Proc. R Soc. B Biol. Sci. 291, 20240714 (2024).
Google Scholar
-
Borghi, M., de Souza, P., Yoshida, L., Fernie, A. R. & T. & Flowers and climate change: a metabolic perspective. New. Phytol. 224, 1425–1441 (2019).
Google Scholar
-
Borghi, M. & Fernie, A. R. Floral metabolism of sugars and amino acids: implications for pollinators’ preferences and seed and fruit set. Plant. Physiol. 175, 1510–1524 (2017).
Google Scholar
-
Santiago, J. P. & Sharkey, T. D. Pollen development at high temperature and role of carbon and nitrogen metabolites. Plant. Cell. Environ. 42, 2759–2775 (2019).
Google Scholar
-
Santiago, J. P. et al. Contrasting anther glucose-6-phosphate dehydrogenase activities between two bean varieties suggest an important role in reproductive heat tolerance. Plant. Cell. Environ. 44, 2185–2199 (2021).
Google Scholar
-
De Storme, N. & Geelen, D. The impact of environmental stress on male reproductive development in plants: Biological processes and molecular mechanisms. Plant. Cell. Environ. 37, 1–18 (2014).
Google Scholar
-
Chaturvedi, P. et al. Heat stress response mechanisms in pollen development. New. Phytol. 231, 571–585 (2021).
Google Scholar
-
Hedhly, A., Hormaza, J. I. & Herrero, M. Global warming and sexual plant reproduction. Trends Plant. Sci. 14, 30–36 (2009).
Google Scholar
-
Retamales, J. B. & Hancock, J. F. Blueberries (CABI, 2012).
Google Scholar
-
Lobos, G. A. & Hancock, J. F. Breeding blueberries for a changing global environment: a review. Front. Plant. Sci. 6, 1–14 (2015).
Google Scholar
-
USDA-NASS. Michigan Agricultural Statistics 2018–2019. https://www.nass.usda.gov/Statistics_by_State/Michigan/Publications/Annual_Statistical_Bulletin/stats19/agstat2019.pdf. Accessed online 1/22/2025.
-
Kazenel, M. R., Wright, K. W., Griswold, T., Whitney, K. D. & Rudgers, J. A. Heat and desiccation tolerances predict bee abundance under climate change. Nature 628, 342–348 (2024).
Google Scholar
-
Vaudo, A. D. et al. Pollen protein: lipid macronutrient ratios may guide broad patterns of bee species floral preferences. Insects 11, (2020).
-
Vaudo, A. D., Tooker, J. F., Grozinger, C. M. & Patch, H. M. Bee nutrition and floral resource restoration. Curr. Opin. Insect Sci. 10, 133–141 (2015).
Google Scholar
-
Woodard, S. H., Duennes, M. A., Watrous, K. M. & Jha, S. Diet and nutritional status during early adult life have immediate and persistent effects on queen bumble bees. Conserv. Physiol. 7, coz048 (2019).
Google Scholar
-
Knauer, A. C. et al. Nutritional stress exacerbates impact of a novel insecticide on solitary bees’ behaviour, reproduction and survival. Proc. R. Soc. B Biol. Sci. 289, 20221013 (2022).
-
Bosch, J. Production of undersized offspring in a solitary bee. Anim. Behav. 75, 809–816 (2008).
Google Scholar
-
Bukovinszky, T. et al. Effects of pollen species composition on the foraging behaviour and offspring performance of the mason bee Osmia bicornis (L). Basic. Appl. Ecol. 18, 21–30 (2017).
Google Scholar
-
Filipiak, Z. M. & Filipiak, M. The scarcity of specific nutrients in wild bee larval food negatively influences certain life history traits. Biology 9, 462 (2020).
Google Scholar
-
Stuligross, C. & Williams, N. M. Pesticide and resource stressors additively impair wild bee reproduction: Stressors additively impair wild bees. Proc. R. Soc. B Biol. Sci. 287, (2020).
-
Hoover, S. E. R., Higo, H. A. & Winston, M. L. Worker honey bee ovary development: seasonal variation and the influence of larval and adult nutrition. J. Comp. Physiol. B. 176, 55–63 (2006).
Google Scholar
-
Human, H., Nicolson, S. W., Strauss, K., Pirk, C. W. W. & Dietemann, V. Influence of pollen quality on ovarian development in honeybee workers (Apis mellifera scutellata). J. Insect Physiol. 53, 649–655 (2007).
Google Scholar
-
Herbert, E. W., Bickley, W. E. & Shimanuki, H. The brood-rearing capability of caged honey bees fed dandelion and mixed pollen diets. J. Econ. Entomol. 63, 215–218 (1970).
Google Scholar
-
Ryder, J. T., Cherrill, A., Thompson, H. M. & Walters, K. F. A. Lower pollen nutritional quality delays nest building and egg laying in Bombus terrestris audax micro-colonies leading to reduced biomass gain. Apidologie 52, 1033–1047 (2021).
Google Scholar
-
Barraud, A. et al. Variations in nutritional requirements across bee species. Front. Sustain. Food Syst. 6, (2022).
-
Liolios, V. et al. Ranking pollen from bee plants according to their protein contribution to honey bees. J. Apic. Res. 54, 582–592 (2015).
Google Scholar
-
Jeannerod, L. et al. Some bee-pollinated plants provide nutritionally incomplete pollen amino acid resources to their pollinators. PLoS ONE. 17, e0269992 (2022).
Google Scholar
-
Vaudo, A. D., Dyer, L. A. & Leonard, A. S. Pollen nutrition structures bee and plant community interactions. Proc. Natl. Acad. Sci. 121, e2317228120 (2024).
-
Danforth, B. N., Minckley, R. L. & Neff, J. L. The Solitary Bees: Biology, Evolution, Conservation (Princeton University Press, 2019).
Google Scholar
-
LeCroy, K. A., Savoy-Burke, G., Carr, D. E., Delaney, D. A. & Roulston, T. H. Decline of six native mason bee species following the arrival of an exotic congener. Sci. Rep. 10, 18745 (2020).
Google Scholar
-
de Groot, A. P. Amino acid requirements for growth of the honeybee (Apis mellifica L). Experientia 8, 192–194 (1952).
Google Scholar
-
Jin, Y., Yang, H., Wei, Z., Ma, H. & Ge, X. Rice male development under drought stress: phenotypic changes and stage-dependent transcriptomic reprogramming. Mol. Plant. 6, 1630–1645 (2013).
Google Scholar
-
Hedhly, A. et al. Starch turnover and metabolism during flower and early embryo development. Plant. Physiol. 172, 2388–2402 (2016).
Google Scholar
-
Callens, C., Fernandez-Goméz, J., Tucker, M. R., Zhang, D. & Wilson, Z. A. Heat stress responses vary during floret development in European spring barley cultivars. Front. Plant. Sci. 13, (2023).
-
Thalmann, M. & Santelia, D. Starch as a determinant of plant fitness under abiotic stress. New. Phytol. 214, 943–951 (2017).
Google Scholar
-
Gough, R., Shutak, V. & Hauke, R. Growth and development of highbush blueberry. II. Reproductive growth, histological studies. J. Am. Soc. Hortic. Sci. 103, 476–479 (1978).
Google Scholar
-
Sakata, T., Takahashi, H., Nishiyama, I. & Higashitani, A. Effects of high temperature on the development of pollen mother cells and microspores in Barley Hordeum vulgare L. J. Plant. Res. 113, 395–402 (2000).
Google Scholar
-
Iwahori, S. High temperature injuries in tomato fertilization and development of embryos with special reference to the abnormalities cause by high temperature. J. Jpn Soc. Hortic. Sci. 35, 379–386 (1966).
Google Scholar
-
Peet, M. M., Sato, S. & Gardner, R. G. Comparing heat stress effects on male-fertile and male-sterile tomatoes. Plant. Cell. Environ. 21, 225–231 (1998).
Google Scholar
-
Vara Prasad, P. V., Craufurd, P. Q., Summerfield, R. J. & Wheeler, T. R. Effects of short episodes of heat stress on flower production and fruit-set of groundnut (Arachis hypogaea L). J. Exp. Bot. 51, 777–784 (2000).
-
Kim, S. Y., Hong, C. B. & Lee, I. Heat shock stress causes stage-specific male sterility in Arabidopsis thaliana. J. Plant. Res. 114, 301–307 (2001).
Google Scholar
-
Pressman, E., Peet, M. M. & Pharr, D. M. The effect of heat stress on tomato pollen characteristics is associated with changes in carbohydrate concentration in the developing anthers. Ann. Bot. 90, 631–636 (2002).
Google Scholar
-
Rodrigo, J. & Herrero, M. Effects of pre-blossom temperatures on flower development and fruit set in apricot. Sci. Hortic. 92, 125–135 (2002).
Google Scholar
-
Firon, N. et al. Pollen grains of heat tolerant tomato cultivars retain higher carbohydrate concentration under heat stress conditions. Sci. Hortic. 109, 212–217 (2006).
Google Scholar
-
Sato, S. et al. Moderate increase of mean daily temperature adversely affects fruit set of Lycopersicon esculentum by disrupting specific physiological processes in male reproductive development. Ann. Bot. 97, 731–738 (2006).
Google Scholar
-
Jain, M., Chourey, P. S., Boote, K. J. & Allen, L. H. Short-term high temperature growth conditions during vegetative-to-reproductive phase transition irreversibly compromise cell wall invertase-mediated sucrose catalysis and microspore meiosis in grain sorghum (Sorghum bicolor). J. Plant. Physiol. 167, 578–582 (2010).
Google Scholar
-
Ledesma, N. A. & Kawabata, S. Responses of two strawberry cultivars to severe high temperature stress at different flower development stages. Sci. Hortic. 211, 319–327 (2016).
Google Scholar
-
Schwacke, R. et al. LeProT1, a transporter for proline, glycine betaine, and γ-amino butyric acid in tomato pollen. Plant. Cell. 11, 377–391 (1999).
Google Scholar
-
Biancucci, M. et al. Role of proline and GABA in sexual reproduction of angiosperms. Front. Plant. Sci. 6, (2015).
-
Mattioli, R. et al. Proline synthesis in developing microspores is required for pollen development and fertility. BMC Plant. Biol. 18, 356 (2018).
Google Scholar
-
Chiang, H. H. & Dandekar, A. M. Regulation of proline accumulation in Arabidopsis thaliana (L.) Heynh during development and in response to desiccation. Plant. Cell. Environ. 18, 1280–1290 (1995).
Google Scholar
-
Forde, B. G. & Lea, P. J. Glutamate in plants: metabolism, regulation, and signalling. J. Exp. Bot. 58, 2339–2358 (2007).
Google Scholar
-
Palanivelu, R., Brass, L., Edlund, A. F. & Preuss, D. Pollen tube growth and guidance is regulated by POP2, an Arabidopsis gene that controls GABA levels. Cell 114, 47–59 (2003).
Google Scholar
-
Chen, D., Shao, Q., Yin, L., Younis, A. & Zheng, B. Polyamine function in plants: metabolism, regulation on development, and roles in abiotic stress responses. Front. Plant. Sci. 9, 1945 (2019).
Google Scholar
-
Jegadeesan, S. et al. Ethylene production and signaling in tomato (Solanum lycopersicum) pollen grains is responsive to heat stress conditions. Plant. Reprod. 31, 367–383 (2018).
Google Scholar
-
Han, M. et al. l-Aspartate: an essential metabolite for plant growth and stress acclimation. Molecules 26, 1887 (2021).
Google Scholar
-
Hashida, S., Takahashi, H. & Uchimiya, H. The role of NAD biosynthesis in plant development and stress responses. Ann. Bot. 103, 819–824 (2009).
Google Scholar
-
Lin, H., Kwan, A. L. & Dutcher, S. K. Synthesizing and salvaging NAD+: lessons learned from Chlamydomonas reinhardtii. PLOS Genet. 6, e1001105 (2010).
Google Scholar
-
Hashida, S., Takahashi, H., Kawai-Yamada, M. & Uchimiya, H. Arabidopsis thaliana nicotinate/nicotinamide mononucleotide adenyltransferase (AtNMNAT) is required for pollen tube growth. Plant. J. 49, 694–703 (2007).
Google Scholar
-
Hashida, S. et al. NAD + accumulation during pollen maturation in arabidopsis regulating onset of germination. Mol. Plant. 6, 216–225 (2013).
Google Scholar
-
Yang, Q., Zhao, D. & Liu, Q. Connections between amino acid metabolisms in plants: lysine as an example. Front. Plant. Sci. 11, (2020).
-
Trovato, M. et al. Amino acids in plants: regulation and functions in development and stress defense. Front. Plant. Sci. 12, (2021).
-
Porch, T. & Jáhn, M. Effects of high-temperature stress on microsporogenesis in heat-sensitive and heat-tolerant genotypes of Phaseolus vulgaris. Plant. Cell. Environ. 24, 723–731 (2001).
Google Scholar
-
Cren, M. & Hirel, B. Glutamine synthetase in higher plants regulation of gene and protein expression from the organ to the cell. Plant. Cell. Physiol. 40, 1187–1193 (1999).
Google Scholar
-
Lee, K. T., Liao, H. S. & Hsieh, M. H. Glutamine metabolism, sensing and signaling in plants. Plant. Cell. Physiol. 64, 1466–1481 (2023).
Google Scholar
-
Vanderplanck, M. et al. How does pollen chemistry impact development and feeding behaviour of polylectic bees? PLoS ONE. 9, 1–9 (2014).
Google Scholar
-
Vaudo, A. D., Patch, H. M., Mortensen, D. A., Tooker, J. F. & Grozinger, C. M. Macronutrient ratios in pollen shape bumble bee (Bombus impatiens) foraging strategies and floral preferences. Proc. Natl. Acad. Sci. U S A. 113, E4035–E4042 (2016).
Google Scholar
-
Crone, M. K., Biddinger, D. J. & Grozinger, C. M. Wild bee nutritional ecology: integrative strategies to assess foraging preferences and nutritional requirements. Front. Sustain. Food Syst. 6, (2022).
-
Ruedenauer, F. A., Spaethe, J. & Leonhardt, S. D. How to know which food is good for you: bumblebees use taste to discriminate between different concentrations of food differing in nutrient content. J. Exp. Biol. 218, 2233–2240 (2015).
Google Scholar
-
Crone, M. K. et al. More than mesolectic: characterizing the nutritional niche of Osmia cornifrons. Ecol. Evol. 13, e10640 (2023).
Google Scholar
-
Cane, J. H. Adult pollen diet essential for egg maturation by a solitary Osmia bee. J. Insect Physiol. 95, 105–109 (2016).
Google Scholar
-
Nepi, M., Cresti, L., Maccagnani, B., Ladurner, E. & Pacini, E. From the anther to the proctodeum: Pear (Pyrus communis) pollen digestion in Osmia cornuta larvae. J. Insect Physiol. 51, 749–757 (2005).
-
Lau, P., Lesne, P., Grebenok, R. J., Rangel, J. & Behmer, S. T. Assessing pollen nutrient content: a unifying approach for the study of bee nutritional ecology. Philos. Trans. R Soc. B Biol. Sci. 377, 20210510 (2022).
Google Scholar
-
Austin, A. J. & Gilbert, J. D. J. Solitary bee larvae prioritize carbohydrate over protein in parentally provided pollen. Funct. Ecol. 35, 1069–1080 (2021).
Google Scholar
-
Wasielewski, O., Wojciechowicz, T., Giejdasz, K. & Krishnan, N. Overwintering strategies in the red mason solitary bee—physiological correlates of midgut metabolic activity and turnover of nutrient reserves in females of Osmia bicornis. Apidologie 44, 642–656 (2013).
Google Scholar
-
Simpson, B. B. & Neff, J. L. Evolution and Diversity of Floral Rewards, in: Handbook of Experimental Pollination Biology. (Van Nostrand Rienhold Co. New York).
-
Pirk, C. W. W., Boodhoo, C., Human, H. & Nicolson, S. W. The importance of protein type and protein to carbohydrate ratio for survival and ovarian activation of caged honeybees (Apis mellifera scutellata). Apidologie 41, 62–72 (2010).
Google Scholar
-
Levin, M. D. & Haydak, M. H. Comparative value of different pollens in the nutrition of Osmia lignaria. Bee World (1957).
-
Paoli, P. P. et al. Nutritional balance of essential amino acids and carbohydrates of the adult worker honeybee depends on age. Amino Acids. 46, 1449–1458 (2014).
Google Scholar
-
Grandison, R. C., Piper, M. D. W. & Partridge, L. Amino-acid imbalance explains extension of lifespan by dietary restriction in Drosophila. Nature 462, 1061–1064 (2009).
Google Scholar
-
Stabler, D., Paoli, P. P., Nicolson, S. W. & Wright, G. A. Nutrient balancing of the adult worker bumblebee (Bombus terrestris) depends on the dietary source of essential amino acids. J. Exp. Biol. 218, 793–802 (2015).
Google Scholar
-
Archer, C. R. et al. Complex relationship between amino acids, fitness and food intake in Bombus terrestris. Amino Acids. 53, 1545–1558 (2021).
Google Scholar
-
Austad, S. N., Smith, J. R. & Hoffman, J. M. Amino acid restriction, aging, and longevity: an update. Front. Aging 5, (2024).
-
Juricic, P., Grönke, S. & Partridge, L. Branched-chain amino acids have equivalent effects to other essential amino acids on lifespan and aging-related traits in Drosophila. J. Gerontol. Ser. A. 75, 24–31 (2020).
Google Scholar
-
Fulton, T. L., Wansbrough, M. R., Mirth, C. K. & Piper, M. D. W. Short-Term fasting of a single amino acid extends lifespan. GeroScience (2024).
-
Weide, J. V. et al. Blueberry Varieties for Michigan. (2024).
-
Kearns, C. A. & Inouye, D. W. Techniques for Pollination Biologists (University Press of Colorado, 1993).
Google Scholar
-
Lu, Y., Steichen, J. M., Weise, S. E. & Sharkey, T. D. Cellular and organ level localization of maltose in maltose-excess Arabidopsis mutants. Planta 224, 935–943 (2006).
Google Scholar
-
Lu, Y. & Sharkey, T. D. The role of amylomaltase in maltose metabolism in the cytosol of photosynthetic cells. Planta 218, 466–473 (2004).
Google Scholar
-
Santiago, J. P. & Tegeder, M. Connecting source with sink: the role of Arabidopsis AAP8 in phloem loading of amino acids. Plant. Physiol. 171, 508–521 (2016).
Google Scholar
-
Jones, L. J., Haugland, R. P. & Singer, V. L. Development and characterization of the NanoOrange® protein quantitation assay: a fluorescence-based assay of proteins in solution. BioTechniques34, 850–861 (2018).
Google Scholar
-
Retamales, J. B. & Hancock, J. F. Blueberries, 2nd EditionCABI,. (2018).
-
Eeraerts, M., Pisman, M., Vanderhaegen, R., Meeus, I. & Smagghe, G. Recommendations for standardized oral toxicity test protocols for larvae of solitary bees, Osmia spp. Apidologie 51, 48–60 (2020).
Google Scholar
-
Dharampal, P. S., Carlson, C. M., Diaz-Garcia, L. & Steffan, S. A. In vitro rearing of solitary bees: A tool for assessing larval risk factors. J. Vis. Exp. 1–14 (2018). (2018).
-
Claus, G., Pisman, M., Spanoghe, P., Smagghe, G. & Eeraerts, M. Larval oral exposure to thiacloprid: dose-response toxicity testing in solitary bees, Osmia spp. (Hymenoptera: Megachilidae). Ecotoxicol. Environ. Saf. 215, 112143 (2021).
Google Scholar
-
Bosch, J. & Kemp, W. P. Development and emergence of the orchard pollinator Osmia lignaria (Hymenoptera: Megachilidae). Environ. Entomol. 29, 8–13 (2000).
Google Scholar
-
R Core Team. R: A language and environment for statistical computing. (2023). https://www.r-project.org/
-
Bates, D., Mächler, M., Bolker, B. & Walker, S. Fitting linear mixed-effects models using lme4. J. Stat. Softw. 67, 1–48 (2015).
Google Scholar
-
Therneau, T. A package for survival analysis in R. R package version 3.7-0. (2024).
-
Therneau, T. M. & coxme Mixed effects cox models. R package version 2.2–22. (2024).
-
Bolker, B. & Development Core, R. Team. bbmle: Tools for general maximum likelihood estimation. R package version 1.0.25.1 (2023).
-
Lüdecke, D. et al. performance: Assessment of regression models performance. (2024).
-
Fox, J. et al. car: Companion to applied regression. (2023).
-
Harrison, E., Drake, T. & Pius, R. finalfit: Quickly create elegant regression results tables and plots when modelling. (2023).
-
Hothorn, T. et al. multcomp: Simultaneous inference in general parametric models. (2023).
-
Lenth, R. V. et al. emmeans: Estimated marginal means, aka least-squares means. (2024).
-
Ahlmann-Eltze, C. & Patil, I. ggsignif: R package for displaying significance brackets for ‘ggplot2’. (2021).
-
Sjoberg, D. D., Baillie, M., Fruechtenicht, C., Haesendonckx, S. & Treis, T. ggsurvfit: Flexible time-to-event Fig. (2023).
-
Wickham, H. et al. ggplot2: Create elegant data visualisations using the grammar of graphics. (2024).
Acknowledgements
We thank Sean Weise and Bianca Serda for their assistance with pollen metabolite extractions and technical advice, Anthony Schilmiller from the Michigan State University Metabolomics core facility for providing amino acid standards and technical advice on amino acid assays, Mia Bianchi and Lauren Goldstein for assistance with bee assessments, Chrislyn Particka for greenhouse coordination and maintenance, Douglas Landis for access to growth chambers, Anina Knauer and the PoshBee research group for guidance on the bee nest box design, and Sichao Wang for consultation on statistical analyses. We also thank our funding sources, including Project GREEEN the USDA-NIFA Specialty Crops Research Initiative (2020-51181-32155) and the MSU Plant Resilience Institute. TDS receives partial salary support from MSU AgBioResearch.
Author information
Authors and Affiliations
Contributions
J.W. contributed to the experimental conceptualization, data curation, formal analysis, funding acquisition, investigation, methodology, project administration, supervision, visualization, and writing including the original draft and editing. R.F. contributed to the data curation, investigation, and reviewing the manuscript. T.D. S and R.I. contributed to the experimental conceptualization, funding acquisition, methodology, supervision, visualization, and reviewing and editing writing. J.P.S contributed to the experimental conceptualization, data curation, formal analysis, funding acquisition, methodology, supervision, visualization, and reviewing and editing writing.
Corresponding author
Ethics declarations
Competing interests
The authors declare no competing interests.
Additional information
Publisher’s note
Springer Nature remains neutral with regard to jurisdictional claims in published maps and institutional affiliations.
Electronic supplementary material
Below is the link to the electronic supplementary material.
Supplementary Material 1
Rights and permissions
Open Access This article is licensed under a Creative Commons Attribution-NonCommercial-NoDerivatives 4.0 International License, which permits any non-commercial use, sharing, distribution and reproduction in any medium or format, as long as you give appropriate credit to the original author(s) and the source, provide a link to the Creative Commons licence, and indicate if you modified the licensed material. You do not have permission under this licence to share adapted material derived from this article or parts of it. The images or other third party material in this article are included in the article’s Creative Commons licence, unless indicated otherwise in a credit line to the material. If material is not included in the article’s Creative Commons licence and your intended use is not permitted by statutory regulation or exceeds the permitted use, you will need to obtain permission directly from the copyright holder. To view a copy of this licence, visit http://creativecommons.org/licenses/by-nc-nd/4.0/.
Reprints and permissions
About this article
Cite this article
Walters, J., Fisher, R., Sharkey, T.D. et al. Extreme heat affects blueberry pollen nutrition, bee health, and plant reproduction.
Sci Rep 15, 6249 (2025). https://doi.org/10.1038/s41598-025-90676-y
-
Received: 03 December 2024
-
Accepted: 14 February 2025
-
Published: 20 February 2025
-
DOI: https://doi.org/10.1038/s41598-025-90676-y
Keywords
- Bee nutrition
- Climate change
- Pollen viability
- Pollen nutrition
- Native bees
- Bee health