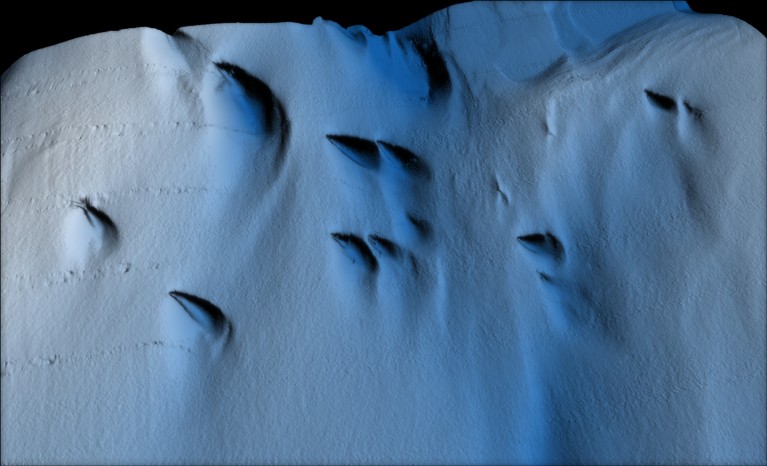
A visualization of the underside of Dotson Ice Shelf showing mysterious tear drop shaped areas of melting.Credit: Filip Stedt/University of Gothenburg
The first detailed map of the underside of an ice shelf reveals melted areas that have an unexpected shape: teardrops1. The data, published today in Science Advances, could help researchers to better understand how ice is affected when scoured by ocean currents and might lead to more accurate predictions of sea-level rise.
Although remote-operated submersibles have ventured under ice shelves, none has produced a fine-resolution ice map before. “It’s a little bit like the holy grail in Antarctic oceanography,” says Anna Wåhlin, an oceanographer at the University of Gothenburg in Sweden and the first author of the paper. “We had to revise our mental images of the ice completely when we got these data.”
Pings paint a picture
Ice shelves float atop seawater, fed by tributary glaciers on land that flow towards the ocean. The study describes the belly of the Dotson Ice Shelf, a part of the West Antarctic Ice Sheet, which could cause an average sea-level rise of 3.2 metres if it were to suddenly collapse2. If Dotson breaks away, the land-based glaciers could become destabilized and their flow out to sea could accelerate, Wåhlin and others say.
In 2022, Wåhlin and her colleagues sent a robotic submersible equipped with sonar to map about 20% of the ice shelf. The craft repeatedly fired pings from 450 sonar beams, which echoed off the shelf and back to the submersible as it moved in a lawn-mower pattern back and forth under the ice for 27 days. The team also measured ocean currents and the temperature and salinity of the water.
The researchers discovered more than 75 teardrop shapes carved into the bottom of the ice shelf, ranging from 20 to 300 metres wide and averaging 14 metres deep. The teardrops were observed only on the western side of the shelf. That portion of the shelf is thinner and is battered by faster currents than is the shelf’s eastern side.
This submersible mapped the bottom of an ice sheet before vanishing into the chilly water.Credit: Filip Stedt
The authors hypothesize that the water’s circulation and friction between the ice and ocean surface might create a spiral of water that accelerates melting to create these teardrop shapes, which the researchers called “enigmatic”. But more observations are necessary to confirm this idea, Wåhlin says.
“These results are really important because the Antarctic ice sheet is changing rapidly,” says Hélène Seroussi, a glaciologist at Dartmouth College in Hanover, New Hampshire, who was not involved in the study. Changing ocean conditions can accelerate melting, but most studies quantifying the melt rate are limited by indirect observations such as remote sensing, she says.
Dangerous realm
Follow-up direct observations of the bottom of the ice shelf will be key to creating more accurate projections of sea-level rise, Seroussi says. “Without these kinds of observations, we can’t even start.”
The researchers deployed the submersible again this year to repeat the survey at Dotson and to map the nearby Thwaites Glacier, and they are processing those data. But they lost contact with the US$3.8-million submersible during the last part of their mission.
“We know there’s a big risk” to sending expensive equipment under hundreds of metres of ice, Wåhlin says. “That’s why we don’t have these data until now.”