Abstract
This study investigated the association between green tea or coffee consumption with cerebral white matter lesions and hippocampal and total brain volumes among 8766 community-dwelling participants recruited from the Japan Prospective Studies Collaboration for Aging and Dementia between 2016 and 2018. A Food Frequency Questionnaire was used to assess green tea and coffee consumption, whereas brain magnetic resonance imaging was performed to assess cerebral white matter lesions, hippocampal volume, and total brain volume. Multivariable-adjusted analysis revealed significant correlations between fewer cerebral white matter lesions and higher green tea consumption, whereas no significant differences were found between green tea consumption and hippocampal or total brain volume. Regarding coffee consumption, no significant differences were observed in cerebral white matter lesions or hippocampal or total brain volumes. Hence, higher green tea consumption was associated with fewer cerebral white matter lesions, suggesting that it may be useful in preventing dementia.
Tea consumption and risk of incident dementia: A prospective cohort study of 377 592 UK Biobank participants
Association between lifetime coffee consumption and late life cerebral white matter hyperintensities in cognitively normal elderly individuals

Dietary diversity is associated with longitudinal changes in hippocampal volume among Japanese community dwellers
Introduction
Tea and coffee are widely consumed beverages that contain caffeine, polyphenols, and vitamins, which possess neuroprotective effects. Several epidemiological studies have shown that tea and coffee consumption are associated with cognitive benefits in older adults1,2,3,4,5,6. In some studies did not classified types of tea such as black tea and green tea strictly5,6. Neuroprotective ingredients containing beverages are known to be epigallocatechin gallate for green tea, theaflavins for black tea, and chlorogenic acid and caffeic acid for coffee, those ingredients have antioxidant and anti-inflammatory effects7,8,9,10,11,12,13,14,15.
The Japan Prospective Studies Collaboration for Aging and Dementia (JPSC-AD), a multisite, ongoing community-based observational study of dementia conducted at eight research sites in Japan, comprises data from approximately 10,000 older participants who underwent brain magnetic resonance imaging (MRI) examinations and dietary surveys at baseline. A detailed description of this survey has been published previously16,17,18.
Aging is a major risk factor for dementia and causes brain changes, such as brain atrophy, hippocampal atrophy, and an increase in cerebral white matter lesions. Although green tea and coffee are expected to have positive effects on mitigating cognitive decline, the link between tea or coffee consumption and brain changes in older adults remains poorly understood. Nonetheless, increased green tea consumption has been linked to reduced annual hippocampal atrophy at the population level19 and regular coffee consumption has been linked to higher cortical thickness20.
Therefore, the present study aimed to investigate the associations of green tea, black tea, and coffee intake with cerebral white matter lesion, hippocampal, and total brain volumes using brain MRI data in an older Japanese population without dementia.
Results
Study population and baseline characteristics
In the JPSC-AD, a baseline survey was conducted from 2016 to 2018. In total, 11,410 individuals aged ≥ 65 years from eight research sites participated in the study. Among them, 9646 underwent MRI with three-dimensional T1-weighted images. After excluding 167 participants for whom the FreeSurfer analysis did not pass quality control, 341 participants without available data on green tea, black tea, and/or coffee intake, and 372 participants with dementia at baseline, the remaining 8766 participants were deemed eligible for inclusion in the present study (Fig. 1).
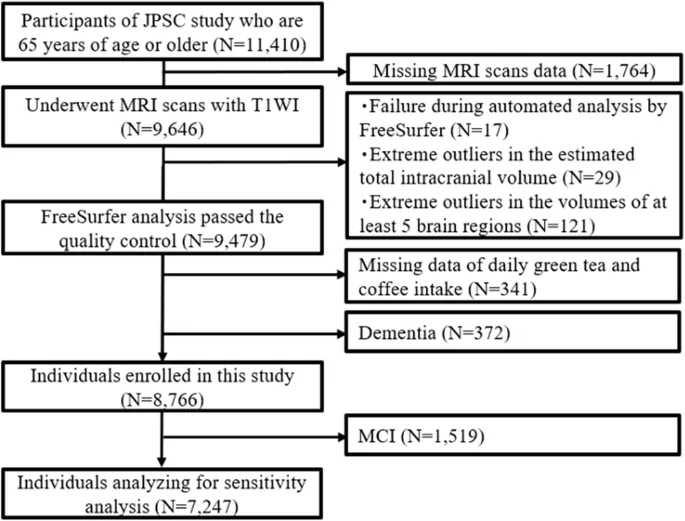
JPSC-AD Japan Prospective Studies Collaboration for Aging and Dementia, MRI magnetic resonance imaging, T1WI T1-weighted imaging, MCI mild cognitive impairment.
The percentages of participants with a habit of drinking green tea, coffee, and black tea were 91.6%, 82.0%, and 19.2%, respectively. Due to the low number of black tea consumers, we did not analyze the association between black tea consumption and brain volume on head MRI. The median (interquartile range) green tea and coffee intake for the entire cohort was 450.0 (150.0–750.0) ml and 150.0 (42.9–300.0) ml, respectively.
The clinical characteristics of the study population according to daily green tea intake are shown in Table 1. The frequency of female sex, median age, regular exercise and Mini-Mental State Examination (MMSE) scores increased significantly with higher daily green tea intake, whereas smoking and drinking habits and Geriatric Depression Scale (GDS) scores decreased significantly with higher daily green tea intake. According to daily coffee intake levels, the frequencies of diabetes mellitus, smoking habits, and electrocardiogram abnormalities significantly increased with higher daily coffee intake (Table 2). Conversely, the mean values of age, hypertension, low education, and serum high-density lipoprotein (HDL) cholesterol levels significantly decreased with higher daily coffee intake (Table 2).
Influence on brain volumes
Significant associations were observed between daily green tea consumption and white matter lesion volume (WMLV)/estimated total intracranial volume (eTIV), hippocampal volume (HV)/eTIV ratios after adjusting for age, sex, research site, and educational level (Model 1). The association between higher daily intake of green tea and lower WMLV/eTIV ratio remained unchanged even after adjusting for age, sex, research site, educational levels, presence of apolipoprotein E (ApoE) ε4, hypertension, body mass index (BMI) levels, serum low-density lipoprotein (LDL) and HDL cholesterol levels, regular exercise, and smoking and drinking habits (Model 2) (p for trend = 0.007). However, the associations between green tea intake and total brain volume (TBV)/eTIV and HV/eTIV ratios did not reach significant levels in Model 2 (Table 3) (p for trend = 0.959 and 0.240, respectively).
We also addressed the shape of the association between daily green tea consumption levels and the geometric mean of WMLV/eTIV using restricted cubic spline analyses. As shown in Fig. 2, the geometric mean of WMLV/eTIV decreased gradually with higher daily green tea consumption in older adults without dementia after adjusting for confounding factors. Supplementary Fig. 1 demonstrates the ratio of WMLV/eTIV for each daily green tea consumption to WMLV/eTIV for 200 ml of daily green tea consumption ( = reference), estimated using restricted cubic spline analyses. Cerebral white matter lesion volumes were significantly lower by 0.97 times (95% confidence interval 0.94–0.99) and 0.94 times (0.90–0.98) at daily green tea consumption levels of 600 ml (approximately 3 glasses per day) and 1500 ml (approximately 7–8 glasses per day), respectively, as compared to a consumption level of 200 ml.
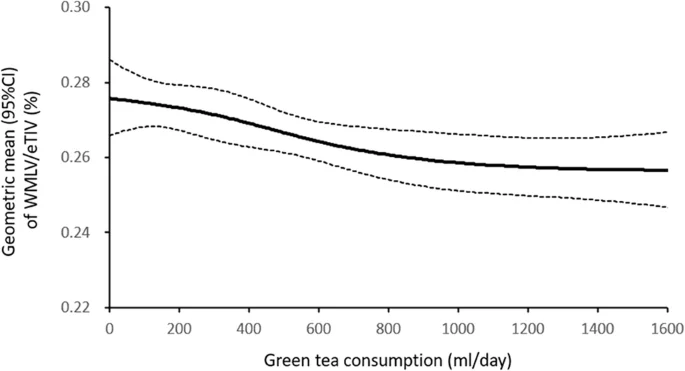
Solid lines represent the hazard ratio, while dashed lines represent their corresponding 95% confidence intervals (CIs). Knots were positioned at the 5th, 35th, 65th, and 95th percentiles (0, 300, 600, and 1500 ml/day) of daily green tea consumption. The same percentiles of geometric mean of WMLV/eTIV (0.276, 95%CI 0.266–0.286; 0.271, 95%CI: 0.265–0.278; 0.264, 95%CI: 0.259–0.270; and 0.257, 95%CI 0.248–0.266). eTIV estimated total intracranial volume, WMLV white matter lesion volume. Adjusted for age, sex, research site, educational levels, the presence of the Apolipoprotein E ε4 allele, hypertension, diabetes mellitus, history of stroke, electrocardiogram abnormalities, smoking and drinking habits, regular exercise, body mass index levels, and serum low- and high-density lipoprotein cholesterol levels.
No significant associations were observed between coffee intake and the TBV/eTIV, HV/eTIV, or WMLV/eTIV ratios (Table 3) (p for trend = 0.072, 0.262, and 0.171, respectively).
Sensitivity analysis
A sensitivity analysis was performed on those with normal cognitive function, excluding those with mild cognitive impairment (MCI) (Fig. 1). The clinical characteristics of the study population according to the daily intakes of green tea and coffee are shown in Supplementary Tables 1 and 2. The trends observed for the clinical characteristics of the sensitivity analysis were similar to those of the overall trends that included participants with MCI.
Significant associations were observed between the daily intake of green tea and WMLV/eTIV ratios in Model 1. The association between higher daily green tea intake and lower WMLV/eTIV ratio remained unchanged in Model 2 (p for trend = 0.021). The associations between green tea intake and the TBV/eTIV and HV/eTIV ratios did not reach statistical significance in Model 2 (Supplementary Table 3) (p for trend = 0.976, and 0.202, respectively). No significant associations were observed between coffee intake and the TBV/eTIV, HV/eTIV, or WMLV/eTIV ratios (Supplementary Table 3) (p for trend = 0.119, 0.327, and 0.215, respectively).
Green tea intake, depression, and ApoE ε4 carrier status
Upon examining the link between green tea intake and cerebral white matter lesions in the presence or absence of depression and the ApoE ε4 allele, we found a significant relationship between increased green tea consumption and decreased white matter lesions in individuals without depression, whereas no significant difference was found in individuals with depression (Supplementary Table 4) (p for trend = 0.007 and 0.457, respectively). Similarly, we observed a significant relationship between increased green tea intake and decreased white matter lesions in individuals without the ApoE ε4 allele, but not in individuals with the ApoE ε4 allele (p for trend = 0.008 and 0.491, respectively) (Supplementary Table 5).
Discussion
This cross-sectional study found a significant association between lower cerebral white matter lesions and higher green tea consumption, but not coffee consumption, in older adults without dementia, even after adjusting for confounding factors. Similar significant associations were observed when analyses were limited to older adults with normal cognitive function, excluding individuals with MCI.
Epidemiological studies suggest the association between green tea consumption and slowing cognitive decline1,2. White matter lesions, indicative of cerebral small vessel disease, are associated with vascular dementia and Alzheimer’s disease (AD)21. Habes et al. reported that larger white matter lesions were associated with more severe brain atrophy in patients with AD22,23. Recently, a longitudinal study also identified white matter lesions as an independent risk factor for cognitive decline, even after accounting for traditional AD risk factors and MRI biomarkers, such as ApoE ε4 carrier status, total brain volume, and HV24.
Hypertension is considered the most important risk factor for white matter lesions, and green tea consumption has been reported to reduce blood pressure25,26. A recent meta-analysis reported that regular green tea consumption lowered systolic and diastolic blood pressure by −6.22 mmHg and −2.36 mmHg, respectively25. The study also reported that longer periods of green or black tea consumption ( > 3 months) positively affected blood pressure, with green tea having a stronger antihypertensive effect than black tea25. Another meta-analysis found that green tea consumption reduced systolic and diastolic blood pressure by −1.98 mmHg and −1.92 mmHg, respectively26. Therefore, green tea consumption may contribute to white matter lesion reduction by improving blood pressure. Moreover, green tea contains less caffeine than coffee, which negatively affects blood pressure27, thus suggesting that green tea may have a more beneficial impact on white matter lesions.
Unlike our findings, Zhang et al. reported a significant association between higher HV and higher green tea consumption6. This discrepancy in findings may be attributed to the inclusion of community-dwelling older adults aged ≥ 65 years in our study, whereas Zhang et al. targeted adults aged 40–89 years. In addition, we evaluated each participant’s cognitive function to exclude individuals with dementia, whereas Zhang et al. excluded individuals with dementia through self-reporting. Sun et al. examined the association between tea intake and cerebral white matter hyperintensity volumes using the UK Biobank data and they did not find the causal association28. They analyzed all types of tea, so it is unclear what proportion of green tea was included, but since the study was conducted in the UK, it can be assumed that there was more black tea than green tea28. Because our study performed with older Japanese participants, it is necessary to clarify the association between green tea intake and cerebral white matter lesions in people with different ethnicities, genetics, and lifestyles.
In our study, the associations between green tea consumption and white matter lesions were observed only in the groups without depression and the ApoE ε4 allele. We can infer that, since depression and ApoE ε4 are strong risk factors for dementia, green tea may not be effective in reducing white matter lesions in individuals with depression and ApoE ε4. Alternatively, the sample sizes of the groups with depression and ApoE ε4 might have been too small for adequate evaluation. In addition, the prevalence of hypertension (p = 0.018) and diabetes (p = 0.005) was significantly higher and exercise habits (p < 0.001) were lower in the group with depression compared to the group without it. Even though we controlled for these factors, there may be other residual confounding factors.
Green tea catechins have been shown to exert antioxidant effects through free radical scavenging13. They also exhibit anti-inflammatory properties through inhibition of nuclear factor kappa B activation14,15, anti-platelet aggregation effects29, and nitric oxide regulation in the vascular endothelium30, and theanine has an antihypertensive effect31. Additionally, epigallocatechin gallate has been reported to confer neuroprotective effects by inhibiting amyloid β aggregation and production32,33,34. In this study, black tea was excluded from the analysis because there were few participants who consumed black tea. Theaflavins are the main neuroprotective ingredients containing in black tea and it has been reported that theaflavins are similar in mechanism and at least equal in efficacy to epigallocatechin gallate which is the main neuroprotective ingredients containing in green tea in weaking formation of protofibrils and fibrils of amyloid β and α synuclein11. Further studies are needed to clarify the association between black tea consumption with cerebral white matter lesion and brain volumes. There are many reports that coffee has a positive effect on cognitive function and brain volumes, but most of the reports are from Europe and the United States6,34,35,36, and few from Asia37. Differences in ethnicity and lifestyle (foods to eat with coffee and meal times, etc.) may have led to differences from previous reports.
This study has some limitations. First, we only investigated green tea and coffee intake when consumed as beverages and did not account for the amount contained in snacks. Importantly, there was also no information on how green tea was brewed, leading to potential variations in the content of bioactive substances. Second, we could not investigate the association between black tea consumption and brain volume changes due to the limited sample size of black tea consumers within the study population.
Third, being a cross-sectional study, it was difficult to determine the causal relationship between green tea consumption and cerebral white matter lesions. Finally, this study focused only on data from Japanese individuals; therefore, it is unclear whether similar trends are observed in other ethnicities and races. Despite these limitations, our study had notable strengths. It included a large sample size and was able to adjust for many confounding factors, exclusively targeted individuals without dementia to minimize the impact of cognitive decline on tea and coffee consumption behaviors, and accurately recorded intake habits using a Food Frequency Questionnaire (FFQ).
In conclusion, this study revealed that increased green tea consumption was associated with reduced cerebral white matter lesions. Given that cerebral white matter lesions are closely related to vascular dementia and AD, our findings indicate that drinking green tea, especially three or more glasses per day, may help prevent dementia. Nevertheless, further prospective longitudinal studies and basic research are needed to validate our results.
Methods
Study population
Among the 11,410 participants in the JPSC-AD study aged ≥ 65 years, 9646 underwent three-dimensional T1-weighted MRI. After excluding 167 participants who did not pass the quality control of the FreeSurfer analysis; 103 participants who did not have hippocampal measurement data; 341 participants without available data on green tea, black tea, and/or coffee intake; and 372 participants with dementia at baseline, 8766 participants were enrolled in the study (Fig. 1).
Ethical approvals and patient consents
This study was approved by the Kyushu University Institutional Review Board for clinical research (approval number 686-10) and by each of the local ethics committee of the eight research institutes: Kanazawa University (approval numbers 2185 and 437), Hirosaki University (approval number 2019-064-3), Iwate Medical University (approval number HG2020-017), Keio University School of Medicine (approval number 20160214), Matsue Medical Center (approval number H28-14), Ehime University (approval numbers 1610004 and 2210016), Kumamoto University (approval number 333), and Tohoku University (approval number 2021-1-245). This study complied with the principles outlined in the Declaration of Helsinki. Written informed consent was obtained from all participants.
Brain MRI analysis
The MRI equipment was set to T1-weighted imaging parameters according to the brain MRI protocol for the Alzheimer Disease Neuroimaging Initiative study38. Segmentation and volume measurements of cortical and subcortical brain structures, including WMLV, HV, and eTIV, were performed automatically using FreeSurfer (version 7.0; http://surfer.nmr.mgh.harvard.edu). TBV was calculated from brain segmentation volumes without ventricles. Cortical parcellation was performed using the Desikan-Killiany atlas39.
To adjust for head size, TBV, HV, and WMLV were calculated as percentages of eTIV (i.e., TBV-to-eTIV ratio (TBV/eTIV) [%], HV-to-eTIV ratio (HV/eTIV) [%], and WMLV-to-eTIV ratio (WMLV/eTIV) [%]).
Dietary survey
The daily intake of green tea and coffee was calculated based on FFQ. Dietary surveys, using a weighing and dietary recording method to measure the average intake of each food and nutrient, were performed for 4 consecutive days (three weekdays and one weekend day) over 16 days across all four seasons. The participants completed FFQ at a health center or at home and were provided with a dietary recording form, recording manual, digital weighing scale, measuring spoons, camera photography scale (standard graphic tool used in the National Health and Nutrition Survey), instant camera (for those unable to take pictures with mobiles or smartphones), and instructions on usage. Nutritional values were calculated according to the Japanese Standard Tables of Food Composition, 2015 (7th revision). The validity of the intake data was evaluated using Pearson’s correlation coefficients. The daily intake of green tea and coffee was classified into four groups: 0–200, 201–400, 401–600 and ≥ 601 ml, with one glass being approximately 200 ml.
Other risk factor measurements
Each participant completed a self-administered questionnaire collecting sociodemographic data (age, sex, and educational level), medical history (diabetes mellitus, hypertension, and past history of stroke), smoking and drinking habits, and regular exercise (defined as physical activity specifically undertaken for at least 30 min twice per week over the most recent year or longer). Completed questionnaires were reviewed by trained researchers to identify inconsistent or unanswered items. Depressive symptoms were evaluated using GDS (short form)40 cognitive function was evaluated using MMSE. The details have been previously described16. Blood pressure was measured thrice using a sphygmomanometer with intervals of at least 5 min, and the average of the three measurements was used for the analysis. Electrocardiographic abnormalities were defined as one or more of the following: left ventricular hypertrophy (Minnesota Code, 3-1), atrial flutter/fibrillation (8-3), and ST-segment depression (4-1, 2, 3). Hypertension was defined as blood pressure levels of ≥ 140/90 mmHg or the current use of antihypertensive agents. BMI (kg/m2) was used as an indicator of obesity. Serum HDL and LDL cholesterol levels were enzymatically measured17. ApoE polymorphisms were identified using a multiplex PCR-based targeted sequencing method, with two single-nucleotide polymorphisms (rs429358 and rs7412) genotyping, as previously reported41.
Statistical analyses
Clinical characteristics were evaluated using the t-test, Jonckheere-Terpstra test, chi-square test, or Mantel-Haenszel test for continuous and categorical variables. Analysis of covariance was performed to estimate and compare the multivariate-adjusted values and 95% confidence intervals (CIs) for the TBV/eTIV, HV/eTIV, and WMLV/eTIV ratios. The WMLV/eTIV ratio was transformed using a common logarithm due to its skewed distribution. The shape of the associations of daily green tea consumption levels with the geometric mean of WMLV/eTIV among older adults without dementia in the multivariable-adjusted model was examined using a general linear model with restricted cubic splines, in which knots were positioned at the 5th, 35th, 65th, and 95th percentiles (0, 300, 600, and 1500 ml/day) of daily green tea consumption.
The association between daily green tea consumption and the WMLV/eTIV ratio relative to the reference value in older adults without dementia was also analyzed using multivariate-adjusted models. The reference value was set at 200 ml/day, which corresponds to one cup of green tea.
Model 1 was adjusted for age, sex, research site, and education level. Model 2 was further adjusted for hypertension, diabetes mellitus, ApoE ε4 allele, BMI, serum LDL and HDL cholesterol levels, smoking and drinking habits, electrocardiogram abnormalities, history of stroke, depressive symptoms (GDS score), cognitive function (MMSE score), and regular exercise. Statistical significance was set at P < 0.05. All statistical analyses were performed using the SPSS software package (version 29; SPSS Inc., Chicago, IL, USA) and SAS version 9.4 (SAS Institute, Cary, NC).
After excluding 1519 participants with MCI at baseline, a sensitivity analysis was conducted for all participants. The relationship between green tea consumption and cerebral white matter lesions was also analyzed based on the presence or absence of the ApoE ε4 allele and depression.
Data availability
The datasets used in the present study are not publicly available, because they contain confidential clinical data on the study participants. However, the data are available on reasonable request and with the permission of the Principal Investigator of this study, Toshiharu Ninomiya.
Code availability
No custom code or mathematical algorithm was developed for this study. Details regarding the specific codes used can be found in the references cited. Any access restrictions or licensing information associated with the codes used can be obtained from the respective sources as indicated in the references.
References
-
Noguchi-Shinohara, M. et al. Consumption of green tea, but not black tea or coffee, is associated with reduced risk of cognitive decline. PLoS One 9, e96013 (2014).
Google Scholar
-
Shirai, Y. et al. Green tea and coffee intake and risk of cognitive decline in older adults: the National Institute for Longevity Sciences, Longitudinal Study of Aging. Public Health Nutr. 23, 1049–1057 (2020).
Google Scholar
-
Matsushita, N. et al. Association of coffee, green tea, and caffeine with the risk of dementia in older Japanese people. J. Am. Geriatr. Soc. 69, 3529–3544 (2021).
Google Scholar
-
Liu, Q. P. et al. Habitual coffee consumption and risk of cognitive decline/dementia: A systematic review and meta-analysis of prospective cohort studies. Nutrition 32, 628–636 (2016).
Google Scholar
-
Feng, L. et al. Cognitive function and tea consumption in community dwelling older Chinese in Singapore. J. Nutr. Health Aging 14, 433–438 (2010).
Google Scholar
-
Zhang, Y. et al. Consumption of coffee and tea and risk of developing stroke, dementia, and poststroke dementia: A cohort study in the UK Biobank. PLoS Med. 18, e1003830 (2021).
Google Scholar
-
Leung, L. K. et al. Theaflavins in black tea and catechins in green tea are equally effective antioxidants. J. Nutr. 131, 2248–2251 (2001).
Google Scholar
-
Miller, N. J. et al. The antioxidant properties of theaflavins and their gallate esters-radical scavengers or metal chelators? FEBS Lett. 392, 40–44 (1996).
Google Scholar
-
Lagha, A. B. et al. Black tea theaflavins attenuate Porphyromonas gingivalis virulence properties, modulate gingival keratinocyte tight junction integrity and exert anti-inflammatory activity. J. Periodontal. Res. 52, 458–470 (2017).
Google Scholar
-
Socała, K. et al. Neuroprotective Effects of Coffee Bioactive Compounds: A Review. Int J. Mol. Sci. 22, 107 (2020).
Google Scholar
-
Grelle, G. et al. Black tea theaflavins inhibit formation of toxic amyloid-β and α-synuclein fibrils. Biochemistry 50, 10624–10636 (2011).
Google Scholar
-
Ano, Y. et al. Theaflavins Improve Memory Impairment and Depression-Like Behavior by Regulating Microglial Activation. Molecules 24, 467 (2019).
Google Scholar
-
Nanjo, F., Mori, M., Goto, K. & Hara, Y. Radical scavenging activity of tea catechins and their related compounds. Biosci. Biotechnol. Biochem. 63, 1621–1623 (1999).
Google Scholar
-
Molino, S. et al. Polyphenols in dementia: From molecular basis to clinical trials. Life Sci. 161, 69–77 (2016).
Google Scholar
-
Spagnuolo, C., Moccia, S. & Russo, G. L. Anti-inflammatory effects of flavonoids in neurodegenerative disorders. Eur. J. Med. Chem. 153, 105–115 (2018).
Google Scholar
-
Ninomiya, T. et al. Study design and baseline characteristics of a population-based prospective cohort study of dementia in Japan: the Japan Prospective Studies Collaboration for Aging and Dementia (JPSC-AD). Environ. Health Prev. Med. 25, 64 (2020).
Google Scholar
-
Noguchi-Shinohara, M. et al. Diabetes Mellitus, Elevated Hemoglobin A1c, and Glycated Albumin Are Associated with the Presence of All-Cause Dementia and Alzheimer’s Disease: The JPSC-AD Study. J. Alzheimers Dis. 85, 235–247 (2022).
Google Scholar
-
Shima, A. et al. Glucose metabolism and smaller hippocampal volume. NPJ Aging 10, 39 (2024).
Google Scholar
-
Zhang, S. et al. Green tea consumption is associated with annual changes in hippocampal volumes: A longitudinal study in community-dwelling middle-aged and older Japanese individuals. Arch. Gerontol. Geriatr. 96, 104454 (2021).
Google Scholar
-
Mayer, C. et al. Association between Coffee Consumption and Brain MRI Parameters in the Hamburg City Health Study. Nutrients 15, 674 (2023).
Google Scholar
-
Royse, S. K. et al. Unhealthy white matter connectivity, cognition, and racialization in older adults. Alzheimers Dement. 10, 1483–1496 (2024).
Google Scholar
-
Habes, M. et al. The brain chart of aging: Machine‐learning analytics reveals links between brain aging, white matter disease, amyloid burden, and cognition in the iSTAGING consortium of 10,216 harmonized MR scans. Alzheimers Dement. 17, 89–102 (2021).
Google Scholar
-
Habes, M. et al. White matter hyperintensities and imaging patterns of brain ageing in the general population. Brain 139, 1164–1179 (2016).
Google Scholar
-
Puzo, C. et al. Independent effects of white matter hyperintensities on cognitive, neuropsychiatric, and functional decline: a longitudinal investigation using the National Alzheimer’s Coordinating Center Uniform Data Set. Alz. Res. Ther. 11, 64 (2019).
Google Scholar
-
Mahdavi-Roshan, M., Salari, A., Ghorbani, Z. & Ashouri, A. The effects of regular consumption of green or black tea beverage on blood pressure in those with elevated blood pressure or hypertension: A systematic review and meta-analysis. Complement. Ther. Med. 51, 102430 (2020).
Google Scholar
-
Peng, X. et al. Effect of green tea consumption on blood pressure: A meta-analysis of 13 randomized controlled trials. Sci. Rep. 4, 6251 (2014).
Google Scholar
-
Stangl, V., Lorenz, M. & Stangl, K. The role of tea and tea flavonoids in cardiovascular health. Mol. Nutr. Food Res. 50, 218–228 (2006).
Google Scholar
-
Sun, Y. et al. Extra cup of tea intake associated with increased risk of Alzheimer’s disease: Genetic insights from Mendelian randomization. Front Nutr. 10, 1052281 (2023).
Google Scholar
-
Moore, R. J., Jackson, K. G. & Minihane, A. M. Green tea (Camellia sinensis) catechins and vascular function. Br. J. Nutr. 102, 1790–1802 (2009).
Google Scholar
-
Fraser, M. L., Mok, G. S. & Lee, A. H. Green tea and stroke prevention: Emerging evidence. Complement. Ther. Med. 15, 46–53 (2007).
Google Scholar
-
Afzal, M., Safer, A. M. & Menon, M. Green tea polyphenols and their potential role in health and disease. Inflammopharmacol 23, 151–161 (2015).
Google Scholar
-
Levites, Y., Amit, T., Mandel, S. & Youdim, M. B. H. Neuroprotection and neurorescue against Aβ toxicity and PKC‐dependent release of non‐amyloidogenic soluble precursor protein by green tea polyphenol (‐)‐epigallocatechin‐3‐gallate. FASEB J. 17, 1–23 (2003).
Google Scholar
-
Ehrnhoefer, D. E. et al. EGCG redirects amyloidogenic polypeptides into unstructured, off-pathway oligomers. Nat. Struct. Mol. Biol. 15, 558–566 (2008).
Google Scholar
-
Nila, I. S. et al. Effect of Daily Coffee Consumption on the Risk of Alzheimer’s Disease: A Systematic Review and Meta-Analysis. J. Lifestyle Med. 13, 83–89 (2023).
Google Scholar
-
Wang, B. et al. Association between coffee and tea consumption and the risk of dementia in individuals with hypertension: a prospective cohort study. Sci. Rep. 14, 21063 (2024).
Google Scholar
-
Eskelinen, M. H. et al. Midlife coffee and tea drinking and the risk of late-life dementia: a population-based CAIDE study. J. Alzheimers Dis. 16, 85–91 (2009).
Google Scholar
-
Sugiyama, K. et al. Association between Coffee Consumption and Incident Risk of Disabling Dementia in Elderly Japanese: The Ohsaki Cohort 2006 Study. J. Alzheimers Dis. 50, 491–500 (2016).
Google Scholar
-
Jack, C. R. et al. The Alzheimer’s disease neuroimaging initiative (ADNI): MRI methods. Magn. Reson. Imaging 27, 685–691 (2008).
Google Scholar
-
Desikan, R. S. et al. An automated labeling system for subdividing the human cerebral cortex on MRI scans into gyral based regions of interest. NeuroImage 31, 968–980 (2006).
Google Scholar
-
Yesavage, J. A. & Sheikh, J. I. 9/Geriatric Depression Scale (GDS): Recent Evidence and Development of a Shorter Version. Clin. Gerontol. 5, 165–173 (1986).
Google Scholar
-
Momozawa, Y. et al. Low-frequency coding variants in CETP and CFB are associated with susceptibility of exudative age-related macular degeneration in the Japanese population. Hum. Mol. Genet. 25, 5027–5034 (2016).
Google Scholar
Acknowledgements
We would like to thank the participants for the contribution of their time to the JPSC-AD study. We would like to gratefully acknowledge the diligent work and contributions of all researchers and investigators in the JPSC-AD Study Group. Funding: This study was supported by the Japan Agency for Medical Research and Development (JP23dk0207053) and Suntory Holdings Limited (Osaka, Japan). The sponsor had no role in the design and conduct of the study; collection, management, analysis, and interpretation of the data; or preparation, review, or approval of the manuscript.
Author information
Authors and Affiliations
Consortia
Contributions
Research idea and study design: S.S., M.N.-S., Y.U., T.N., K.O.; Data acquisition: S.S., M.N.-S., Y.T., K.U., J.H., T.O., T.H., S.N., T.M., M.M., K.N., J.I., M.T.; Data analysis/interpretation: M.N.-S., T.N., K.O.; Statistical analysis: S.S., M.N.-S., T.N.; Supervision or mentorship: M.N.-S., T.N., K.O.; Each author contributed important intellectual content during manuscript drafting or revision and accepts accountability for the overall work by ensuring that questions pertaining to the accuracy or integrity of any portion of the work are appropriately investigated and resolved.
Corresponding authors
Ethics declarations
Competing interests
Toshiharu Ninomiya reports receiving grants from Suntory Holdings Limited. The remaining authors declare no competing interests.
Additional information
Publisher’s note Springer Nature remains neutral with regard to jurisdictional claims in published maps and institutional affiliations.
Supplementary information
Supplementary Information
Rights and permissions
Open Access This article is licensed under a Creative Commons Attribution-NonCommercial-NoDerivatives 4.0 International License, which permits any non-commercial use, sharing, distribution and reproduction in any medium or format, as long as you give appropriate credit to the original author(s) and the source, provide a link to the Creative Commons licence, and indicate if you modified the licensed material. You do not have permission under this licence to share adapted material derived from this article or parts of it. The images or other third party material in this article are included in the article’s Creative Commons licence, unless indicated otherwise in a credit line to the material. If material is not included in the article’s Creative Commons licence and your intended use is not permitted by statutory regulation or exceeds the permitted use, you will need to obtain permission directly from the copyright holder. To view a copy of this licence, visit http://creativecommons.org/licenses/by-nc-nd/4.0/.
Reprints and permissions
About this article
Cite this article
Shibata, S., Noguchi-Shinohara, M., Shima, A. et al. Green tea consumption and cerebral white matter lesions in community-dwelling older adults without dementia.
npj Sci Food 9, 2 (2025). https://doi.org/10.1038/s41538-024-00364-w
-
Received: 03 August 2024
-
Accepted: 18 December 2024
-
Published: 07 January 2025
-
DOI: https://doi.org/10.1038/s41538-024-00364-w