Abstract
Gastric cancer (GC) is a prevalent malignancy with high mortality rates. Immunogenic cell death (ICD) is a unique form of programmed cell death that is closely linked to antitumor immunity and plays a critical role in modulating the tumor microenvironment (TME). Nevertheless, elucidating the precise effect of ICD on GC remains a challenging endeavour. ICD-related genes were identified in single-cell sequencing datasets and bulk transcriptome sequencing datasets via the AddModuleScore function, weighted gene co-expression network (WGCNA), and differential expression analysis. A robust signature associated with ICD was constructed using a machine learning computational framework incorporating 101 algorithms. Furthermore, multiomics analysis, including single-cell sequencing analysis, bulk transcriptomic analysis, and proteomics analysis, was conducted to verify the correlation of these hub genes with the immune microenvironment features of GC and with GC invasion and metastasis. We screened 59 genes associated with ICD and developed a robust ICD-related gene signature (ICDRS) via a machine learning computational framework that integrates 101 different algorithms. Furthermore, we identified five key hub genes (SMAP2, TNFAIP8, LBH, TXNIP, and PIK3IP1) from the ICDRS. Through single-cell analysis of GC tumor s, we confirmed the strong correlations of the hub genes with immune microenvironment features. Among these five genes, LBH exhibited the most significant associations with a poor prognosis and with the invasion and metastasis of GC. Finally, our findings were validated through immunohistochemical staining of a large clinical sample set, and the results further supported that LBH promotes GC cell invasion by activating the epithelial–mesenchymal transition (EMT) pathway.
Introduction
Gastric cancer (GC) ranks fifth in terms of incidence and third in terms of mortality among all types of cancer worldwide1. Despite the rapid advancements in targeted therapy and immunotherapy for GC, their clinical benefits remain limited. Owing to the lack of obvious symptoms during its early stages, GC often progresses unnoticed. Moreover, as an aggressive form of malignancy, advanced GC has one of the poorest prognoses, with a 5-year survival rate of only approximately 6%. Therefore, there is an urgent need for early diagnosis and effective systemic drug therapy, particularly precision medicine approaches, to increase the survival rates of patients with GC.
In 2018, the Nomenclature Committee on Cell Death (NCCD) successfully identified a total of 12 distinct forms of programmed cell death (PCD)2. The phenomenon of immunogenic cell death (ICD) has attracted considerable attention in recent years. Essentially, ICD refers to the shift from nonimmunogenic tumor cell death to immunogenic tumor cell death, which promotes the antitumor immune response3. The process of ICD occurs within tumor cells, resulting in the generation of a cascade of signalling molecules referred to as damage-associated molecular patterns (DAMPs). These include calreticulin, which becomes exposed on the cell surface; HMGB1, which is secreted into the extracellular milieu by tumor cells; and other DAMPs. Furthermore, ATP molecules are released from cells along with HSP70 and HSP904. The release of DAMPs during ICD has the potential to engage with pattern recognition receptors (PRRs) present on dendritic cell (DC) surfaces, thereby triggering a series of cellular reactions that ultimately stimulate both innate and adaptive immune responses5. ICD, as a stress response of tumor cells, can activate the innate immune system of the human body, and assessment of the capacity for ICD in a single cell could provide valuable insights into the potential response to tumor immunotherapy. Extensive research has demonstrated the involvement of ICD in tumorigenesis and disease progression across diverse cancer types. For example, Song et al. reported significant upregulation of HSP90AA1, a pivotal regulator of ICD, in bladder cancer patients, which could serve as a reliable predictor of the immunotherapy response and contribute to precise treatment strategies for bladder cancer6. Cai et al. developed a risk prediction model for low-grade glioma based on ICD-related genes (ICDRGs) that provided insight into the molecular characteristics of the immune microenvironment7. Conversely, the effective induction of ICD within the tumor microenvironment (TME) has been found to trigger cancer cell apoptosis and necrosis. Moreover, combination therapies have been shown to potentiate their cytotoxic effects. For example, Li et al. recently demonstrated that oleandrin induces ICD in breast cancer through activation of the PERK/elF2α/ATF4/CHOP pathway, thereby facilitating tumor elimination and providing a pivotal foundation for developing therapeutic strategies against this malignancy8. However, in hepatocellular carcinoma, Yu et al. reported that icaritin exacerbates mitophagy and synergistically induces ICD in combination with doxorubicin, elucidating the anti-HCC mechanism of icaritin in mitophagy and revealing an effective immunotherapy strategy for HCC9. In mice with gastric cancer, icaritin-loaded PLGA nanoparticles were found to induce ICD and promote tumor infiltration10. Furthermore, although studies exist on the molecular classification of GC on the basis of ICD-related genes (ICDRGs), a comprehensive analysis of the molecular characteristics of ICD in GC through the integration of single-cell sequencing analysis (scRNA-seq) and machine learning techniques is currently lacking. Therefore, it is crucial to integrate machine learning methods with scRNA-seq analysis to establish a comprehensive research foundation for understanding the role of ICD in the occurrence, progression, clinical diagnosis, and treatment of GC.
In our study, we initially characterized molecular features related to ICD at the single-cell level in GC. An ICD score was subsequently assigned to each cell to classify the GC cells into high-score and low-score groups. Through differential gene expression analysis between these two groups and weighted gene co-expression network analysis (WGCNA) along with 10 machine learning methods, we identified characteristic ICDRGs specific to GC. Moreover, an ICD risk score model was developed for accurate prediction of GC prognosis. Finally, by integrating our findings, we observed that LBH, a pivotal gene linked to ICD, exhibited elevated expression in GC tissues and participated in diverse pathways related to carcinogenesis, including the epithelial–mesenchymal transition (EMT) pathway. This observation was further validated with publicly available bulk sequencing data, scRNA-seq data, and our own clinicopathological data.
Methods
Data collection
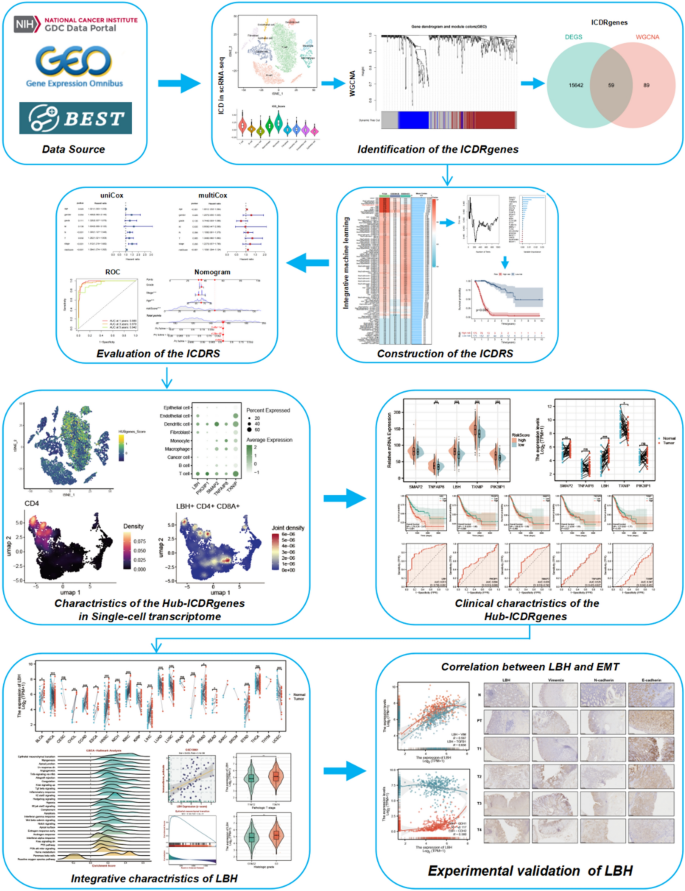
The workflow of this study is depicted in Fig. 1. The scRNA-seq dataset GSE183904 for GC was obtained from the GEO database (https://www.ncbi.nlm.nih.gov/geo/), and a subset of 9 GC tissue samples was selected for subsequent analysis. The bulk RNA-seq dataset for GC (GSE84437, comprising 483 tissue samples, along with the clinical and survival data of patients), was retrieved from the GEO database. Furthermore, batch RNA-seq data for samples from GC patients, including 32 normal tissue samples and 375 GC tissue samples, were collected from the TCGA database (https://Portal.gdc.cancer.gov/). Clinical and survival data of the patients were also collected. ICD-related genes were summarized from published articles and presented in Table S15,6,11,12,13,14.

Flowchart of this study.
Processing of scRNA-seq data
The scRNA-seq data obtained from the GC samples were subjected to single-cell analysis via the Seurat R package15. Initial data screening was conducted on the basis of the following criteria: a minimum of 400 genes and a maximum of 4000 genes were detected per individual cell, with the mitochondrial gene count limited to 15%. After filtration, a total of 16,239 cells remained. The SCTransform function from the Seurat package was employed for the integration and preprocessing of diverse single-cell transcriptome samples, thereby mitigating batch effects. The SelectIntegrationFeatures function was subsequently utilized to identify 5000 highly informative genes as anchors for integration with mutated genes. Next, RunPCA was applied to reduce the dimensionality of the PCA based on a dim value of 20. Further dimensionality reduction was performed using the UMAP method via the ElbowPlot function. Cluster analysis was conducted by applying the FindClusters function with a resolution set at 0.3. Ultimately, nine major cell types were identified on the basis of canonical cell markers. The AddModuleScore function was employed to generate an ICD score for each cell on the basis of the ICDRGs, and the cells were subsequently categorized into high- and low-ICD score groups. Ultimately, variations in ICD scores within each cell group were demonstrated.
Weighted gene co‑expression network analysis (WGCNA)
Weighted gene co-expression network analysis (WGCNA) is a systematic biological approach that aids in understanding gene association patterns across different samples, allowing the identification of gene sets that strongly correlate with each other16. In our study, we utilized the R package “WGCNA” to analyse TCGA-STAD bulk RNA-seq data. Initially, we determined an appropriate soft threshold β to construct a scale-free network on the basis of predefined criteria. Next, we transformed the weighted adjacency matrix into a topological overlap matrix (TOM) and calculated dissimilarity (dissTOM). To identify clusters and modules of genes, we employed the dynamic tree cut method. Finally, we selected the module with the highest correlation with gastric cancer (GC) for further analysis.
Differential gene analysis
The FindMarkers function was used to identify genes exhibiting differential expression between cells with high and low ICD scores (|logFC|> 1, p-value 2 and adjusted p-value < 0.0517. A total of 9184 up-regulated genes and 6517 downregulated genes were identified in gastric tumor tissues.
Prognostic model constructed via integrative machine learning methods
The DEGs identified through bulk RNA sequencing were subsequently compared with the genes present in the GC-related modules identified via WGCNA. These overlapping genes are believed to play a role in immunogenic cell death, both at the cell group and individual cell levels. As a result, we referred to these genes as hub genes associated with immunogenic cell death (hub-ICDRGs). This study identified 59 highly specific hub-ICDRGs, which were then subjected to 10 machine learning methods (for a total of 101 combinations) to establish a precise prognosis prediction model for GC. The machine learning methods employed in this study included ridge, CoxBoost, random survival forest (RSF), partial least squares regression for Cox (plsRcox), stepwise Cox, the generalized boosted regression model (GBM), LASSO, supervised principal component analysis (SuperPC), elastic net (Enet), and survival support vector machine (survival-SVM) methods18. The TCGA-STAD dataset was utilized as the training set, while the GSE84426 and GSE84433 datasets were employed as external validation sets for variable selection and model construction. We computed the concordance index (C-index) for each model across the training and validation sets and subsequently ranked the predictive performance on the basis of the average C-index, thereby establishing an immunogenic cell death-related signature (ICDRS) that accurately predicted the overall survival of patients with GC.
Construction of a predictive nomogram
We divided the patients in the TCGA-STAD cohort into two groups, the high-risk group and the low-risk group, on the basis of the median International Disease Risk Scale (ICDRS) risk score. We utilized the R package “survminer” to perform Kaplan‒Meier curve analysis to assess any differences in overall survival (OS) between these two groups (log-rank test, p < 0.05). Additionally, we employed the “timeROC” software package to conduct ROC analysis and evaluate how accurately the ICDRS predicts OS among patients with GC. Furthermore, we conducted univariate and multivariate Cox regression analyses on the TCGA-STAD dataset to determine whether the ICDRS can independently predict survival outcomes for GC patients. To improve our model's prognostic accuracy and predictive power, we constructed a nomogram that combines the ICDRS score and clinical features to predict the survival outcomes of patients with gastric cancer.
Single-cell sequencing landscape and clinical significance of key risk genes.
We identified SMAP2, TXNIP, TNFAIP8, LBH, and PIK3IP1 as the top five key risk-related genes in machine learning for further analysis. At the single-cell sequencing level, we utilized the AddModuleScore function to calculate a HUBgene score for each cell on the basis of the expression of these five genes and observed variations among different cell types. Finally, we employed the “scCustomize” R package to demonstrate the correlation between each key gene and T cells.
We subsequently performed differential expression analysis of five risk-related genes in the TCGA-STAD dataset and compared the high-risk and low-risk groups as well as the tumor and normal groups. We generated Kaplan‒Meier curves for overall survival and corresponding ROC curves to assess their predictive value. On the basis of these results, LBH emerged as a crucial factor in GC prognosis and was subsequently included in our comprehensive analysis.
To explore and validate the role of LBH in the gastric cancer immune microenvironment and tumor progression
Given the close association between LBH and the immune microenvironment, particularly T cells, in single-cell sequencing data, we conducted a comprehensive analysis of LBH via the BEST database (https://rookieutopia.com/app_direct/BEST/). We validated the positive correlation between LBH and the immune microenvironment features of GC, as well as its relationship with T cells, across five different GC cohorts. Furthermore, we demonstrated enrichment of highly expressed LBH genes in the GSEA-Hallmark gene set, indicating aberrant activity in pathways related to tumor invasion and metastasis, such as the EMT pathway. Through multiple validation cohorts, we further emphasized the role of LBH in promoting invasion and metastasis in GC. Finally, we verified the expression pattern of LBH and its correlation with proteins involved in the EMT pathway in normal gastric tissues, paracancerous tissues, and GC tissue samples collected at various T stages.
Clinical specimens
Gastric tumor and adjacent normal tissue samples, collected from 2018 to 2023 at Deqing People’s Hospital, were obtained from patients diagnosed with gastric cancer who underwent surgical procedures. The cutoff date for follow-up was March 2024, with all patients providing informed consent prior to the utilization of clinical data. The present study also obtained approval from the Ethics Committee of the Deqing People’s Hospital (LL2023-K157). Informed consent was obtained from all participants and/or their legal guardians. Research was performed in accordance with the Declaration of Helsinki.
Statistical analysis
The statistical analyses were performed via R software, specifically version R 4.3.1. To compare the clinical characteristics between the training and internal validation sets, we utilized the chi-square test. Additionally, for variables that did not follow a normal distribution, we employed the Wilcoxon test as a nonparametric approach to assess differences between them. We set the threshold for significance as p < 0.05.
Results
Molecular characteristics of immunogenic cell death at the single-cell level
The expression patterns of ICDRGs in GC were investigated at the single-cell level using scRNA sequencing data for 9 GC samples comprising a total of 16,239 cells. The batch effects on these samples were successfully removed by applying the Harmony algorithm (Figure S1A-B). Principal component analysis (PCA) was subsequently performed on the top 2000 hypervariable genes, and t-distributed stochastic neighbour embedding (t-SNE) was subsequently used for dimensionality reduction analysis. The clustering resolution was set at 0.3, resulting in the final partitioning of all cells into 13 distinct clusters (Figure S1C). Furthermore, we presented the distribution patterns of these 13 cell clusters among different samples (Fig. 2A). We employed the FindMarkers algorithm to identify the DEGs across 13 clusters and subsequently renamed these clusters on the basis of cell-specific marker genes. Ultimately, we identified 9 distinct cell types: T cells (n = 7156), B cells (n = 3577), cancer cells (n = 2087), macrophages (n = 895), monocytes (n = 652), fibroblasts (n = 847), dendritic cells (n = 536), endothelial cells (n = 371) and epithelial cells (n = 118) (Fig. 2B). Furthermore, we demonstrated the heterogeneity in gene content across distinct cellular populations and their distribution among diverse samples (Fig. 2C-D). With the exception of GSM5573487, all the other samples exhibited remarkable consistency in terms of their cellular composition. We subsequently generated a heatmap to visualize the expression patterns of marker genes within each individual cell (Fig. 2E). Next, we quantified the activity of ICD in various cell types by calculating the expression levels of 32 ICDRGs in all cells via the AddModuleScore algorithm in the Seurat R package. The distributions of the median ICD scores (Fig. 2F) and the continuous distributions of the ICD scores (Fig. 2G) are presented separately. T cells, macrophages, and monocytes exhibited increased ICD activity (Fig. 2H). According to the median ICD score, all cells were stratified into a high ICD score group and a low ICD score group, and differential gene expression analysis was subsequently performed. We subsequently identified 616 genes that exhibited significant differential expression. These genes were utilized for subsequent analyses (Table S2).

Molecular characteristics of immunogenic cell death at the single-cell level. (A) The distribution pattern of the 13 cell clusters among different samples. (B) 9 distinct cell types identified with the differentially expressed genes across 13 clusters. (C–D) The heterogeneity in gene content across distinct cellular populations and their distribution among diverse samples. (E) The expression patterns of marker genes within each individual cell. (F) The distribution of median ICD-scores. (G) The continuous distribution of ICD-scores. (H) T cells, macrophages, and monocytes exhibited heightened ICD activity.
Identification of hub modules in bulk RNA sequences
To identify modules significantly associated with GC, we performed weighted gene co-expression network analysis (WGCNA) on the TCGA-STAD dataset. Notably, a co-expression network was constructed using 616 DEGs identified at the single-cell sequencing level. We chose an optimal soft threshold power of 9 (R2 = 0.9) to guarantee a scale-free topological network (Figure S2; Fig. 3A). Three modules were subsequently obtained by setting the minimum module gene count to 50 and the MEDissThres to 0.25 (Fig. 3B). The results of the present study revealed a strong correlation (cor = 0.71) between the MEblue module and GC (Fig. 3C). Additionally, a highly significant correlation was observed in the scatter plot of gene significance (GS) and module membership (MM) within the MEblue modules (cor = 0.92, p = 2.9e − 61) (Fig. 3D). To elucidate the relationship between ICDRGs and GC tumorigenesis, we subsequently performed an analysis of DEGs between normal tissues and tumor tissues in the TCGA-STAD dataset. Ultimately, a total of 9184 upregulated genes and 6517 downregulated genes were identified in tumor tissues compared with normal tissues (Fig. 3E). By subsequently intersecting these DEGs with module genes from WGCNA, we successfully obtained a set of 59 coexpressed genes referred to as hub immunogenic cell death-related genes (hub-ICDRGs) (Fig. 3F). To investigate the specific interactions, functions, and prognostic implications of these 59 hub genes, we sequentially performed protein‒protein interaction (PPI) network mapping (Figure S3), gene ontology (GO) and Kyoto Encyclopedia of Genes and Genomes (KEGG) enrichment analysis19,20,21 (Fig. 3G; Table S3), univariate risk network mapping (p < 0.05) (Figure S4A), gene mutation analysis (Figure S4B), and copy number variation (CNV) frequency analysis (Figure S4C). These comprehensive analyses systematically elucidated the molecular characteristics of the 59 hub genes and their potential associations with GC. Notably, enrichment analysis revealed a significant correlation between these 59 genes and immune microenvironment features as well as cell migration and invasion in GC.

The identification of hub modules in bulk RNA sequences. (A) The optimal soft threshold with power = 9 (R2 = 0.9). (B) Three modules were obtained by setting the minimum module gene count to 50 and MEDissThres to 0.25. (C) A strong correlation (cor = 0.71) between the MEblue module and GC. (D) A highly significant correlation observed in the scatter plot of gene significance (GS) and module membership (MM) within the MEblue modules (cor = 0.92, p = 2.9e − 61). (E) A total of 9184 up-regulated genes and 6517 down-regulated genes were identified specifically in tumor tissues. (F) A set of 59 co-expressed genes referred to as hub immunogenic cell death-associated genes (hub-ICDRGs). (G) GO and KEGG enrichment analysis of these 59 hub genes..
Construction of prognostic signatures via multiple machine learning methods
To establish a precise and consistent signature related to immunogenic cell death, we employed 10 machine learning algorithms in 101 combinations. To increase the accuracy of these signatures, TCGA-STAD was utilized as the training set, whereas GSE84426 and GSE84437 were used as external validation sets. Through cross-validation, a total of 26 of the previously identified 59 hub-ICDRGs (SMAP2, TNFAIP8, CELF2, NR4A3, LBH, PRNP, TAP1, TUBA1A, TXNIP, FLNA, MBNL1, FKBP5, PIK3IP1, NR3C1, TSC22D3, MSN, CLEC2B, SELENOM, MYADM, SERPINB9, GNG2, ETS1, and MGAT1) were found to be consistently present in all three GC cohorts. These genes were included in the machine learning analysis. The training set included 101 prediction models utilizing a tenfold cross-validation framework, and the C-index was subsequently determined for both the training set and validation sets. Among the 101 algorithm combinations, the random survival forest (RSF) algorithm produced the five models with the highest average C-indexes. However, all of these models exhibited a significantly low C-index (0.53) in the external validation set (GSE84433); hence, we excluded them from further analysis. Notably, the combination of the StepCox[backward] + GBM algorithm consistently achieved a high C-index across the training and validation sets, establishing it as an exceptionally accurate prediction model (Fig. 4A). By employing the StepCox[backward] model, we successfully identified a set of 23 signature genes (Fig. 4B), and the GBM model revealed an additional set of 22 signature genes (Fig. 4C). Subsequently, this 22-gene signature was randomly compared within the three datasets, and this particular gene signature exhibited the highest level of accuracy across all three cohorts (Fig. 4D).

Construction of prognostic signatures based on multiple machine learning. (A) 10 machine learning algorithms in 101 combinations. (B) The StepCox [backward] model. (C) The GBM model. (D) This 22 gene signature was observed that this particular gene signature exhibited the highest level of accuracy across all three cohorts.
To streamline the prognosis prediction process, we selected the five most pivotal genes (hub genes: SMAP2 TXNIP, TNFAIP8, LBH, and PIK3IP1) identified in the TCGA-STAD dataset for further analysis. These genes were selected on the basis of their association with overall survival (OS) and other survival outcomes in individual patients and were used to construct a risk score (Table S4). The incidence of mortality gradually increased with increasing risk score (Fig. 5A). The OS of the high-risk group was significantly inferior to that of the low-risk group (Fig. 5B). Receiver operating characteristic (ROC) curve analysis revealed that the areas under the curve (AUCs) for the 1-, 3-, and 5-year interval risk scores in the TCGA-STAD cohort were 0.980, 0.978, and 0.942, respectively, indicating exceptional predictive performance (Fig. 5C). Univariate Cox regression analysis revealed significant correlations between age, T stage, N stage, overall disease stage, and the risk score and the prognosis of GC (Fig. 5D). Subsequent multivariate Cox regression analysis confirmed that both age and the risk score independently served as prognostic factors (Fig. 5E). Additionally, we performed a comparative analysis between the risk score AUC and other clinical characteristics, including age, sex, grade, TNM stage, and stage. The findings revealed that the risk score AUC was significantly superior to that of the other clinical features (Fig. 5F). Finally, we used the risk score and several other key clinical factors, such as grade, stage, and age, to develop a prognostic predictive nomogram (Fig. 5G).

Constructing a risk score based on the top five pivotal genes. (A) The incidence of mortality showed a gradual increase in correlation with the ascending risk score. (B) The overall survival (OS) of the high-risk group was significantly inferior to that of the low-risk group. (C) The receiver operating characteristic (ROC) curve analysis. (D) Univariate Cox regression analysis demonstrated significant correlations between age, T stage, N stage, overall disease stage, and risk-Score with the prognosis of gastric cancer. (E) Multivariate Cox regression analysis confirmed that both age and riskScore independently serve as prognostic factors. (F) The riskScore AUC exhibited significantly superior performance compared to other clinical features. (G) A prognostic predictive nomogram.
Molecular characteristics and clinical significance of hub genes in GC at the single-cell sequencing level and transcriptome level
Our previous analysis revealed that SMAP2, TXNIP, TNFAIP8, LBH, PIK3IP1 and other genes are central hub genes associated with GC. To comprehensively investigate the molecular characteristics of these pivotal genes in the TME of GC, we performed single-cell sequencing analysis on the top five genes (SMAP2, TXNIP, TNFAIP8, LBH, PIK3IP1) as shown in Fig. 4B. We initially employed the AddModuleScore algorithm to evaluate the activity of the five genes at the single-cell sequencing level, which we designated the HUBgenes_Score (Fig. 6A). Our analysis revealed distinct patterns in the distribution of HUBgenes_Score across various cell types, with significantly higher scores observed for T cells and dendritic cells (DCs) than for other cell populations (Fig. 6B). We subsequently generated a dot plot showing the average expression levels (Fig. 6C) and a UMAP map illustrating the expression trends of the five hub genes across different cells (Fig. 6D). Consistent with the HUBgenes_Score results, these genes were highly expressed in both T cells and DCs. Considering our previous findings indicating a consistently elevated ICD score in T cells, we hypothesize that T cells may play a crucial role in linking ICD to GC tumorigenesis and progression. Therefore, we performed a single-cell subclustering analysis exclusively on T cells. Following a series of standardized procedures, the T cells were further categorized into 14 distinct clusters (Fig. 6E). The “ggSCvis” R package was used to generate a two-dimensional density map illustrating the distribution patterns of CD4 + and CD8 + T cells (Fig. 6F). A dot plot was generated to demonstrate the average expression levels of these five key genes in different subclusters of T cells, aiming to explore their correlation with the proportions of T cells (Fig. 6G). Additionally, the “scCustomize” R package was used to generate a multigene joint density map for CD4 and CD8A along with these five genes (Fig. 6H). LBH, PIK3IP1, TNFAIP8, and TXNIP were correlated with the proportions of both CD4 + T cells and CD8 + T cells. However, SAMAP2 expression was strongly associated with the proportions of CD8A + T cells. These findings imply a strong association between hub genes and the proportions of immune cell types in the immune microenvironment of GC, particularly T cells.

Molecular characteristics and clinical significance of hub-genes in GC at single-cell sequencing level and transcriptome level. (A) The AddModuleScore () algorithm was employed to evaluate the activity of the five genes (HUBgenes_Score) at the single-cell sequencing level. (B) Higher scores were observed in T cells and dendritic cells (DCs) compared to other cell populations. (C–D) Dot plot (C) showing the average expression levels and UMAP map (D) illustrating the expression trends of the five hub genes across different cells. (E) The T cells were further categorized into 14 distinct clusters by single-cell subclustering analysis. (F) A two-dimensional density map illustrating the distribution patterns of CD4 + and CD8 + T cells. (G) The average expression level of these five key genes in different sub-clusters of T cells. (H) A multi-gene joint density map for CD4 and CD8A along with these five genes.
Multiple analyses indicated a significant association between LBH expression and the tumorigenesis and progression of GC
After investigating the molecular expression profiles of the five hub genes at the single-cell sequencing level and their associations with features of the GC TME, we observed significant positive correlations between the expression levels of these genes and the levels of various immune cells, particularly T cells. Thus, we next analysed the expression patterns of these five genes at the bulk transcriptome level in the TCGA-STAD dataset. We initially compared the differential expression of these five genes between groups with high- and low-risk scores, revealing that, except for SMAP2, the expression levels of the other 4 genes were significantly elevated in the high-risk group compared with the low-risk group (Fig. 7A). Additionally, we conducted differential expression analysis of paired samples from GC patients, which yielded results consistent with those for SMAP2 and LBH in the unpaired differential expression analysis. These genes were highly expressed in tumor tissues (Fig. 7B). However, contrary to the findings from the differential expression analysis of unpaired samples, the analysis of paired samples revealed downregulation of TXNIP expression in tumors (Fig. 7C). Furthermore, Kaplan‒Meier survival curve analysis revealed that increased LBH expression was predictive of poor overall survival among GC patients, with the AUC for survival analysis reaching its highest value at 0.813 (Fig. 7D‒E). These results suggest that, among these five hub genes, LBH might play a pivotal role in GC tumorigenesis and progression. Moreover, LBH is a highlight valuable marker for both the diagnosis and treatment of GC. Consequently, we selected LBH for further investigation. Through analysis of the TCGA pancancer database, we observed upregulation of LBH expression in most tumor s (Fig. 7F). However, within the TCGA-STAD clinical dataset, LBH expression was significantly greater in T3 and T4 samples than in T1 and T2 samples (Fig. 7G). Furthermore, LBH expression was greater in G3 samples than in G1 and G2 samples, indicating a significant association with poorer tumor progression in patients with GC (Fig. 7H). Consistent with these findings, disease-specific survival (DSS) and progression-free interval (PFI) analyses for TCGA-STAD revealed a negative correlation between LBH expression and survival rates among GC patients across all stages (Fig. 7I). The time-dependent areas under the ROC curves at 3, 5, and 8 years were all greater than 0.6, which demonstrates the accuracy of our survival analysis results (Fig. 7J). In conclusion, these results suggest that LBH is an important risk factor for GC tumorigenesis and progression.

Multiple analyses indicating a significant association between LBH and the tumorigenesis as well as progression of gastric cancer. (A) The differential expression of these five genes between groups with high and low risk scores. (B) The expressions of SMAP2, LBH, and TXNIP were notably upregulated in tumor tissues. (C) Paired difference analysis revealed downregulation of TXNIP expression in tumors. (D) Kaplan–Meier survival curve. (E) ROC curve (AUC) for survival analysis. (F) Upregulation of LBH expression in most tumors. (G) LBH expression was significantly higher in T3 and 4 compared to T1 and 2. (H) LBH expression was found to be higher in G3 than G1 and G. (I) DSS and PFI analyses for LBH in TCGA-STAD. (J) The time-dependent areas under the ROC curves at 3, 5, and 8 years.
LBH promotes the progression of GC through the EMT pathway
On the basis of the comprehensive analyses mentioned above, we identified LBH as a pivotal gene in GC development and prognosis evaluation. However, its impact on the GC microenvironment remains elusive. Considering that the findings from the scRNA-seq analysis suggested a robust correlation between LBH and T cells in the GC immune microenvironment, we investigated the association between LBH and GC immune scores across multiple external GC datasets. Consistently, our results revealed a significant positive correlation between LBH expression and the GC immune score (Fig. 8A). Furthermore, additional analyses were conducted to explore the relationship between LBH expression and the infiltration of CD4 + T cells and CD8 + T cells in these validation datasets (Fig. 8B). Similarly, there was a positive correlation between bulk transcriptome data-derived LBH expression levels and T-cell infiltration levels within the GC immune microenvironment (Fig. 8C). To investigate the specific pathways by which LBH influences the TME of GC, we performed GSEA-Hallmark enrichment analysis of LBH and its positively associated genes in the TCGA-STAD dataset. we used the median expression value of LBH as the threshold for dividing samples into groups to identify related genes. LBH-related genes were significantly enriched in cancer-related pathways, including the EMT pathway, the apical junction pathway, the angiogenesis pathway, and the hypoxia pathway (Fig. 8D). Notably, the EMT pathway was the most highly enriched pathway, suggesting that LBH may regulate GC cell invasion and metastasis through the modulation of EMT signalling (Fig. 8E).

Correlation between LBH and immune microenvironment of gastric cancer and its pathway enrichment analysis. (A) A significant positive correlation between LBH expression and GC immune-score. (B) The relationship between LBH expression and infiltration of CD4 + T cells as well as CD8 + T cells in these validation datasets. (C) Positive correlation between LBH expression levels and T cell infiltration levels in bulk transcriptome data. (D) Enrichment of LBH in cancer-related pathways. (E) EMT pathway exhibited the most prominent enrichment signal.
In terms of clinical data, analysis of multiple external datasets revealed a positive correlation between LBH expression and GC metastasis as well as between LBH expression and T stage (Fig. 9A-B). At the transcriptome level, the two-factor correlation map from TCGA-STAD indicated that LBH was positively correlated with genes involved in the EMT pathway, such as CDH2, TGFβ1, and VIM, but negatively correlated with CDH1, which serves as an epithelial marker (Fig. 9C). To further validate our bioinformatics analysis results, we collected immunohistochemical results from 24 samples of GC tumor s at different T stages along with adjacent and normal gastric tissues. Immunohistochemical staining revealed low expression levels of LBH in normal gastric tissues and paracancerous tissues. However, the protein levels of LBH increased with increasing T stage. Similar trends were observed for two classical EMT markers, vimentin and N-cadherin. Conversely, the epithelial marker E-cadherin exhibited high expression levels in normal gastric epithelial cells and adjacent normal tissues, but the levels gradually decreased with increasing T stage. This trend was the opposite of that for LBH and the other two proteins (Fig. 9D).

LBH promotes gastric cancer invasion through EMT pathway. (A–B) A positive correlation between LBH expression and GC metastasis (A) as well as T stage (B) in multiple external datasets. (C) The two-factor correlation map from TCGA-STAD. (D) Immunohistochemical staining of LBH and EMT-related markers in normal gastric tissues, paracancerous tissues, and different stages of GC.
By integrating the aforementioned bioinformatics results and validating them via analysis of clinical samples, we successfully identified LBH as a prognostic diagnostic marker for GC that plays a pivotal role in GC progression through the EMT pathway.
Discussion
Gastric cancer (GC) is currently the third leading cause of cancer-related mortality worldwide. Its unfavourable clinical prognosis and increased propensity for invasion and metastasis impose a great burden upon patients, and the underlying mechanism is unclear22,23. Cell death plays a pivotal role in organismal development and the maintenance of homeostasis. Various forms of cell death, including apoptosis, necroptosis, pyroptosis, and ferroptosis, not only participate in the elimination of damaged or obsolete cells but also play crucial roles in inhibiting pathogen dissemination24,25. However, since its proposal in 2005, the concept of immunogenic cell death (ICD) has regained attention among scientists26. ICD refers to cell death that can trigger an immune response. It is a specific type of regulated cell death induced by stress stimuli and is capable of eliciting adaptive immunity against antigens from dead cells27. In the context of tumor s, ICD represents the transition from nonimmunogenic tumor cell death to immunogenic tumor cell death and facilitates the antitumor immune response28,29. The involvement of ICD in tumorigenesis, invasion, and metastasis has been extensively reported across a diverse range of cancers8,30,31,32. Furthermore, prognostic models and markers associated with ICD have also been identified in GC, facilitating the exploration of its potential role in this disease33,34,35. However, these studies focused primarily on simple prediction methods based on a single omics analysis of bulk transcriptome sequencing data and failed to comprehensively elucidate the molecular characteristics of ICD in GC. Moreover, the underlying mechanisms through which ICD contributes to GC progression remain elusive.
In our study, we identified a total of 9 cell types from the scRNA-seq data of GC. Among these, T cells and monocytes/macrophages presented the highest ICD scores, indicating a strong association between ICD and these specific cell types in GC. The tumor microenvironment (TME) encompasses the surrounding milieu of tumor cells, comprising blood vessels, bone marrow-derived inflammatory cells, immune cells, diverse signalling molecules, fibroblasts, and the extracellular matrix (ECM)36,37,38. Within this intricate ecosystem, T cells and other immune cells intricately interact with tumor cells to collectively modulate and shape the growth niches of neoplastic entities and regulated their invasive potential and migratory behaviour39. The correlation between the hub gene LBH and the immune microenvironment features of GC patients, particularly the infiltration of CD4 + and CD8 + T cells, was statistically significant.
To identify the key ICD-related genes involved in GC and construct an accurate prognostic model, we integrated WGCNA with a comprehensive set of 101 algorithms comprising 10 machine learning methods to select ICD-related genes and develop a risk score model. The refined risk score model demonstrated significant efficacy in predicting the OS of patients with GC. Compared with other clinical factors, such as age, sex, grade, and TNM stage, our model exhibited superior predictive efficiency. The top 5 prognostic genes, namely, LBH, PIK3IP1, SMAP2, TNFAIP8, and TXNIP, were also investigated in subsequent experiments. To comprehensively characterize the molecular features of the top 5 genes in GC, we verified their cellular distribution, expression levels, clinical prognosis, and immune associations in an scRNA-seq dataset and multiple bulk transcriptome sequencing datasets. At the single-cell sequencing level, these five genes were expressed predominantly in T cells and dendritic cells, which aligns with the expression characteristics observed in previous ICD scores. These findings further demonstrated the close relationships among T cells, ICD, and GC cells. Furthermore, single-cell sequencing analysis of T-cell subsets revealed a significant correlation between the expression of these top five genes and CD4 + and CD8 + T-cell infiltration levels. The results of the differential expression analysis and clinical prognosis analysis demonstrated that LBH may play a pivotal role in GC tumorigenesis and prognosis evaluation. Notably, LBH was upregulated in GC and was found to be a significant predictor of poor overall survival (OS), disease-specific survival (DSS), and progression-free survival (PFS) among GC patients. Furthermore, analysis of public databases revealed a positive correlation between elevated LBH expression and advanced T stage as well as high tumor grade in GC patients. These findings further validate the tumor -promoting effect of LBH.
To investigate the specific molecular mechanism underlying the involvement of LBH in GC progression, we conducted GSEA-hallmark enrichment analysis and observed a significant association between LBH and various cancer-related pathways, particularly those related to tumor cell invasion and migration, such as EMT and angiogenesis. Through the mining of multiple GC public datasets, we concluded that LBH is significantly correlated with GC metastasis and T stage. Additionally, it was positively correlated with the EMT-related genes CDH2, VIM, and TGFB1 but negatively correlated with the epithelial marker CDH1. Therefore, our hypothesis is that LBH plays a crucial role in the invasion and metastasis of GC cells by modulating the EMT pathway. To further validate this hypothesis, we conducted immunohistochemical staining for LBH and EMT-related marker proteins via pathological sections obtained from patients with different T stages of GC as well as their adjacent normal tissues collected clinically. The results revealed low expression of LBH in both normal gastric tissues and adjacent GC tissues. The expression level of the LBH protein gradually increased as the T stage increased. Consistent changes were observed in the expression of EMT-related proteins such as vimentin and N-cadherin. However, the opposite trend was observed for the protein expression of the epithelial marker E-cadherin. These findings suggest that our study using clinical samples provides evidence for the involvement of LBH in regulating GC invasion through the EMT pathway.
In summary, our study focused on investigating the role and molecular characteristics of ICD in GC. For the first time, we employed a combination of weighted gene co-expression network analysis (WGCNA) and multiple machine learning algorithms to construct an ICD-related prognostic model. We present novel insights into the molecular mechanisms involved in the development and progression of gastric cancer, utilizing approaches from genomics, single-cell transcriptomics, and bulk transcriptomics. It can be used as a promising tool for prognosis prediction, prevention and personalized medicine in GC patients. Furthermore, we identified the molecular marker LBH through both single-cell sequencing and bulk transcriptome sequencing. Finally, immunohistochemistry of many clinical samples was performed to validate our findings. Our results provide compelling evidence supporting the involvement of LBH in regulating GC invasion via the EMT pathway.
Limitations
While our research has produced valuable findings, it is crucial to acknowledge certain limitations. Firstly, despite evaluating and validating the ICDRS signature across various sets, including training and external validation sets, further confirmation of our results necessitates large-scale prospective studies conducted at multi-centers. Secondly, additional in vitro and in vivo investigations are essential for elucidating the biological functions of LBH in GC.
Data availability
Data is provided within the manuscript or supplementary information files.
References
-
Smyth, E. C., Nilsson, M., Grabsch, H. I., van Grieken, N. C. & Lordick, F. Gastric cancer. Lancet (London, England) 396(10251), 635–648 (2020).
Google Scholar
-
Galluzzi, L. et al. Molecular mechanisms of cell death: Recommendations of the nomenclature committee on cell death 2018. Cell Death Differ. 25(3), 486–541 (2018).
Google Scholar
-
Kroemer, G., Galluzzi, L., Kepp, O. & Zitvogel, L. Immunogenic cell death in cancer therapy. Annu. Rev. Immunol. 31, 51–72 (2013).
Google Scholar
-
Li, Z. et al. Immunogenic cell death activates the tumor immune microenvironment to boost the immunotherapy efficiency. Adv. Sci. 9(22), 2201734 (2022).
Google Scholar
-
Galluzzi, L., Kepp, O., Hett, E., Kroemer, G. & Marincola, F. M. Immunogenic cell death in cancer: Concept and therapeutic implications. J. Transl. Med. 21(1), 162 (2023).
Google Scholar
-
Song, Q., Zhou, Z., Bai, J. & Liu, N. A comprehensive analysis of immunogenic cell death and its key gene HSP90AA1 in bladder cancer. Clin. Transl. Oncol. 25(8), 2587–2606 (2023).
Google Scholar
-
Cai, J. et al. Immunogenic cell death-related risk signature predicts prognosis and characterizes the tumour microenvironment in lower-grade glioma. Front. Immunol. 13, 1011757 (2022).
Google Scholar
-
Li, X. et al. Oleandrin, a cardiac glycoside, induces immunogenic cell death via the PERK/elF2α/ATF4/CHOP pathway in breast cancer. Cell Death Dis. 12(4), 314 (2021).
Google Scholar
-
Yu, Z., Guo, J., Hu, M., Gao, Y. & Huang, L. Icaritin exacerbates mitophagy and synergizes with doxorubicin to induce immunogenic cell death in hepatocellular carcinoma. ACS Nano. 14(4), 4816–4828 (2020).
Google Scholar
-
Xiao, Y. et al. Icaritin-loaded PLGA nanoparticles activate immunogenic cell death and facilitate tumor recruitment in mice with gastric cancer. Drug Deliv. 29(1), 1712–1725 (2022).
Google Scholar
-
Xu, M. et al. Immunogenic cell death-relevant damage-associated molecular patterns and sensing receptors in triple-negative breast cancer molecular subtypes and implications for immunotherapy. Front. Oncol. 12, 870914 (2022).
Google Scholar
-
Wang, Z. et al. Identification of key biomarkers associated with immunogenic cell death and their regulatory mechanisms in severe acute pancreatitis based on WGCNA and machine learning. Int. J. Mol. Sci. 24(3), 3033 (2023).
Google Scholar
-
Garg, A. D., De Ruysscher, D. & Agostinis, P. Immunological metagene signatures derived from immunogenic cancer cell death associate with improved survival of patients with lung, breast or ovarian malignancies: A large-scale meta-analysis. Oncoimmunology 5(2), e1069938 (2016).
Google Scholar
-
Wang, X. et al. An immunogenic cell death-related classification predicts prognosis and response to immunotherapy in head and neck squamous cell carcinoma. Front. Immunol. 12, 781466 (2021).
Google Scholar
-
Stuart, T. et al. Comprehensive integration of single-cell data. Cell 177(7), 1888 (2019).
Google Scholar
-
Langfelder, P. & Horvath, S. WGCNA: An R package for weighted correlation network analysis. BMC Bioinform. 9, 559 (2008).
Google Scholar
-
Ritchie, M. E. et al. limma powers differential expression analyses for RNA-sequencing and microarray studies. Nucl. Acids Res. 43(7), e47 (2015).
Google Scholar
-
Liu, J., Shi, Y. & Zhang, Y. Multi-omics identification of an immunogenic cell death-related signature for clear cell renal cell carcinoma in the context of 3P medicine and based on a 101-combination machine learning computational framework. EPMA J. 14(2), 275–305 (2023).
Google Scholar
-
Kanehisa, M. & Goto, S. KEGG: Kyoto encyclopedia of genes and genomes. Nucl. Acids Res. 28(1), 27–30 (2000).
Google Scholar
-
Kanehisa, M., Furumichi, M., Sato, Y., Kawashima, M. & Ishiguro-Watanabe, M. KEGG for taxonomy-based analysis of pathways and genomes. Nucl. Acids Res. 51(D1), D587–D592 (2023).
Google Scholar
-
Kanehisa, M. Toward understanding the origin and evolution of cellular organisms. Protein Sci. 28(11), 1947–1951 (2019).
Google Scholar
-
Thrift, A. P. & El-Serag, H. B. Burden of gastric cancer. Clin. Gastroenterol. Hepatol. 18(3), 534–542 (2020).
Google Scholar
-
Ajani, J. A. et al. Gastric cancer, version 2.2022, NCCN clinical practice guidelines in oncology. J. Natl. Compr. Canc. Netw. 20(2), 167–192 (2022).
Google Scholar
-
Newton, K., Strasser, A., Kayagaki, N. & Dixit, V. M. Cell death. Cell 187(2), 235–256 (2024).
Google Scholar
-
Hänggi, K. & Ruffell, B. Cell death, therapeutics, and the immune response in cancer. Trends Cancer 9(5), 381–396 (2023).
Google Scholar
-
Melero, I. et al. Immunogenic cell death and cross-priming are reaching the clinical immunotherapy arena. Clin. Cancer Res. 12(8), 2385–2389 (2006).
Google Scholar
-
Kroemer, G., Galassi, C., Zitvogel, L. & Galluzzi, L. Immunogenic cell stress and death. Nat. Immunol. 23(4), 487–500 (2022).
Google Scholar
-
Galluzzi, L. et al. Consensus guidelines for the definition, detection and interpretation of immunogenic cell death. J. Immunother. Cancer https://doi.org/10.1136/jitc-2019-000337corr1 (2020).
Google Scholar
-
Alzeibak, R. et al. Targeting immunogenic cancer cell death by photodynamic therapy: Past, present and future. J. Immunother. Cancer https://doi.org/10.1136/jitc-2020-001926 (2021).
Google Scholar
-
Yadollahvandmiandoab, R., Jalalizadeh, M., Buosi, K., Garcia-Perdomo, H. A. & Reis, L. O. Immunogenic cell death role in urothelial cancer therapy. Curr. Oncol. 29(9), 6700–6713 (2022).
Google Scholar
-
Chiaravalli, M. et al. Immunogenic cell death: An emerging target in gastrointestinal cancers. Cells 11(19), 3033 (2022).
Google Scholar
-
Xu, Z. et al. Mecheliolide elicits ROS-mediated ERS driven immunogenic cell death in hepatocellular carcinoma. Redox Biol. 54, 102351 (2022).
Google Scholar
-
Liu, Z. et al. An immunogenic cell death-related signature predicts prognosis and immunotherapy response in stomach adenocarcinoma. Apoptosis 28(11–12), 1564–1583 (2023).
Google Scholar
-
Gan, X., Tang, X. & Li, Z. Identification of immunogenic cell-death-related subtypes and development of a prognostic signature in gastric cancer. Biomolecules 13(3), 528 (2023).
Google Scholar
-
Meng, Y. et al. Definition of a novel immunogenic cell death-relevant gene signature associated with immune landscape in gastric cancer. Biochem. Genet. 61(5), 2092–2115 (2023).
Google Scholar
-
Junttila, M. R. & de Sauvage, F. J. Influence of tumour micro-environment heterogeneity on therapeutic response. Nature 501(7467), 346–354 (2013).
Google Scholar
-
Mhaidly, R. & Mechta-Grigoriou, F. Fibroblast heterogeneity in tumor micro-environment: Role in immunosuppression and new therapies. Semin Immunol. 48, 101417 (2020).
Google Scholar
-
Hoekstra, M. E., Vijver, S. V. & Schumacher, T. N. Modulation of the tumor micro-environment by CD8+ T cell-derived cytokines. Curr. Opin. Immunol. 69, 65–71 (2021).
Google Scholar
-
Lei, X. et al. CD4+ helper T cells endow cDC1 with cancer-impeding functions in the human tumor micro-environment. Nat. Commun. 14(1), 217 (2023).
Google Scholar
Author information
Authors and Affiliations
Contributions
SL Dai and JQ Pan were responsible for the conception of the study and drafting of the article. ZR Su conducted a thorough review of the article. SL Dai played a significant role in data collection, analysis, interpretation, and visualization. The final manuscript received unanimous approval from all authors. All authors actively contributed to the article’s content and endorsed its submission in its current form.
Corresponding author
Ethics declarations
Competing interests
The authors declare no competing interests.
Additional information
Publisher’s note
Springer Nature remains neutral with regard to jurisdictional claims in published maps and institutional affiliations.
Supplementary Information
Supplementary Tables.
Supplementary Figures.
Rights and permissions
Open Access This article is licensed under a Creative Commons Attribution-NonCommercial-NoDerivatives 4.0 International License, which permits any non-commercial use, sharing, distribution and reproduction in any medium or format, as long as you give appropriate credit to the original author(s) and the source, provide a link to the Creative Commons licence, and indicate if you modified the licensed material. You do not have permission under this licence to share adapted material derived from this article or parts of it. The images or other third party material in this article are included in the article’s Creative Commons licence, unless indicated otherwise in a credit line to the material. If material is not included in the article’s Creative Commons licence and your intended use is not permitted by statutory regulation or exceeds the permitted use, you will need to obtain permission directly from the copyright holder. To view a copy of this licence, visit http://creativecommons.org/licenses/by-nc-nd/4.0/.
Reprints and permissions
About this article
Cite this article
Dai, SL., Pan, JQ. & Su, ZR. Multi-omics features of immunogenic cell death in gastric cancer identified by combining single-cell sequencing analysis and machine learning.
Sci Rep 14, 21751 (2024). https://doi.org/10.1038/s41598-024-73071-x
-
Received: 22 July 2024
-
Accepted: 13 September 2024
-
Published: 18 September 2024
-
DOI: https://doi.org/10.1038/s41598-024-73071-x
Keywords
- Immunogenic cell death
- Multi-omics
- Gastric cancer
- LBH
- EMT
Comments
By submitting a comment you agree to abide by our Terms and Community Guidelines. If you find something abusive or that does not comply with our terms or guidelines please flag it as inappropriate.