Study population and setting
The data came from a cross-sectional sample of adolescents (13–18 years old; 7-11th graders) enrolled in 18 schools (10 urban and 8 rural) in the province of San José, Costa Rica, in 2017. Most Costa Rican adolescents (80%) are enrolled in school [13], and San José has the highest adolescent concentration (30%) in the country [14]. The study sample was estimated as previously described [9]. Students with signed informed assent and signed informed consent were selected to participate in the study. The final study sample was 818 adolescents aged 13 to 18 years. There was no sampling strategy of any kind regarding the determination of TEI from added sugars.
The study protocol was approved by the Bioethics Committee of the Costa Rican Institute for Research and Education on Nutrition and Health (INCIENSA) under number IC-2007–01.
Sociodemographic variables
A paper-based questionnaire was used to collect data on sex, age, area of residence, parental education level, ownership of goods and access to services (e.g., computers, internet, router, cable television, and water heating for the whole house), and family structure. The information on educational level and ownership of goods and access to services was used to classify the socioeconomic status (SES) using the k-means procedure [15].
Anthropometric assessment
Trained nutritionists measured height and weight following standardized procedures [16]. The body mass index (BMI) value for each participant was calculated from measured height and weight values using the standard equation: weight (kg)/height (m)2. Nutritional status was determined using the BMI Z-score for age, as recommended by World Health Organization [17]: < -2: underweight; ≥ -2 and < + 1: normal weight; ≥ + 1 and < + 2: overweight, and ≥ + 2: obesity. The categories of overweight and obesity were combined to provide a practical operationalization and interpretation of the weight status variable. Therefore, the nutritional status was operationalized as “overweight/obesity” vs. “non-overweight”.
Dietary intake assessment
Dietary intake data were collected via 3-day food records completed by the participants in real-time and reviewed by nutritionists. Participants were asked to complete a 3-day food record (two weekdays and one weekend day). Data were collected during nine months of the school year (February-November), reflecting seasonal variations for Costa Rica: rainy season (May–November) and dry season (December–April).
Epi Info™ software, version 3.5.4 [18], was used to process data from the 3-day food records, and the food and nutrients database of the School of Nutrition of the University of Costa Rica was used with this tool. Data were reported as means ± standard deviations (SD) for continuous variables and frequencies (%) for categorical variables.
Usual dietary intake
Multiple Source Method (MSM; https://msm.dife.de/tps/en), a web-based statistical modeling technique proposed by the European Prospective Investigation into Cancer and Nutrition (EPIC), was used to estimate usual energy and nutrient intakes [19]. The usual dietary intake is estimated with MSM by a 3 step-procedure: First, the probability of eating a specific food on a random day is estimated for each participant. Second, the usual amount of dietary intake on a consumption day is estimated using the inter- and intra-individual variance. Third, the resulting numbers from the first two steps are multiplied, to estimate the usual daily intake for each participant [20].
Vitamin A assessment
Dietary intake of vit-A was estimated using the database of the School of Nutrition of the University of Costa Rica [21]. Dietary intake of vit-A was determined per person per day and included vit-A from animal and vegetable sources and foods fortified with this nutrient in Costa Rica (sugar for household consumption and commercially pasteurized cow milk).
The nutritional adequacy of vit-A intake was calculated using the Estimated Average Requirement (EAR) for each category of sex and age of adolescents, according to the guidelines of the National Academy of Medicine (formerly the Institute of Medicine) of the United States [22]. Nutrient adequacy was calculated using the cut-off point method [23], as shown in Eq. 1.
$$%EAR=left(frac{Usual;Dietary;Intake;of;Vitamin;A}{Vitamin;A;EAR}right)times100$$
(1)
The EAR cut-point method was used because all the assumptions the Institute of Medicine indicated for its use were met [24]. A vit-A percentage of EAR (%EAR) less than 100% was considered indicative of inadequate vit-A intake [24].
Added sugars assessment
The dietary intake of added sugars was estimated as previously described [9]. Given that the World Health Organization (WHO) does not provide a specific recommendation for added sugars, the analyses used the recommendation of consuming < 10% TEI from added sugars (TEI-AS) established by the 2015–2020 edition of the Dietary Guidelines for Americans (DGA) as a basis for comparison [6].
Statistical analyses
The statistical analyses were performed in two steps. First, an exploratory analysis was performed to examine the association between some of the study variables. Second, an analysis was conducted to quantify the mediational effect on vit-A intake due to a change in the intake of added sugars.
Exploratory analysis
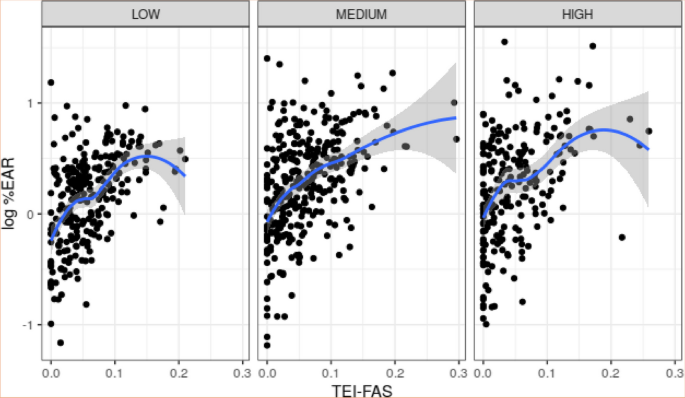
To determine the association between the variables included in the dataset, the correlation between quantitative variables was measured and the effect of the qualitative variables was analyzed using scatterplots and boxplots. In general terms, there is a positive association between log %EAR and TEI-FAS, regardless of socioeconomic status. The association between these variables was calculated using the Pearson correlation, which is 0.447 (p < 0.001). Moreover, for low and high socioeconomic statuses, a TEI-FAS level seems to exist such that there is a decrease in log %EAR for larger values of TEI-FAS. These details are shown in Fig. 2.

Association between the logarithm of %EAR (log %EAR) and TEI from fortified-added sugar (TEI-FAS) according to socioeconomic status
Furthermore, TEI-FAS appears to be slightly larger in rural versus urban areas. It is important to note that there is no substantial collinearity between TEI-FAS and TEI-AS, as evidenced by their Pearson correlation coefficient of approximately 0.316 (p < 0.001). This assures us that multicollinearity concerns are unlikely to affect the linear model we introduce in the following section.
Statistical mediation model
The statistical model used in this study follows the ideas of Imai [25, 26] in the sense that a hierarchical linear model formed by output and mediator components can isolate the mediational effect on an output or dependent variable (in this case, %EAR) under a given level of a treatment variable (in this case, TEI-AS). To reduce the effect of confounding factors, the TEI-FAS variable was incorporated into the model as a mediator variable, based on the apparent linear relationship between TEI-FAS and TEI-AS.
Based on the previous exploratory analysis and taking prior evidence into account [9, 27], a linear output model with log %EAR as the dependent variable was defined, using sex, age, and socioeconomic status as covariates, TEI-FAS as the quadratic function, and TEI-AS as the treatment variable. On the other hand, the mediator model has TEI-FAS as the dependent variable, with socioeconomic status and residence area as covariates, and TEI-AS as the treatment variable. Therefore, the model can be written as follows:
$$left{begin{array}{c}log %EAR = {alpha }_{0} + {alpha }_{1}Sex + {alpha }_{2}Age + {alpha }_{3}{SES}_{Low} + {alpha }_{4}{SES}_{Medium} + {alpha }_{5}TEI -FAS + {alpha }_{6}TEI – {FAS}^{2} + {alpha }_{7}chi TEI -AS, 1 + {alpha }_{8}chi TEI -AS, 2 + varepsilon TEI -FAS = {beta }_{0} + {beta }_{1}chi TEI -AS, 1 + {beta }_{2}chi TEI -AS, 2 + {beta }_{3}{SES}_{Low} + {beta }_{4}{SES}_{Medium} + {beta }_{5}{Area}_{Rural} + eta end{array}right.$$
(2)
where:
-
%EAR: nutrient adequacy, defined according to Eq. 1.
-
SES: socioeconomic status.
-
(TEI)–(FAS): total energy intake from fortified-added sugar.
-
(chi TEI)–(AS:) 0 if TEI-AS is less than 10%; 1 if TEI-AS is equal or greater than 10% and less than 20%, or 2 otherwise. The TEI-AS term is repeated because it is a categorical covariate with three levels, and then it is represented as two dummy variables in the linear model.
-
Area: residence area (rural, urban).
-
(varepsilon) and (eta) are non-correlated centered Gaussian errors.
The output and mediator models defined in Eq. 2 were fitted using the R package mediator [28]. This package offers a bootstrap-based approach [29] to determine the uncertainty of the average causal mediation effect (ACME) estimates, with bias correction [30]. The calculation of ACME estimates was performed with 1000 samples. Level 0 of TEI-AS (less than 10%) was considered as the baseline treatment status.
The fitting process on both models should be done individually, and maximum-likelihood criteria were used to perform that estimation [25]. Once both models were fitted, the mediation effect [31] was estimated through ACME [25, 26] as a way to quantify the potential outcome that results from a treatment change through the mediator variable. In this process, it was assumed that the treatment variable (TEI-AS) was randomized throughout the study. Moreover, to compute ACME effectively, it was assumed that the mediator variable was completely randomized under fixed values of the remaining covariates and the treatment variables. These hypotheses can be confirmed due to the sampling features of the study.
The uncertainty of ACME estimates was computed using Bootstrap. Bootstrap-based confidence intervals have been recommended in previous studies for the estimation of mediation effects [29]. To improve the precision of the ACME estimates, the bias-corrected version of those intervals was used in the calculations.
A complementary analysis was conducted to confirm the mediating effect of reducing TEI-AS on vit-A adequacy. This involved applying the reduction percentages of the %EAR of vit-A according to changes in TEI-AS (according to the < 10% TEI recommendation) to the original %EAR of vit-A for each individual.