Abstract
Climate advocates and finance industry titans suggest firms’ climate policies have economic payoffs. We examine whether stock markets reward firms that have joined the Science-Based Targets Initiative (SBTi), a voluntary climate program that verifies firms’ emission reduction pledges. Our analysis of S&P 500 companies’ quarterly stock prices for 2010–2023 finds little evidence that SBTi verification (of any type) increases stock prices. If stock markets are not incentivizing firms to voluntarily undertake climate actions, policymakers and climate advocates need to focus on providing nonfinancial rewards to encourage firms to invest in emission reductions.
Introduction
Climate change results from the overuse of the atmosphere as a sink for greenhouse gases. To limit the overuse of this global common pool resource1, a market failure, countries have announced net-zero emission targets2. To achieve this target, they have adopted a variety of policy instruments, including carbon pricing3,4. However, climate groups are frustrated by the failure of governments to accelerate decarbonization. They are suing governments in local, national, and international venues5, and embarking on radical actions such as museum protests to pressure governments for more vigorous steps to combat climate change6.
The twin failures of markets and governments7 to address the climate crisis have created the policy space for firm-led voluntary climate action in the form of corporate emission pledges8. For instance, in 2019, Amazon pledged to reach net-zero emission status by 2040. Furthermore, when announcing its Climate Pledge, Amazon invited other firms to join this effort. As of July 2024, 503 companies from 45 countries have pledged to achieve net-zero emissions by 20409.
The popularity of corporate emission pledges raises an important question: why should profit-seeking firms voluntarily incur private costs to create the global public good of climate mitigation via emission reductions? To address this issue, we draw on the literature on voluntary environmental programs (VEPs), which could be viewed as institutions that encourage participating firms to voluntarily produce environmental public goods (climate mitigation in our context) beyond the requirements of the law10,11,12,13,14. In return, participating firms secure reputational benefits with club good features in that they are nonrival (enjoyed by all VEP member firms) and excludable (limited to VEP members only). Reputational benefits can take many forms, including higher stock prices, regulatory relief from government agencies, and stakeholder goodwill. The logic is that the promise of excludable benefits (which can be enjoyed by VEP members only) motivates firms to voluntarily incur private costs to reduce emissions.
Yet, scholars question the effectiveness of voluntary measures in motivating environmental improvements and view them as greenwashes, namely “the practice of falsely promising an organization’s environmental efforts or spending more resources to promote the organization as green than are spent to actually engage in environmentally sound practices.”15,16 Scholars note that for VEPs to be effective in producing environmental public goods, they must monitor their members’ compliance through external third-party audits and verification.
However, monitoring and verification impose costs on participating firms. The implication is that firms might be more willing to incur the costs of joining VEPs with credible monitoring mechanisms if they have a reasonable assurance that they will be able to secure the payoffs from VEP membership. Stock market rewards might be an important component of this excludable benefit.
In this article, we focus on the stock market response to a leading climate-focused VEP: Science-Based Targets Initiative (SBTi). As a VEP, SBTi offers an institutional platform for firms to secure an external review and verification of their emission reduction pledges. Established in 2015, SBTi was born from the partnership between the United Nations Global Compact, the World Resources Institute, and the World Wildlife Fund for Nature. In 2022, CDP (formerly the Carbon Disclosure Project) also joined the partnership. Thus, SBTi is a coalition of technically competent non-profit organizations and an UN-affiliated body with expertise in climate policy and corporate social responsibility. Around 4000 firms worldwide have submitted their emission pledges for SBTi verification.
Joining SBTi requires firms to incur non-trivial costs. Unlike national net-zero emission pledges that allow countries to interpret their climate obligations in different ways and provide them loopholes to evade emission reductions2, SBTi has clear guidelines for firms to set up emission pledges17. Firms must establish near-term emission reduction targets (predominantly scope 1 and 2 emissions) that cover 5–10 years from the submission date. Unlike long-term targets which could span over 20 years (e.g., by 2045 or 2050), near-term targets impose costs on firms immediately.
The number of firms with SBTi-approved pledges has increased from 133 in 2018 to 2097 in 2022, covering about 34% of the global economy by market capitalization. Given the substantial costs firms incur to document emissions and meet the pledged reductions, what explains SBTI’s attractiveness?
This is where the role of VEPs’ reputational benefits with club-like features comes in. Firms invest vast resources to build corporate reputation because it has a payoff: by some measures, brand equity, a reputational attribute, accounts for about 20% of firms’ market capitalization18. Reputations allow stakeholders to evaluate different aspects of firm performance. Viewed this way, corporate reputations could improve firms’ relationship with regulators, cushion the negative impact of unfavorable events such as industrial accidents, lower the cost of capital, and attract and retain employees19.
We suggest that the stock market is the primary venue where reputational benefits translate into tangible rewards. Firms with higher reputations enjoy more positive evaluations of their performances20, which is reflected in their stock prices21. Pro-climate business leaders such as Larry Fink, the CEO of BlackRock, the world’s largest investing firm, claim that firms investing in climate actions will be rewarded with superior benefits22. Broadly, in recent years, stock markets have become vigilant about corporate climate actions. Credit rating agencies have started to incorporate firm-level climate-related indicators into their metrics. S&P published a report assessing the impact of transitional climate risk23, defined as a regulatory risk firms face when adjusting to climate regulations, on firms’ fiscal health24. Moody’s has announced that it plans to incorporate climate risk data into the rating of US commercial securities.
A recent study finds that SBTi verification helps firms improve the quality of their emission inventory reporting25. However, it is less clear if superior reporting also creates financial benefits (a payoff for joining this VEP) for firms. For instance, Republican Attorney Generals of several U.S. states have sued financial companies that employ ESG (environmental, social, and governance)—emission reductions being a critical element of the ESG approach. The U.S. House of Representatives Judiciary Committee is investigating collusion among financial companies to promote ESG. Thus, given the political controversy, financial investors may be less likely to reward firms that have joined SBTi and pledged to reduce emissions. Therefore, it is an empirical question whether stock markets reward firms joining SBTi.
To address this issue, we examine quarterly stock prices from 2010 to 2023 of S&P 500 firms that vary by their SBTi verification status. As of February 2024, 5 firms had their targets verified at the 2 °C level, 25 at well below the 2 °C level, and 102 at the 1.5 °C level. Also, 56 firms had committed to target verification in the future. The logic of the tiered VEP structure is that firms that have pledged a more aggressive emission reduction target should receive greater recognition from external stakeholders.
Using multiple empirical approaches (event study, matching, and weighted two-way fixed effect model), we find little evidence that SBTi membership (in any tier) increases stock prices. The implication is that if stock markets are not incentivizing firms to pledge climate actions voluntarily, policymakers and climate advocates need to focus on providing nonfinancial rewards to encourage firms to invest in emission reductions.
Results
Event study analysis
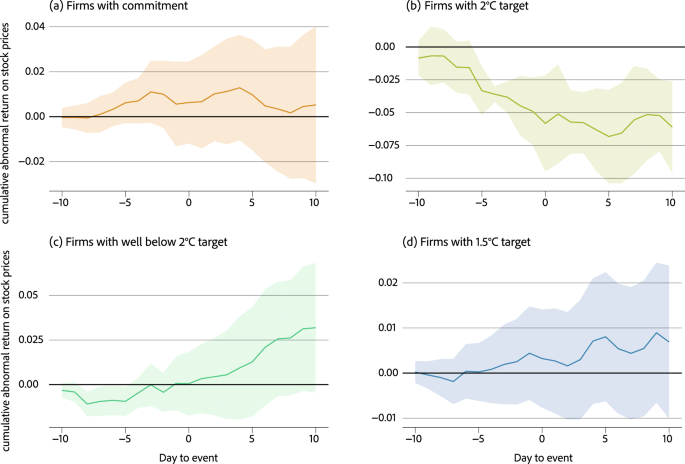
The first step employs event study analysis with four sub-sample groups: S&P 500 companies that have committed (Tier 4), verified 2 °C target (Tier 3), verified well below 2 °C target (tier 2), and verified 1.5 °C target (Tier 1). We expect that firms with SBTi membership with higher costs, e.g., verified 1.5 °C target as opposed to other tiers, should experience higher stock market rewards. We used WRDS Analytics (U.S. Daily Event Study) to run event study analyses26. All analyses used 100 days before the event date to estimate the coefficients (i.e., estimation window). Using these coefficients, we calculate the abnormal returns within ten days before and after the event date (i.e., event window).
Figure 1 visualizes the results of four event study analyses. It plots cumulative abnormal return on stock prices against day-to-event for each sub-sample group. None of our results indicate that any type of SBTi membership leads to significantly higher abnormal returns in stock prices. The results remain the same when we use the Fama-French Three Factor Model, which accounts for the size of firms and book-to-market values27. These additional results are accessible online (see “Data availability” and “Code availability”).

Each of the four plots above represents the sub-sample group: a Tier 4, b Tier 3, c Tier 2, and d Tier 1. Solid lines indicate the average cumulative abnormal return on stock prices at each day-to-event, and shaded areas indicate their 9% confidence interval.
Coarsened exact matching
In this approach, we compare firms that have not joined SBTi (control group; Tier 5) with those in Tier 1, 2, 3, and 4. In each comparison, firms in the control and treated groups are matched on the observed covariates. Then, we use an ordinary linear squares (OLS) regression to estimate the effect (the sample average treatment effect) of SBTi membership on stock prices (SBTi membership being the treatment). We include all covariates as control variables in the OLS regression. Table 1 summarizes the OLS results. None of these results suggest that SBTi membership of any type leads to higher stock prices.
Weighted two-way fixed effects
Finally, we report the results from weighted two-way fixed effect models (Table 2). Here, we also estimate four models, and each model compares non-members (Tier 5) with four groups of SBTi members, which vary by membership type (Tiers 1–4). We use the logarithmic transformation of firm size, total assets, total liabilities, and total market value to account for non-linearities across observations. We also include industry-fixed effects to account for the between-industry heterogeneity in the stock prices.
Consistent with the results from the two previous steps, the weighted two-way fixed effect models do not suggest that firms that joined SBTi (in any tier) experienced an increase in their stock market prices after joining it. However, our findings on the effect of the SBTi on stock prices need to be interpreted carefully. First, we focus on S&P 500 companies only. So, the results are not generalizable across all firms. Second, the number of treated firms (particularly in tiers 2 and 3) is small compared to that of firms in the control group. The solution to both these limitations is eventually expanding the sample beyond the S&P 500. The practical challenge is the high number of missing observations in control variables because data on smaller firms are less accessible.
Discussion
What might explain the lack of stock market appreciation for SBTi membership? Arguably, external stakeholders reward firms that have joined credible VEPs given concerns about greenwashing28. To be credible, VEP sponsors should have technical skills, no conflict of interest with their members, and credible monitoring and compliance features in the program design. While SBTi is sensitive to these issues, in recent years, it has been criticized for the validity of its verification methods. For instance, a recent study points out that SBTi allows firms to set a base year on their own—artificially high base year emissions might make it easier for firms to claim emission reductions in the future29,30. Our results, therefore, might reflect the stock market’s skepticism of SBTi pledges.
Yet, we recognize that firms might enjoy the reputational benefits of climate-VEP membership in ways other than stock market returns. Future work should explore whether SBTi membership impacts sales, employee retainment, or regulatory costs. However, our results offer some caution to proponents of voluntary pledges who might have oversold its profit impact. This poses a problem for the climate leaders who have sought to mobilize business support behind climate action using economic logic.
While stock markets may not support voluntary corporate climate pledges, we find that they do not hurt share prices either, as some conservatives have argued. Indeed, based on the argument that climate action hurts profits, several U.S. states, such as Texas, Florida, Louisiana, West Virginia, and Mississippi, have banned their state pension funds from investing in ESG-linked assets. Yet, not finding a negative reaction from the stock market may not sufficiently motivate firms to make substantively serious investments in climate actions solely on economic grounds. Arguably, policy rationale needs to be found outside the established financial criteria31 in terms of social and political legitimacy32,33. Future work should examine whether nonfinancial legitimacy might suffice to motivate voluntary corporate climate action without economic gains.
Although we examine SBTi-linked climate action focused on emission reductions, we recognize that other corporate climate policies might seek to enhance the resilience of firms’ operations or supply chains from climate-induced disruptions34. There is some work suggesting that bond raters reward cities that join adaptation-focused VEPs as opposed to mitigation-focused VEPs35, the rationale being that adaptation creates private benefits while mitigation benefits have public good features. Future work should explore whether the stock market response follows a similar pattern as bond ratings.
Our study has several limitations. As underscored earlier, we focus on S&P 500 companies only. Future work should look beyond these companies, especially because they are subject less to outside scrutiny and the media spotlight. Moreover, it is less clear that medium-sized or even small-scale companies would have the capacity and willingness to undertake climate action voluntarily, given its sizeable costs. If the smaller companies are connected with larger companies via supply chain connections, then voluntary climate action could be diffused through supply chain linkages, as documented in the case of other VEPs such as ISO 14001 and Responsible Care11,36.
VEPs can create positive benefits for members or shield them from negative events (such as product recalls, industrial accidents, advocacy action, regulatory problems, lawsuits, etc.), the so-called reputational cushion. While scholars have examined how industry-level VEPs may or may not provide a reputational cushion, future work should examine whether pan-industry climate VEPs such as SBTi provide reputational insurance to companies on climate issues.
Finally, since our main results rely on the matching techniques, they may depend highly on covariates used to conduct matching before estimation. Future research should expand the range of covariates for matching while minimizing bias from missing observations through a multiple imputation approach37.
Data and methods
S&P 500 firms and their SBTi membership status
We focus on S&P 500 companies because, given their size, they are likely to think carefully about how their corporate reputations affect stock prices38. Regarding their SBTi membership status, firms join (or do not join) SBTi in various ways:
Tier 1: 1.5 °C target: Firms pledge to establish emission reduction targets consistent with limiting global temperature rise below 1.5 °C compared to pre-industrial levels (102 companies).
Tier 2: Well below 2 °C target: Firms pledge to establish emission reduction targets consistent with limiting global temperature rise to well below 2 °C compared to pre-industrial levels (25 companies).
Tier 3: 2 °C target: Firms pledge to establish emission reduction targets consistent with limiting global temperature rise to 2 °C compared to pre-industrial levels (5 companies).
Tier 4: Committed: Firms join SBTi by committing to target verification in the near future but are still in the process of doing so (56 companies).
Tier 5: None of the above: Firms did not join SBTi (312 companies).
Empirical strategy
We analyze stock prices based on firms’ SBTi membership status in three ways. First, we use event study analysis39,40, a widely used approach to examine stock market performance in response to a specific corporate event. Our objective is to assess whether the stock prices of SBTi members increase once they have joined this climate VEP. Specifically, consistent with the literature, we focus on abnormal returns on stock prices, adjusting for the overall market price fluctuation.
Since event study analysis does not allow for between-firm comparison (i.e., comparing firms with and without SBTi membership), we employ two additional approaches to estimate the effect of SBTi membership on firms’ stock prices. Unlike event study analysis that uses daily stock prices, we focus on quarterly stock prices since most corporate indicators (control variables in our models) are reported quarterly. In the second approach, we employ a linear regression after matching observations (that is, matching companies that joined SBTi with the ones that did not) based on their covariates using coarsened exact matching41. In the third approach, we employ a weighted two-way fixed effects model42,43. We retrieved information on all covariates, including quarterly stock prices, from the Wharton Research Data Service COMPUSTAT—Capital IQ North Database.
Using both matching techniques and weighted two-way fixed effect model has several advantages. SBTi membership imposes substantial entry and compliance costs on firms. This creates a selection issue: firms with specific unobserved attributes might be more capable of and willing to seek SBTi verification. Hence, a simple between-firm comparison of stock prices may pose an endogeneity problem. Matching techniques seek to alleviate this problem by providing homogeneity among comparison groups based on observed covariates. Because simple matching does not consider the temporal variance of observed covariates, we employ weighted two-way fixed effects using propensity score weighting techniques with unit- and time-varying covariates.
Compared to ordinary two-way fixed effects models, the weighted model allows researchers to estimate a difference-in-difference estimator with multi-period treatment status across observations. Since S&P 500 companies in our sample have joined SBTi at different periods, we consider the weighted two-way fixed effect model superior to ordinary two-way fixed effect models.
Consistent with the literature, we match on and control for several firm-specific attributes. First, stock prices could reflect firm size44. Therefore, we use the total assets, total liabilities, and total market value to match and as control variables. Second, stock prices fluctuate based on firms’ current performance45,46. Therefore, we use the return on assets, the change in the current revenue (compared to the past revenue lagged by one quarter), and current dividends per share. Third, stock prices depend on firms’ ability to repay debts47, which is reflected in the cash ratio (total assets plus total cash holdings, divided by current liabilities) and debt ratio (total long-term debt in liabilities divided by total assets). Finally, we use a stock price lagged by one quarter as an additional covariate to account for the potential stickiness in the stock price behavior48.
Table 3 presents descriptive statistics of the covariates listed above. All covariates are in a million US dollars unless indicated as a percentage (%), except for dividends per share in US dollars.
Data availability
Data for the empirical analysis are accessible via Harvard Dataverse: https://doi.org/10.7910/DVN/IB5YPC.
Code availability
Code for the empirical analysis is accessible via Harvard Dataverse: https://doi.org/10.7910/DVN/IB5YPC.
References
-
Ostrom, E. A multi-scale approach to coping with climate change and other collective action problems. Solutions 1, 27–36 (2010).
-
Ko, I., Dolšak, N. & Prakash, A. Have renewable energy leaders announced aggressive emission reduction goals? Examining variations in the stringency of country-level net-zero emission pledges. PLoS Clim. 1, e0000094 (2022).
Google Scholar
-
Meckling, J. & Jenner, S. Varieties of market-based policy: instrument choice in climate policy. Environ. Polit. 25, 853–874 (2016).
Google Scholar
-
Baranzini, A. et al. Carbon pricing in climate policy: Seven reasons, complementary instruments, and political economy considerations. Wiley Interdiscip. Rev. Clim. 8, e462 (2017).
Google Scholar
-
Setzer, J. & Higham, C. Global Trends in Climate Litigation: 2021 Snapshot (London School of Economics, 2021).
-
Kinyon, L., Dolšak, N. & Prakash, A. When, where, and which climate activists have vandalized museums. NPJ Clim. Action 2, 27 (2023).
Google Scholar
-
Furton, G. & Martin, A. Beyond market failure and government failure. Public Choice 178, 197–216 (2019).
Google Scholar
-
Vogel, D. The Market for Virtue: The Potential and Limits of Corporate Social Responsibility (Brookings Institution Press, 2006).
-
The Climate Pledge. Signatories. https://www.theclimatepledge.com/us/en/Signatories (2024).
-
Cornes, R., & Sandler, T. The Theory of Externalities, Public Goods and Club Goods (Cambridge University Press, 1996).
-
Prakash, A. & Potoski, M. Racing to the bottom? Trade, environmental governance, and ISO 14001. Am. J. Polit. Sci. 50, 350–364 (2006).
Google Scholar
-
Borck, J. C. & Coglianese, C. Voluntary environmental programs: assessing their effectiveness. Ann. Rev. Environ. Res. 34, 305–324 (2009).
Google Scholar
-
DeLeon, P. & Rivera, J. E. (eds) Voluntary Environmental Programs: A Policy Perspective (Rowman & Littlefield, 2010).
-
Henriques, I. & Sadorsky, P. Voluntary environmental programs: a Canadian perspective. Policy Stud. J. 36, 143–166 (2008).
Google Scholar
-
Ramus, C. & Montiel, I. When are corporate environmental policies a form of greenwashing? Bus. Soc. 44, 377–414 (2005).
Google Scholar
-
Seele, P. & Gatt, L. Greenwashing revisited: In search of a typology and accusation-based definition incorporating legitimacy strategies. Bus. Strateg. Environ. 26, 239–252 (2017).
Google Scholar
-
SBTi Corporate Manual. https://sciencebasedtargets.org/resources/files/SBTi-Corporate-Manual.pdf (2023).
-
Knowles, J. How much of enterprise value is brand? https://www.linkedin.com/pulse/how-much-enterprise-value-brand-jonathan-knowles/ (2017).
-
Deephouse, D. Media reputation as a strategic source: an integration of mass communication and resource-based theories. J. Manag. 26, 1091–1112 (2000).
-
Bendig, D., Wagner, A. & Lau, K. Does it pay to be science-based green? The impact of science-based emission-reduction targets on corporate financial performance. J. Ind. Ecol. 27, 125–140 (2023).
Google Scholar
-
Vergin, R. C. & Qoronfleh, M. W. Corporate reputation and the stock market. Bus. Horizons 41, 19–26 (1998).
Google Scholar
-
Mahoney, P. & Mahoney, J. The new separation of ownership and control: institutional investors and ESG. Columbia Bus. L. Rev. 2021, 1–41 (2021).
-
Kölbel, J. F., Leippold, M., Rillaerts, J. & Wang, Q. Ask BERT: how regulatory disclosure of transition and physical climate risks affects the CDS term structure. J. Financ. Econ. 22, 30–69 (2024).
-
Lord, R., Bullock, S. & Birt, M. Understanding climate risk at the asset level: the interplay of transition and physical risks. www.spglobal.com/marketintelligence/en/documents/sp-trucost-interplay-of-transition-and-physical-risk-report-05a.pdf (2019).
-
Coen, D., Herman, K. S. & Pegram, T. Market masquerades? Corporate climate initiative effects on firm-level climate performance. Glob. Environ. Polit. 23, 141–169 (2023).
Google Scholar
-
Wharton Research Data Services (WRDS). U.S. daily event study. https://wrds-www.wharton.upenn.edu/pages/grid-items/us-daily-event-study-events-capital-iq/ (2024).
-
Fama, E. F. & French, K. R. The cross-section of expected stock returns. J. Financ. 47, 427–465 (1992).
-
Darnell, N., Potoski, M. & Prakash, A. Sponsorship matters: assessing business participation in government- and industry-sponsored voluntary environmental programs. J. Publ. Adm. Res. Theor. 20, 283–307 (2010).
Google Scholar
-
Rekker, S., Ives, M. C., Wade, B., Webb, L. & Greig, C. Measuring corporate Paris compliance using a strict science-based approach. Nat. Commun. 13, 4441 (2022).
Google Scholar
-
SBTi. Response to Nature Communications paper. https://sciencebasedtargets.org/blog/response-to-nature-communications-paper (2022).
-
Lopez, M., Garcia, A. & Rodriguez, L. Sustainable development and corporate performance: a study based on the Dow Jones Sustainability Index. J. Bus. Ethics 75, 285–300 (2007).
Google Scholar
-
Freeman, R. Strategic Management: A Stakeholder Approach (Pitman Publishing Inc, 1984).
-
Gunningham, N., Kagan, R. & Thornton, D. Social license and environmental protection: why businesses go beyond compliance. L. Soc. Inq. 29, 307–341 (2004).
Google Scholar
-
Beermann, M. Linking corporate climate adaptation strategies with resilience thinking. J. Clean. Prod. 19, 836–842 (2011).
Google Scholar
-
Ko, I. & Prakash, A. Signaling climate resilience to municipal bond markets: does membership in adaptation-focused voluntary clubs affect bond rating? Clim. Chang. 171, 9 (2022).
Google Scholar
-
Holtmaat, E. A., Adolph, C. & Prakash, A. The global diffusion of environmental clubs: how pressure from importing countries supports the chemical industry’s Responsible Care® program. World Dev. 127, 104735 (2020).
Google Scholar
-
Honaker, J., King, G. & Blackwell, M. Amelia II: a program for missing data. J. Stat. Soft. 45, 1–47 (2011).
Google Scholar
-
Preble, K. A. & Early, B. R. Enforcing economic sanctions by tarnishing corporate reputations. Bus. Polit. 26, 102–123 (2024).
-
Ball, R. & Brown, P. An empirical evaluation of accounting income numbers. J. Account. Res. 6, 159–178 (1968).
Google Scholar
-
Boehmer, E., Masumeci, J. & Polusen, A. B. Event-study methodology under conditions of event-induced variance. J. Financ. Econ. 30, 253–272 (1991).
Google Scholar
-
Iacus, S. M., King, G. & Porro, G. Causal inference without balance checking: coarsened exact matching. Polit. Anal. 20, 1–24 (2012).
-
Imai, K. & Kim, I. S. When should we use unit fixed effects regression models for causal inference with longitudinal data? Am. J. Polit. Sci. 63, 467–490 (2018).
Google Scholar
-
Imai, K., Kim, I. S. & Wang, E. H. Matching methods for causal inference with time-series cross-sectional data. Am. J. Polit. Sci. 67, 587–605 (2023).
Google Scholar
-
Caginalp, G. & Desantis, M. Stock price dynamics: nonlinear trend, volumes, volatility, resistance and money supply. Quant. Finan. 11, 849–861 (2011).
Google Scholar
-
Kraft, J. & Kraft, A. Determinants of common stock prices: a time series analysis. J. Financ. 32, 417–425 (1977).
Google Scholar
-
Patell, J. M. Corporate forecasts of earnings per share and stock price behavior: empirical test. J. Account. Res. 14, 246–276 (1976).
Google Scholar
-
Lucas, D. J. & McDonald, R. L. Equity issues and stock price dynamics. J. Financ. 45, 1019–1043 (1990).
Google Scholar
-
Sadorsky, P. The macroeconomic determinants of technology stock price volatility. Rev. Financ. Econ. 12, 191–205 (2003).
Google Scholar
Author information
Authors and Affiliations
Contributions
Both authors contributed equally to the paper.
Corresponding author
Ethics declarations
Competing interests
The authors declare no competing interests.
Additional information
Publisher’s note Springer Nature remains neutral with regard to jurisdictional claims in published maps and institutional affiliations.
Rights and permissions
Open Access This article is licensed under a Creative Commons Attribution-NonCommercial-NoDerivatives 4.0 International License, which permits any non-commercial use, sharing, distribution and reproduction in any medium or format, as long as you give appropriate credit to the original author(s) and the source, provide a link to the Creative Commons licence, and indicate if you modified the licensed material. You do not have permission under this licence to share adapted material derived from this article or parts of it. The images or other third party material in this article are included in the article’s Creative Commons licence, unless indicated otherwise in a credit line to the material. If material is not included in the article’s Creative Commons licence and your intended use is not permitted by statutory regulation or exceeds the permitted use, you will need to obtain permission directly from the copyright holder. To view a copy of this licence, visit http://creativecommons.org/licenses/by-nc-nd/4.0/.
Reprints and permissions
About this article
Cite this article
Ko, I., Prakash, A. Stock markets, corporate climate pledges, and the Science-Based Target Initiative.
npj Clim. Action 3, 69 (2024). https://doi.org/10.1038/s44168-024-00148-8
-
Received: 05 April 2024
-
Accepted: 24 July 2024
-
Published: 11 August 2024
-
DOI: https://doi.org/10.1038/s44168-024-00148-8