Abstract
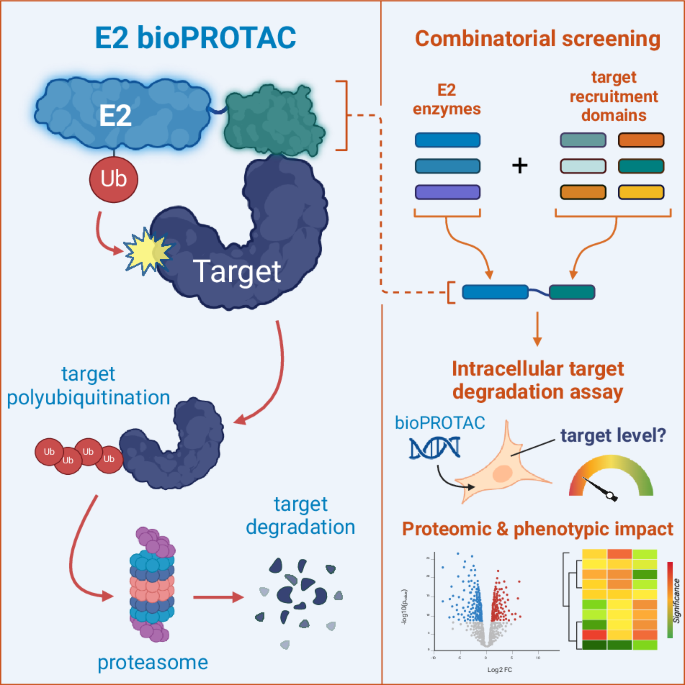
Proteins can be targeted for degradation by engineering biomolecules that direct them to the eukaryotic ubiquitination machinery. For instance, the fusion of an E3 ubiquitin ligase to a suitable target binding domain creates a ‘biological Proteolysis-Targeting Chimera’ (bioPROTAC). Here we employ an analogous approach where the target protein is recruited directly to a human E2 ubiquitin-conjugating enzyme via an attached target binding domain. Through rational design and screening we develop E2 bioPROTACs that induce the degradation of the human intracellular proteins SHP2 and KRAS. Using global proteomics, we characterise the target-specific and wider effects of E2 vs. VHL-based fusions. Taking SHP2 as a model target, we also employ a route to bioPROTAC discovery based on protein display libraries, yielding a degrader with comparatively weak affinity capable of suppressing SHP2-mediated signalling.

Introduction
Targeted protein degradation (TPD) provides an opportunity to directly edit the proteome and is therefore a complementary approach to genetic techniques, such as CRISPR and siRNA, for the interrogation of biological processes and intervention in disease states. TPD is commonly achieved by enhancing the recognition of a target protein by the Ubiquitin-Proteasome System (UPS) within mammalian cells1,2. The UPS is a complex intracellular cascade in which a hierarchy of enzymes and cofactors control the progressive covalent attachment of Ubiquitin (Ub) monomers to specific residues on endogenous proteins3. This modification with poly-Ub chains can result in recruitment of the protein to the 26S Proteasome, where it is unfolded and degraded3. Proteolysis-Targeting Chimeras (PROTACs) and ‘molecular glues’ are examples of small molecule degraders designed to co-recruit the protein of interest and a specific E3 ligase. Subsequent engagement of this tri-partite complex with an E2 ubiquitin-conjugating enzyme carrying Ub results in transfer of Ub to a primary amine on the target. While conceptually simple, small molecule-driven TPD depends on many complex factors, as reviewed elsewhere1,2,4,5.
A variety of biologics-based TPD approaches have been proposed to complement small molecule routes6. Historically, the most developed are ‘bioPROTACs’, which are fusion proteins constructed from an E3 ligase ‘degradation domain’ and a target-recruitment domain7,8,9,10,11. Delivered either by physical methods or (more often) as genetically-encoded constructs, E3 bioPROTACs capture protein targets and engage productively with E2 enzymes to enhance target degradation rates12,13,14,15,16,17. This format mimics the natural role for E3 ligases as substrate recruiters.
Concurrent to the development of these early E3 fusions, Gosink & Vierstra suggested that E2 enzymes also represent a viable bioPROTAC platform18. By fusing short epitope tags or naturally-occurring domains to plant-derived E2 enzymes they observed ubiquitination of model targets in recombinant protein assays. Despite this promising result, E2 enzymes were apparently not utilised for two decades as a platform for TPD until recent small-molecule approaches19,20.
Here, we report the use of human E2 enzyme fusions to induce the degradation of two human, disease-associated proteins—SHP2 and KRAS—within cancer cell lines21. We employed rational screening approaches to explore the behaviour of targeted UBE2D1 or UBE2B fusions and compare these with analogous fusions to the canonical E3 ligase von Hippel-Lindau (VHL)17. Through site-directed mutagenesis and UPS inhibitors we investigated the E2 bioPROTAC mechanism (see proposed scheme in Fig. 1a) and furthermore we utilised global proteomics to reveal the wider impact of E2- vs. VHL-based bioPROTACs. Next, we adopted a route to de novo bioPROTAC discovery using protein display libraries, yielding a degrader with comparatively weak affinity for its target. Finally, we show that certain SHP2-targeted bioPROTACs can impact downstream ERK signalling to a greater extent than inhibition alone.
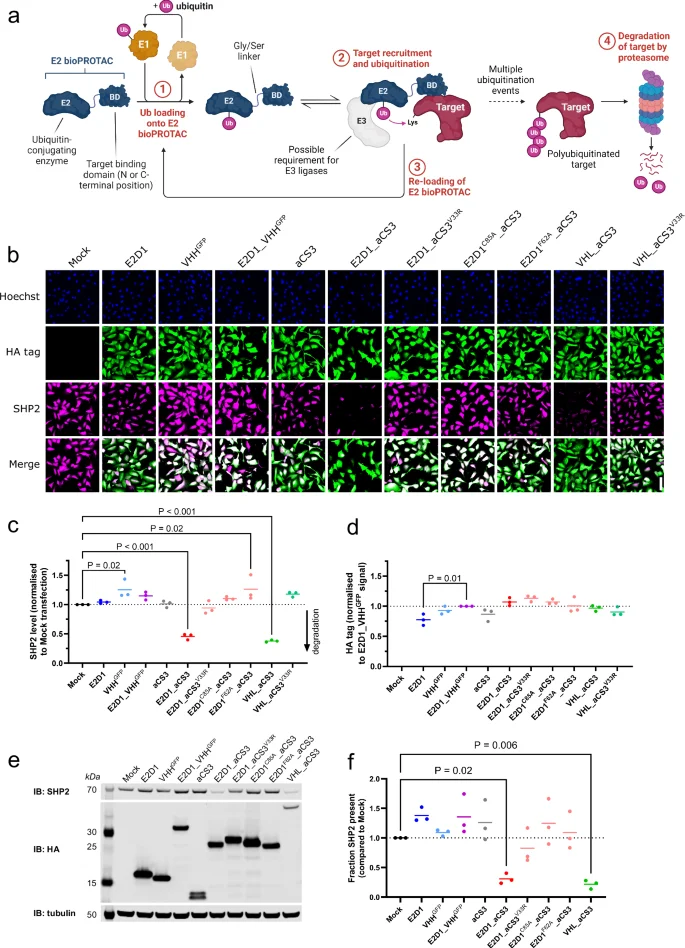
a Proposed intracellular biological mechanism for E2 bioPROTAC activity. Ubiquitin is first captured by the E2 enzymatic domain (step 1). The target protein is recruited via the attached binding domain [BD] and subsequently ubiquitinated (step 2). Re-loading of the E2 bioPROTAC (step 3) enables further target ubiquitination, ultimately leading to its degradation in the proteasome (step 4). Created with BioRender.com. b Immunofluorescence (IF) images of U2OS cells fixed 24 h after transfection with bioPROTAC or isotype control mRNAs. Scale bar (lower right corner image) = 100 µm. c, d Dot plots showing mean cellular SHP2 levels and expressed HA-tagged protein levels from IF images in (b). Data from three biological replicates. e Representative western blot of U2OS cells transfected with SHP2-targeted bioPROTAC or isotype control mRNAs and harvested after 24 h. f Mean SHP2 densitometry data from (e) (n = 3 biological replicates). Statistical significance for data in (c, d, f) was calculated using a one-way ANOVA.
Results
Degradation of SHP2 by an E2 bioPROTAC
To explore the use of E2 ubiquitin-conjugating enzymes within bioPROTACs, we first created a fusion between the enzyme UBE2D1 (hereafter, E2D1) and a lysine-free variant of aCS3, a domain which binds the protein tyrosine phosphatase SHP2 (PTPN11, Fig. 1a)21,22. E2D1 was chosen due to its widespread expression across human cell lines, its reported promiscuity and its ability to create degradation-specific (K48-Ub) polyubiquitin chains23,24,25. The two domains were linked by a (G4S)3 linker, chosen to allow independent folding of each domain and inter-domain flexibility.
The E2D1_aCS3 fusion was introduced as an mRNA into U2OS cells cultured in a 96-well plate and incubated for 24 h to allow bioPROTAC expression and activity. This genetic delivery method was chosen to enable transient, uniform, and reproducible expression of recombinant proteins within naïve host cells. We used immunofluorescence to provide endpoint quantification of the cellular levels of both SHP2 (Fig. 1b, c) and bioPROTAC (via an encoded HA tag, Fig. 1b, d). The E2D1_aCS3 fusion was associated with a 54 ± 6% (1 s.d.) loss of SHP2 compared to untransfected cells (Fig. 1c). No change in SHP2 levels was observed in cells transfected with mRNAs expressing either E2D1 or aCS3 alone, or a GFP-targeted isotype control (E2D1_VHHGFP). The active E2 fusion induced similar levels of SHP2 degradation as a previously-reported E3-ligase bioPROTAC, VHL_aCS3 (62 ± 2% SHP2 loss, Fig. 1b, c)26.
To confirm the integrity of over-expressed proteins and to obtain an orthogonal measurement of SHP2 degradation, we analysed the lysates of bioPROTAC-expressing U2OS cells by western blotting. Again, only the SHP2-targeted fusions (E2D1_aCS3 and VHL_aCS3) delivered significant SHP2 depletion (>75%) whereas control constructs had no effect (Fig. 1e, f). Thus, the strategy of fusing a binding domain to an E2 ubiquitin-conjugating enzyme was successful in yielding a targeted protein degrader.
Mutant E2 bioPROTACs are functionally impaired
A fundamental step in the E2 bioPROTAC cycle is target engagement. We therefore disrupted the interaction between active aCS3 fusions (E2D1 or VHL) and SHP2 by introducing the V33R mutation (numbering as in Sha et al.22). This increases the dissociation constant (KD) of the aCS3 domain from single-digit nM to ~1 µM22. As expected, the V33R-mutated E2D1- and VHL-based bioPROTACs were unable to induce SHP2 degradation (Fig. 1c, f)26.
Next, an E2 enzyme requires an active site cysteine to shuttle ubiquitin from an E1 enzyme to the target27. Mutation of this residue to alanine prevents Ub acquisition and thus serves as another negative control28. As expected, an E2D1C85A_aCS3 mutant had no effect on SHP2 levels within our assays, indicating that target engagement alone is insufficient for degradation (Fig. 1c, f).
Although our E2D1 bioPROTAC functioned as a SHP2 degrader, intracellular E3 ligases may modulate overall activity. For example, some E2 enzymes require an E3 ligase for full activity by controlling the orientation and dynamics of the ubiquitin25,29,30. Conversely, an E3 ligase may bring its own substrate to an Ub-loaded E2 bioPROTAC and may therefore compete with the desired target ubiquitination. To explore the reliance on E3 ligases within our proposed E2 bioPROTAC mechanism, we mutated a conserved loop residue in E2D1 (F62A) that is known to facilitate E3 ligase interactions31,32. The E2D1F62A_aCS3 mutant was unable to drive SHP2 degradation, indicating that E3 ligases are likely involved in the activity of E2D1-based bioPROTACs (Fig. 1c, f).
Enhanced SHP2 degradation via targeted UBE2B fusions
An initial screen of human E2 enzyme fusions targeting SHP2 indicated that the enzyme UBE2B (hereafter E2B) outperformed E2D1 as a degradation domain21. Consistent with this, both UBE2D-family and especially E2B were identified as particularly efficient degradation platforms within a recent proteome-wide proximity-inducing screen33. Furthermore, by sequence homology, UBE2B is the closest human E2 enzyme to UBC1, the Arabidopsis E2 enzyme successfully utilised by Gosink & Vierstra to ubiquitinate model targets (76% identity)18.
To explore further the effectiveness of E2B as a degradation domain, we transfected U2OS cells as above with mRNA encoding HA-tagged E2B_aCS3, or site-directed mutants thereof, and quantified their expression levels and effect on SHP2 after 24 hours by immunofluorescence (Fig. 2). The E2B_aCS3 fusion reduced SHP2 levels by ~90%, which outperformed both E2D1_aCS3 and VHL_aCS3 (Fig. 1c). As expected, the catalytic or weaker-binding mutants (E2BC88A_aCS3 or E2B_aCS3V33R, respectively) had no effect on SHP2 level, as did the GFP-targeted control fusion E2B_VHHGFP. Finally, we attempted to disrupt the interaction between RING E3 ligases and E2B_aCS3 by mutating N65 to alanine (i.e. equivalent to the E2D1F62A mutant above)34. However, the E2BN65A_aCS3 variant retained full activity against SHP2 suggesting that this mutation did not affect E3 ligase binding or possibly that E2B functions adequately without these co-factors (Fig. 2b)25.
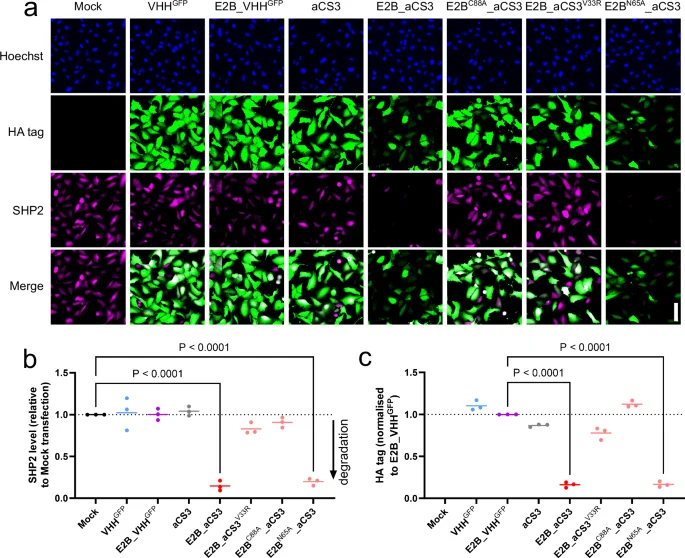
a Representative immunofluorescence images of U2OS cells 24 h post-transfection with E2B_aCS3 mRNA, or isotype controls. Scale bar (lower right corner image) = 100 µm. b, c Dot plots showing mean cellular SHP2 levels and expressed HA-tagged protein levels from IF images in (a). Data from three biological replicates. Statistical significance was calculated using a one-way ANOVA.
Proteasomal degradation of E2 bioPROTAC substrates
To confirm that the enhanced depletion of SHP2 driven by our E2 bioPROTACs was dependent on the 26S proteasome we used the proteasomal inhibitor MG132. U2OS cells were transfected with a range of mRNAs encoding E2- or VHL-based bioPROTACS (or null mutants thereof) in the presence of 5 µM MG132 or DMSO control. To prevent general toxicity from affecting the result, we harvested the cells after just 8 hours and quantified the cellular levels of each bioPROTAC and SHP2 by western blotting. The SHP2 degradation induced by the E2 and VHL-based bioPROTACs was completely abolished by MG132 (Fig. 3a and Supplementary Fig. 1).

Western blots of U2OS cells transfected with mRNA encoding bioPROTACs, inactive variants or domains, and incubated in the absence (−) or presence (+) of a 5 µM MG132 for 8 h or b 1 µM MLN4294 for 24 h. Representative blots are shown from two biological replicates. Bar graphs display the mean SHP2 band densitometry relative to mock-transfected control cells (individual data points are shown for each replicate). Related to Supplementary Fig. 1.
Interestingly, proteasomal blockade increased the low steady-state levels of both wild type E2B_aCS3 and the affinity-reduced mutant (E2B_aCS3V33R), but not that of the more abundant catalytic mutant, E2BC88A_aCS3 (Supplementary Fig. 1b). This suggests that the E2B domain promotes self-clearance by auto-ubiquitination, irrespective of target binding25. Abolition of ubiquitin acquisition (via E2BC88A), or proteasomal blockade (by MG132) would reduce self-clearance and may explain these steady-state increases. In contrast, the expression levels of E2D1_aCS3 variants and VHL_aCS3 were largely insensitive to MG132 (Fig. 3a and Supplementary Fig. 1).
E2 bioPROTAC activity does not require CRL activation
The Cullin-RING E3 ligases (CRLs) are a large family of cofactors that present substrates to E2 enzymes. CRLs themselves become activated by conjugation with the Ub-like modifier NEDD8, which can be prevented by the inhibitor MLN492435,36. Given that E2 bioPROTACs recruit their substrates directly, yet some may be supported by E3 ligases, we explored if CRL activation is required for function. We transfected U2OS cells with mRNA encoding an active bioPROTAC (E2B_aCS3, E2D1_aCS3, or VHL_aCS3) or just aCS3 and also treated the cells with either 1 μM MLN4924 or dimethyl sulfoxide (DMSO) control. After 24 hours the cells were harvested and analysed by western blotting. We observed that MLN4924 had no effect on E2 bioPROTAC activity whereas it abolished, as expected, the SHP2 degrading activity of VHL_aCS3 (Fig. 3b)37. This result rules out the need for CRL neddylation for E2 bioPROTAC activity, however it remains possible that unmodified CRLs (or other E3 ligases) interact productively.
Intriguingly, although MLN4924 causes an accumulation of (non-ubiquitinated) CRL substrates, it had a negative impact on E2 bioPROTAC expression levels, particularly E2B_aCS3 (Fig. 3b)36. The enhanced depletion may be due to a continuation of normal E2 fusion clearance mechanisms (e.g. auto-ubiquitination) in the presence of MLN4924, which effectively creates an environment of reduced general competition for the 26S proteasome. Despite this depletion of E2 bioPROTAC, we observed no loss of efficacy against SHP2, however this also may also be explained by a general reduction in competing endogenous ubiquitinated substrates at the proteasome.
Temporal and dose-dependent behaviour of E2- vs. VHL-based bioPROTACs
Small molecule protein degraders are typically compared by measuring efficacy over time and also by titrating the molecule, yielding useful DC50 and Dmax values. While this is more challenging with biologics—due to inherent differences in transfection, expression and stability—we explored these characteristics for our E2 vs. VHL bioPROTACs.
The comparative expression levels of each bioPROTAC and their effect on SHP2 are shown above for 8 h (Fig. 3) and 24 h post-mRNA transfection (Fig. 1). At both points, E2B_aCS3 remained the strongest degrader (85–95% SHP2 loss across 8–24 h). E2D1_aCS3 had the slowest onset, with only ~30% depletion at the early timepoint and ~60% at 24 h. The E3 ligase benchmark construct VHL_aCS3 showed intermediate behaviour (an initial 60% SHP2 loss rising to >90% after 24 h).
We next explored longer experimental timescales, again analysing U2OS cells by western blotting at 24, 48 and 72 h post-transfection with a bioPROTAC or a VHHGFP control mRNA, or with an siRNA pair targeting shp2 transcripts (Supplementary Fig. 2a). The depletion of SHP2 by E2D1_aCS3 and VHL_aCS3 at 24 h was sustained until at least 48 h, however the target level had rebounded to ~50% by 72 h. E2B_aCS3 displayed a more dramatic loss of efficacy across 48–72 h which we attribute to its relative instability. We anticipate that sustained repression of target levels would be achievable by engineering stable cell lines to express these fusions38. Notably, the bioPROTACs reduced SHP2 levels much more rapidly than the siRNA approach. However the impact on SHP2 by this alternative modality did not plateau across the time period sampled; thus RNAi suppressed SHP2 for longer periods than the mRNA-encoded degraders.
Next, to explore dose-dependence at 24 h for E2 vs. VHL bioPROTACs, we treated U2OS cells with an increasing amount of active bioPROTAC mRNA (0–100 ng/well) using immunofluorescence as a readout. A dummy mRNA encoding VHHGFP (untagged) was included in transfection mixtures to ensure consistent cellular treatment. For the concentrations sampled we observed an almost binary response in SHP2 where even the lowest concentrations of 5–10 ng mRNA/well could achieve maximal SHP2 depletion (Supplementary Fig. 2b). Although we observed a dose-dependent increase in bioPROTAC expression level we did not observe a clear hook effect.
Optimisation of E2 bioPROTACs by combinatorial screening
E3 bioPROTACs and other induced-proximity modalities are typically developed by screening component domains12,39,40. We therefore screened E2D1/E2B bioPROTAC variants featuring an alternative SHP2-binding domain (NSa5)22, opposing construct orientations, or a shorter linker. As above, mRNA encoding each variant was transfected into U2OS cells, which were probed for SHP2 and bioPROTAC levels by immunofluorescence after 24 hours.
We observed that NSa5 could replace aCS3 as the SHP2-binding domain when fused to the C-terminus of either E2D1 or E2B, with no significant change in efficacy (Supplementary Fig. 3a). Reversing the construct orientation lead to a marked drop in efficacy for aCS3_E2D1, however both NSa5_E2 fusions retained activity. The expression of E2D1 fusions was consistent throughout, however E2B fusions showed higher expression when fused to NSa5 than aCS3 (Supplementary Fig. 3b). Finally, for three E2 fusions we reduced the linker length from 15 residues to just 5 but this had no impact on SHP2 degradation by these bioPROTACs (Supplementary Fig. 3c).
To summarise, this small design screen revealed that E2 bioPROTACs form a versatile degradation platform, showing tolerance to alternative construct designs and often achieving a efficacies similar to VHL fusions. However, testing a panel of variants is recommended as the outcome is likely to depend on the target and available binding domains.
Targeting E2 enzymes to degrade KRAS
To test the utility of E2 bioPROTACS against another disease-associated target, we engineered variants to degrade KRAS. Using the DARPin K19 (KD ≈ 10 nM), we first constructed lentiviral-encoded fusions to either E2D1 or VHL, in both orientations41,42. As isotype controls, we created fusions with a non-specific DARPin termed E3-543. Lentivirus have previously been used to deliver E3 bioPROTACs, thus we considered it important to test a range of E2 fusions via this widely-used platform44.
Following transduction of HCT116 cells with the lentiviral vectors, KRAS expression levels were determined by western blotting (Supplementary Fig. 4a). While both E2D1 and VHL fusions to K19 typically induced >70% KRAS loss, the E3 ligase fusion with K19 at the N-terminus was considerably less active42. We next transduced two additional cancer cell lines (U2OS and MDA-MB-231) with active or control E2D1 fusions and observed the same result as with HCT116 cells (Supplementary Fig. 4b).
As with SHP2, we subsequently compared E2B and E2D1 fusions to K19 or E3-5. Within U2OS cells, E2B_K19 yielded a KRAS degradation activity similar to E2D1_K19 (Supplementary Fig. 4c). In contrast, the reversed orientation construct (K19_E2B) showed no expression or no effect on KRAS. Thus in contrast to targeting SHP2, E2B did not outperform E2D1 as a degradation domain with KRAS.
To confirm KRAS depletion was specific to the E2 and VHL bioPROTACs, we introduced site-specific mutations to disrupt their activity. As expected, E2D1C85A fusions were unable to degrade KRAS (Supplementary Fig. 4d). Similarly, weakening target recognition by mutating both tryptophans in the K19 motif W35-G36-W37 to glycine (labelled K19GGG, unreported KD), resulted in loss of activity for the KRAS-degrading E2D1 and VHL fusions (Supplementary Fig. 4d)41.
Proteomic effects of SHP2-targeted bioPROTACs
To investigate the global proteomic effects of our SHP2-targeted E2 and VHL bioPROTACs, we used data-independent acquisition mass spectrometry (DIA-MS) methods to monitor the abundance of proteins within host cells45. U2OS cells were transfected with mRNA encoding a bioPROTAC variant or EGFP (as a negative control for transfection/expression), and harvested for analysis after a 24 hour incubation. From the set of 7657 proteins detected, hits were defined as displaying a ≥ 1.5-fold increase or decrease in expression compared to EGFP-expressing cells and an adjusted p-value below 0.05 (see Supplementary Data 1).
Each bioPROTAC variant was detectable and the amount of SHP2 depletion correlated with that observed by western blotting (Fig. 4a–g and Supplementary Fig. 5a–d). The more active SHP2-degrading fusions (E2B_aCS3 and VHL_aCS3) both yielded a SHP2 log2FC (fold change) value of around −1.9, which equates to a ~75% reduction. The less-active, E2D1-based bioPROTACs, using aCS3 or NSa5 as the recruiting domain, caused 56% and 42% SHP2 loss, respectively. As expected, site-specific mutants of E2D1_aCS3 (C85A, V33R, C85A + V33R, and F62A) did not significantly affect SHP2 levels (Fig. 4e–g and Supplementary Fig. 5c, d).
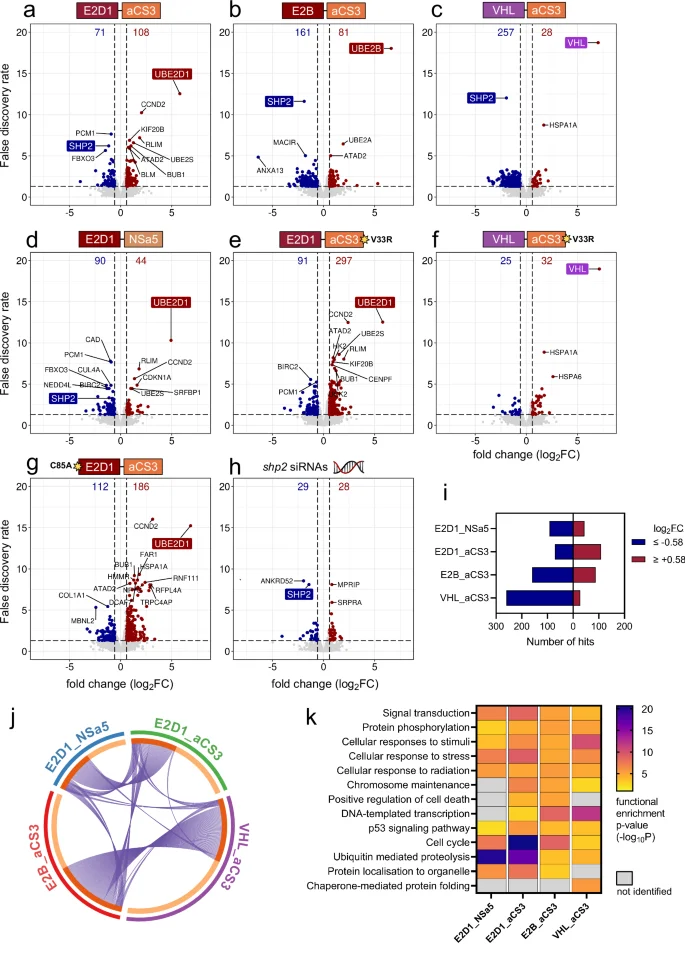
Volcano plots showing data for 7657 proteins from U2OS cells transfected with either a–g bioPROTAC mRNA (wild type or mutant, as indicated) or h an siRNA pair targeting shp2 transcripts. The degradation domain (e.g. E2D1) and SHP2 are highlighted on each plot. Dashed lines indicate significance thresholds (log2FC beyond ±0.58; adjusted p value < 0.05). Data obtained from four biological replicates. i Bar graph representing the numbers and distribution of proteomic hits for the active bioPROTACs. j Circos plot for the wild type bioPROTACs. Purple lines connect common hits present in ≥2 datasets. k Heatmap displaying functional enrichment analyses for the active bioPROTACs. Datasets were individually analysed within Metascape and curated to highlight the significant changes to biological pathways for each bioPROTAC. The individual cells are coloured according to the functional enrichment score (−10logP), with darker shading indicating greater statistical significance. Related to Supplementary Figs. 5–9 and Supplementary Data 1–3.
In parallel, we also depleted SHP2 from U2OS cells by RNA interference (RNAi) and collected global proteomics data46. A negative control siRNA was used as the background control sample. As the natural clearance rate of SHP2 was slow, the siRNA-treated cells were incubated for an additional 16 hours to achieve a level of SHP2 depletion analogous to the mRNA-delivered bioPROTACs (log2FC = −1.43, Fig. 4h). Thus, as above, the E2B and VHL bioPROTACs had a faster and deeper negative effect on SHP2 levels than the RNAi approach.
Each active bioPROTAC variant was associated with wider proteomic effects. Interestingly, the two stronger SHP2 degraders (E2B_aCS3 and VHL_aCS3) generated the most hits, which were also biased towards net degradation (Fig. 4i). The siRNA dataset contained the fewest hits—likely due to the slower loss of SHP2 coupled with inherent differences in biological mechanism.
Hit lists for each sample were next analysed with a focus on SHP2-related pathways and on potential ‘degradation domain’-specific effects (e.g. UPS interference). We first asked if the abundance of proteins involved in SHP2 signalling complexes was affected, perhaps by bystander ubiquitination, co-degradation47. Our proteomics experiment detected 159 out of 245 annotated SHP2-complex components48. However almost all of these (>96%) were unaffected by wild type bioPROTAC expression (Supplementary Data 2). Interestingly, VHL_aCS3 was associated with decreased abundance for 5 SHP2-interactors, yet were unaffected by VHL_aCS3V33R. The situation with E2 bioPROTACs was more difficult to interpret since the reduced-affinity E2D1_aCS3V33R mutant generated more SHP2-interactor hits than the wild type degrader (Supplementary Data 2).
We next used Metascape to compare hit lists and assess the enrichment of distinct biological pathways within them49. Despite operating by distinct SHP2 presentation strategies we observed substantial overlap in hits for VHL_aCS3 and E2B_aCS3 expressing cells (Fig. 4j). The two E2D1-based degraders induced a different hit pattern, but showed some overlap with the stronger degraders. Enrichment analysis of each hit list identified SHP2-related pathways for wild type bioPROTAC-expressing or SHP2 siRNA-treated cells (Fig. 4k and Supplementary Fig. 5e, respectively)50. Omitting SHP2 from input lists did not affect this outcome and also SHP2 itself was one of the most frequently-occurring hits across the top 20 enriched non-redundant pathways for the active degrader data sets.
We noted substantial overlap in proteomic hits between wild type E2D1_aCS3 and the weaker-binding, non-degrading variant (V33R mutant, Supplementary Fig. 6a–c). After removing 116 common hits (presumably not linked to SHP2 interference), we observed that SHP2-related pathways dominated more of the top 20 enriched terms in the filtered wild type dataset (Supplementary Fig. 6d). Interestingly, for the two non-ubiquitinating E2D1mut_aCS3WT mutants (C85A and F62A), we still saw evidence of SHP2-related proteomic change, presumably via functional inhibition by the aCS3 domain (Supplementary Fig. 7a, b). Thus, our bioPROTACs resulted in proteomic alterations consistent with SHP2-related biology within 24 hours of expression and activity.
Observation of wider bioPROTAC engagement
Current bioPROTAC designs require that the adapted E3 ligase (or here an E2 enzyme) engages with the cellular ubiquitination machinery. As such, bioPROTAC variants may disturb UPS activity in unique ways, such as by competing for components or altering their stability. Furthermore, as the target is progressively degraded the possibility of off-target interactions is likely to increase. Subsequent changes to proteostasis could drive complex secondary phenotypes which need to be understood and mitigated.
An effect on the UPS was detected in our bioPROTAC datasets by functional enrichment analysis. This identified ‘ubiquitination’ or ‘small-protein conjugation’ processes, particularly for E2D1 fusions and, to a lower degree, for E2B and VHL fusions (Fig. 4k and Supplementary Fig. 7). From a set of 749 known UPS components in the human proteome we identified 322 within our datasets48. However, expression of the four wild type bioPROTACs caused only a small proportion of these (2.5–5.9%) to show abundance changes beyond the significance thresholds chosen (Supplementary Data 3 and Supplementary Fig. 8). The highest numbers of UPS hits were observed for E2D1 fusions, especially the NSa5 fusion. Interestingly, by reducing the affinity E2D1_aCS3 for its target (i.e. the V33R mutant) the number of UPS-related hits increased from 12 to 27 (Supplementary Fig. 8). Thus an E2D1 fusion able to receive ubiquitin, but not engage the target efficiently had a wider effect on UPS protein abundances, perhaps via reduced specificity for SHP2. In contrast, weakening the affinity between the VHL-based fusion and SHP2 (again via the V33R mutation) had the opposite effect, with the number of UPS hits reducing from 10 to just 1 (Supplementary Fig. 8).
As described above, the E2D1F62A_aCS3 mutant is likely inactive as it cannot recruit supporting E3 ligases. This is supported by our proteomics data, which reported 50% fewer E3 ligase hits for this mutant compared to wild type (Supplementary Fig. 8). It is possible that certain E3 ligases showing abundance changes are providing mechanistic support to E2 bioPROTACs. For example, wild type E2D1_aCS3 affected the levels of the E3 ligases RLIM, CNOT4 and FBXO3, which form part of endogenous E2D-family complexes (Supplementary Fig. 8)48,51,52. After mutating the E3 binding site on E2D1_aCS3 (the F62A mutant), these E3s were no longer affected and instead this mutant displayed reduced abundances for three other ligases (MAP3KI, PIAS4 and RNF11), which also usually interact with E2D1 (Supplementary Fig. 8)28,48.
We noted that the RING-type E3 ligase RLIM (RNF12) was particularly stabilised by E2D1 fusions (~3.6-fold increase) yet unaffected by E2B or VHL fusions (Fig. 4a–g and Supplementary Fig. 8a). To test if E2D1 fusions require RLIM/RNF12 for activity, we used RNAi to first deplete this E3 ligase from U2OS cells before expressing our E2 bioPROTACs and probing lysates by western blotting in the usual manner. Although blots confirmed depletion of RLIM, this had no effect on SHP2 levels or the degradation efficacy for E2D1 or E2B fusions (Supplementary Fig. 8c). This does not rule out a supporting role for RLIM as other E3 ligases may compensate for its loss51.
We also observed abundance changes to certain E2 enzymes with all the bioPROTACs tested, particularly a stabilisation of UBE2S and UBE2T with E2 fusions and a depletion of E2B and E2D2/3 with VHL_aCS3 (Supplementary Fig. 8b). This may reflect a functional interaction between E2s, or an upregulation in response to E2 bioPROTAC activity. For example, UBE2S is known to elongate ubiquitin chains initiated by E2D1, at least in vitro53. The balance between dependence for and distraction by endogenous E2 enzymes may control the apparent efficacy of a given E2 or E3 bioPROTAC.
Beyond the UPS, our E2 bioPROTACs displayed some functional enrichment of ‘cell cycle’ processes (Fig. 4k and Supplementary Fig. 7). While pathways annotated with relatively large numbers of proteins tend to score highly54, it is evident—particularly for E2D1 bioPROTACs—that key regulators including cyclin D2 (CCND2), cyclin-dependent kinase inhibitor 1 A/B (CDKN1A/B) and centromere family proteins (CENP) are unnaturally stabilised (Fig. 4a, d, e, g and Supplementary Data 1d). While SHP2 also indirectly affects the cell cycle, the functional enrichment scoring for cell cycle-related pathways increased for E2D1_aCS3 mutants unable to bind SHP2 (E2D1_aCS3V33R and E2D1C85A_aCS3V33R, Supplementary Figs. 6b and 7c). Thus, instead, the driver behind these events appears to be the degradation domain within the bioPROTAC, i.e. E2D1 or, to a lesser extent, E2B. Indeed, E2 enzymes are known to be involved in genome regulation and actively participate in cell cycling through timely ubiquitination of specific targets53,55.
In contrast, enrichment scores for cell cycle processes with the VHL_aCS3 fusions were not statistically significant (Fig. 4k and Supplementary Fig. 7e, f). Instead, the wider cellular impact for VHL_aCS3 highlighted chaperone pathways and DNA transcription, both of which correspond to known roles for VHL or may be a proteostatic response to VHL_aCS3 overexpression56,57.
In summary, our initial evidence supports the idea that E2/E3 bioPROTACs harness the UPS to induce target ubiquitination, yet with the possibility of additional, unintended encounters that may have separate phenotypic outcomes. The relative efficacies of different E2 bioPROTAC variants may be partially explained by the balance of these competing processes.
To explore the proteomics-driven hypothesis that certain E2 bioPROTACs can affect cell cycle progression we performed cell cycle analysis using flow cytometry. U2OS cells expressing a range of bioPROTACs or controls from mRNA were harvested after 48 hours and their DNA content was quantified using propidium iodide. To detect cells in M phase, we used an Alexa Fluor anti-phospho histone H3 (pHH3) antibody. In accordance with our proteomic data, the VHL-based degrader did not show any cell cycle defects (Supplementary Fig. 9). While inhibition of SHP2 by aCS3 expression alone displayed a subtle effect, the overexpression of E2D1 alone drove a strong G2/M arrest phenotype, in line with its biological role55. Remarkably, the targeting of E2D1 towards SHP2 (by fusion to aCS3) largely suppressed this cell cycle defect. Yet these E2D1 fusions did induce slightly altered G1/S populations, driving slightly more cells into in S-phase compared to expression of aCS3 or EGFP (Supplementary Fig. 9). Finally, the E2B-based SHP2 degrader did not display a statistically significant effect on the cell cycle populations. This is consistent with our proteomics data, which showed a relatively minor enrichment of cell cycle proteins within E2B_aCS3-associated hit lists.
De novo E2 bioPROTAC discovery using domain libraries
To date, bioPROTAC engineers have largely relied on pre-existing, <50 nM KD target recruitment domains—usually obtained from display methods—and a panel of E3 ligases39,58,59. However, observations from the small molecule TPD field are that degrader optimisation is multifactorial and that available ligands or inhibitors may not yield efficient degradation1,60. We therefore applied a de novo E2 bioPROTAC discovery route to screen a much wider array of ‘unoptimized’ target binding domains (Fig. 5a)44. Taking full length SHP2 as our model target, we performed three rounds of standard phage display using a VHH library and two fibronectin-type III libraries based on human Tenascin-C (Tn3)61,62. From selection outputs, we randomly picked 260 unique sequences and ligated them C-terminal to E2B, separated by an encoded (G4S)3 linker as above. The panel of unique E2B fusions were introduced as mRNA into U2OS cells, which were analysed for SHP2 degradation by immunofluorescence after 24 hours. From this degradation screen we identified 6 binding domains that, when fused to E2B, were associated with a reduction in SHP2 levels (Fig. 5b). The best-performing hit (VHH fusion E2B_VE9) displayed around 90% loss of SHP2, which matched our best degrader E2B_aCS3. Other hits showed lower efficacies, with SHP2 levels being reduced by 40–60%. The remaining constructs showed no significant activity as SHP2 degraders.
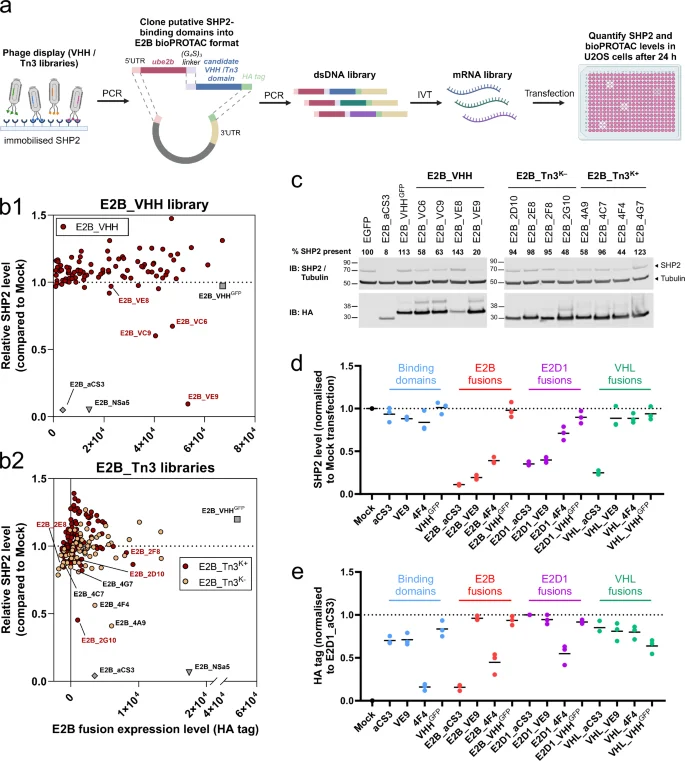
a E2 bioPROTAC discovery workflow. The VHH or Tn3 domain encoded in each selected phage is PCR-amplified and ligated 3’ to a common E2B-linker dsDNA fragment. The library of plasmids containing unique domains serves as a template for downstream in vitro transcription (IVT) followed by transfection and screening. Created with BioRender.com. b Immunofluorescence data obtained from U2OS cells expressing E2B fusion mRNAs created from randomly selected sequence-unique phage display output clones. x-axis = HA-tagged fusion level; y-axis = SHP2 level relative to Mock cells. Two types of fusion were tested: b1 E2B_VHH (n = 94) and b2 E2B_Tn3 (i.e. Tenascin Fibronectin-type III fusions using either Tn3K+ (n = 93) or Tn3K− (n = 73) domains i.e. with or without lysine, respectively, in sequence variable regions). Data shown are representative of two biological replicates. Domains taken forward for analysis are individually labelled with their library identifier (V = VHH, 2 = Tn3K+ and 4 = Tn3K−) and source well position. c Selected E2B fusions from (b) were re-analysed by western blotting. The % SHP2 remaining compared to EGFP-transfected control cells was quantified by densitometry and shown numerically for each fusion. Data shown are representative to two biological replicates. Dot plots indicating mean d SHP2 or e HA-tagged protein levels as determined by immunofluorescence. U2OS cells were transfected with mRNA encoding either single domains (VE9, 4F4, aCS3, or VHHGFP) or the same domains fused E2D1, E2B, or VHL. Data from three biological replicates. Related to Supplementary Figs. 10 and 11.
To verify the screening results, we used western blotting to analyse lysates of U2OS cells expressing the 6 active degraders alongside 6 inactive fusions (Fig. 5c). Each full-length fusion was readily detectable and the degree of SHP2 degradation matched trends from plate-based screen, with E2B_VE9 as the most active new bioPROTAC. Thus our method was successful in identifying novel bioPROTACs without prior optimisation of target affinity or inhibition beyond standard phage display enrichment methods.
High affinity is not essential for E2 bioPROTAC activity
A survey of the E3 bioPROTAC literature indicates that successful degraders display a target dissociation constant (KD) in the range 0.1–100 nM12,15,58,59,63. This may simply reflect a propensity to start with readily-available, established, high-affinity domains which tend to yield successful degraders. However, cellular ubiquitination systems generally utilise lower affinity (KD ~ 1 µM) interactions64,65. For the SHP2-binding domain aCS3 (KD < 10 nM), the V33R mutation reduces affinity to that order of magnitude, yet this essentially knocks out degrading power (Fig. 1)22.
We obtained binding kinetics data using surface plasmon resonance for several of the isolated VHH or Tn3 hits from the screen above. Surprisingly, each VHH or Tn3 domain displayed relatively weak affinity for immobilised, full-length SHP2, with KD values in the range ~0.2 to ~8 µM (Supplementary Fig. 10a, b). Moreover, the VHHVE9 domain that generated strong SHP2 degradation displayed slightly weaker affinity than Tn32D10, a non-degrader (Supplementary Fig. 10b). We performed an epitope binning experiment with these two domains and observed that they can bind simultaneously to SHP2 (Supplementary Fig. 10c). Thus, as with PROTACs, epitope choice appears to exert a strong effect on overall activity and that affinity is not necessarily predictive of activity1.
Higher-affinity binding domains, such as aCS3 and K19 above, typically induce target depletion when fused to alternative degradation domains classes (e.g. E3 ligases, or here E2 enzymes). However, this may not be true for lower affinity domains discovered in a specific context. To explore the portability of two reasonably efficacious but weaker-affinity domains—VHHVE9 and Tn34F4—we created fusions to both E2D1 and VHL and assessed the level SHP2 degradation in U2OS cells by immunofluorescence. Both binding domains retained some activity when fused to E2D1 but were ineffective when conjugated to VHL (Fig. 5d, e and Supplementary Fig. 11).
SHP2-targeted E2 bioPROTACs repress downstream signalling via ERK
Some studies report that degradation of target proteins yields a stronger phenotype than inhibitory strategies16,37,38,66. For bioPROTACs employing inhibitory domains (e.g. aCS3), their overall phenotypic effect will comprise stoichiometric inhibition and target degradation. These are technically difficult to separate, and progressive degradation may also increase the degree of inhibition of available target molecules.
To probe the relative effect of SHP2 inhibition vs. bioPROTAC-mediated degradation/inhibition we tested the ability of E2 or VHL bioPROTACs to reduce SHP2-dependent activation of extracellular signal-related kinase (ERK1/2)22,26. In this well-used assay, cells are briefly exposed to Epidermal Growth Factor (EGF), leading to phosphorylation of receptor tyrosine kinases. These recruit SHP2 causing its phosphatase domain to become active, which stimulates the Mitogen Activated Protein (MAP) Kinase pathway and leads to the rapid phosphorylation of ERK. Inhibition or degradation of SHP2 interrupts this process, resulting in less accumulation of phospho-ERK67,68.
MDA-MB-468 cells were simultaneously serum-starved and transfected with mRNA encoding bioPROTACs (or controls) and incubated for 24 hours to allow construct expression and SHP2 degradation/inhibition. Cells were then stimulated by brief exposure to EGF and then washed, lysed in situ and analysed by western blotting. The levels of total ERK (tERK), phospho-ERK (pERK), SHP2, tubulin and HA-tag were quantified by densitometry.
As expected, untransfected cells and those expressing non-SHP2-binding constructs were highly sensitive to EGF stimulation, as evidenced by large increases in pERK levels (Fig. 6). In contrast, both aCS3 and VHHVE9 reduced normal ERK phosphorylation, presumably by inhibition, by ~65%22. Yet this repression was deepened to around 80-90% by the three aCS3-based bioPROTACs and by E2B_VHHVE9 (Fig. 6). Thus, the bioPROTACs had the most severe overall effect. However, for E2D1_aCS3 this gain in efficacy was not dependent on SHP2 degradation since the catalytic mutant E2D1C85A_aCS3 performed similarly to wild type (Fig. 6 and Supplementary Fig. 12a). This could be due this mutant’s higher expression level, causing stronger inhibition (Supplementary Fig. 12b, c). In contrast, E2B_aCS3 and VHL_aCS3 express at lower levels than aCS3, thus we hypothesise that degradation of SHP2 is driving the additional phenotypic effect beyond inhibition (Fig. 6 and Supplementary Fig. 12). Ultimately by recruiting SHP2 with inhibitory domains it is difficult to measure the effect of SHP2 degradation alone, which instead would require non-inhibitory target-binding scaffolds.
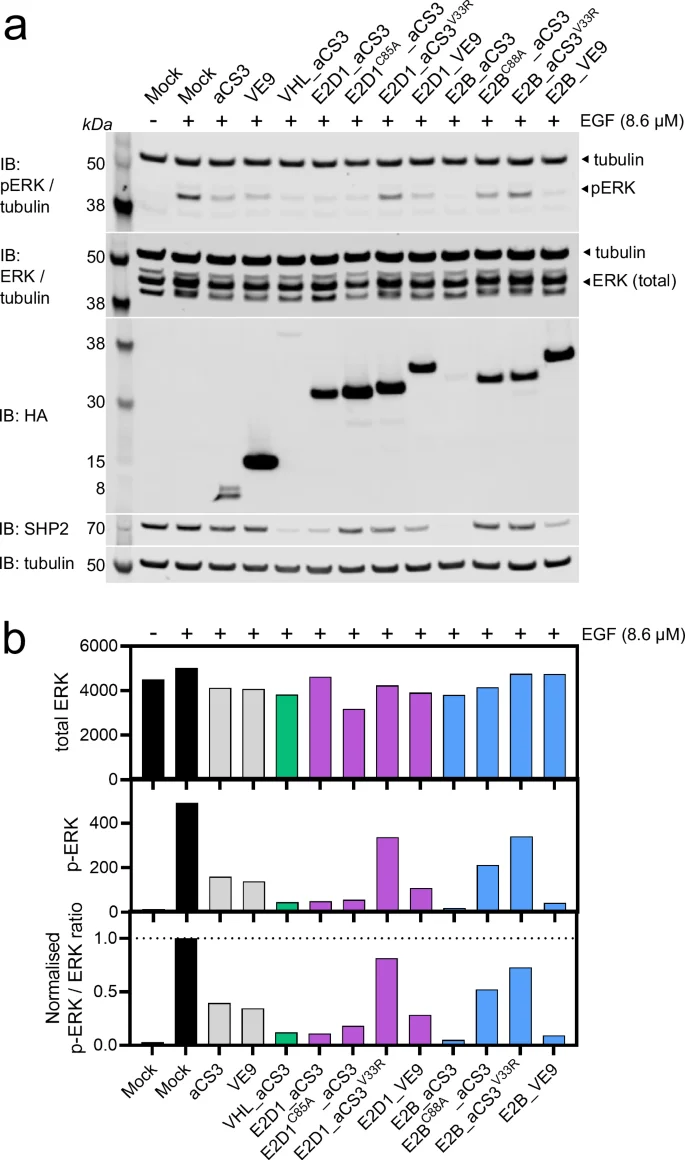
a Western blots of serum-starved MDA-MB-468 cells transfected with mRNA encoding bioPROTACs (or controls) after 24 h, followed by a 15 min exposure to DMSO (−) or Epidermal Growth Factor (EGF, +). Blots were probed using antibodies specific for phosphorylated ERK (pERK), total ERK (tERK), HA-tag, SHP2, or tubulin (loading control) as indicated. Data shown is representative from two biological replicates. b Bar graphs displaying densitometry data from (a) for pERK, tERK, and the pERK/tERK ratio, normalised to that of untransfected control cells. Related to Supplementary Fig. 12.
Discussion
A variety of small-molecule or biologics-based approaches have been developed to deplete host, pathogen, or tagged proteins, from both intra- or extracellular locations6,69,70,71. These proteome editing tools expand both the available target space and the scope of protein functional inhibition, which benefits both fundamental research and clinical paradigms72. The use of biologics-based degraders offers the ability to deplete historically difficult-to-target proteins, or their isoforms, which may lack suitable ligand-binding pockets, and it avoids complex medicinal chemistry1,6. The re-targeting of E3 ligases by small molecules or as bioPROTACs is now an established point of interference in the UPS cascade1,73. Enhancement of proximity to E2 ubiquitin-conjugating enzymes is a complementary means of hijacking the UPS, using protein fusions18,25,33 or small molecules19,20. Indeed, two human E2 enzymes (UBE2O and BIRC6) are known to both recruit and ubiquitinate substrates74,75. Since E2 enzymes play a more promiscuous role in the UPS than E3 ligases, as a degradation domain they may tolerate a wider range of substrates and host cell types20,23.
In this study, we have shown that certain human E2 enzymes, particularly E2B and E2D1, can be fused to target-binding scaffolds to drive the degradation of SHP2 and KRAS, with a similar efficacy to VHL-based fusions (Figs. 1, 2 and Supplementary Fig. 4). Others have recently developed small molecule PROTACs to induce SHP2 degradation67,76. Compared to these degraders, E2 bioPROTACs deliver a similar amount of SHP2 depletion (>80%). The rate of target loss induced by E2 or VHL fusions was also considerably faster than by RNAi. E2 bioPROTACs did not completely degrade SHP2 or KRAS. This may be due to physical separation of a sub-population of target protein, resynthesis, or competition for target epitope by endogenous co-factors77,78,79.
The mechanistic reasons why certain E2 fusions show enhanced performance are likely to include the types of ubiquitin chains formed27,80,81,82, any requirement for (or distraction by) other E2 enzymes80 and E3 ligases83, avidity effects via E2 dimerisation84 or E2-ubiquitin binding85, phospho-regulation86, and the extent of auto-ubiquitination15. The kinetics and orientation effects controlled by the target recruitment domain and degree of target co-location will also exert an important influence on relative potency77,78,79. Indeed, we note that endogenous E2B is found in both the nucleoplasm and cytosol, matching the bio-distribution of SHP2, whereas E2D1 is reported to be cytosolic87. Assuming that the cellular localisation of SHP2-targeted E2B and E2D1 fusions follows this pattern, this may partly explain why E2B was a more effective degradation domain for SHP2. In contrast, KRAS is cytosolic, and thus equally accessible to both E2D1 and E2B fusions, and this may account for the similar efficacy shown by E2D1 / E2B fusions to K19 (Supplementary Fig. 4).
To support our proposed E2 bioPROTAC mechanism (Fig. 1a) we created mutant variants that could not acquire ubiquitin (e.g. E2D1C85A), or were defective in target recruitment (e.g. aCS3V33R, K19GGG, VHHGFP). These mutants were unable to induce target degradation, confirming that both the active site cysteine is necessary for Ub capture from an E1 enzyme and controlled target proximity is required for its subsequent ubiquitination (Figs. 1, 2 and 4).
Initially, the E2 bioPROTAC concept suggested the possibility of an E3-less approach to targeted ubiquitination. Although E2 fusions did not require CRL E3 ligase pre-activation by neddylation (Fig. 3b) they appeared to differ in their functional dependence on E3s and exert unique effects on E3 ligase abundances (Figs. 1, 2 and 4). Our observations are consistent with reports describing a much wider functional E3 network for E2D1 than E2B25,28. Since E3 ligases are known to constrain E2~Ub complexes and thus promote target ubiquitination it may be preferable to engineer bio-orthogonal E3-E2 fusions that do not require endogenous E3 engagement88. This may also reduce unwanted UPS interference and prevent E3 ligases from bringing their own substrates to the E2 bioPROTAC—the avoidance of both is desirable.
We initially screened E2D1 and E2B with the target recruitment domain positioned either N- or C-terminal to the core enzyme (Fig. 1 and Supplementary Figs. 3, 4). These early combinatorial screens were generally successful in identifying a degrader. The relative location of the binding domain should be screened with each target as some orientations were more efficacious (Supplementary Figs. 3 and 4). Since the optimal epitope and binding kinetics for potent degradation remains difficult to predict, we also adopted a wider screening approach to discover E2B-based SHP2 degraders (Fig. 5a). As target recruitment is a fundamental design feature, we manually selected >250 sequence-unique candidate SHP2-binding domains from phage display selection outputs. The combinatorial approach could be scaled to include additional E2 enzymes, construct orientations or linkers44.
Our medium-throughput screen identified one effective degrader (E2B_VE9) and 5 others with lower activity. Intriguingly, each binding domain we followed up on displayed fast on/off kinetics, with KD values in the high nanomolar to low micromolar range (Supplementary Fig. 10). This is outside of the range typically shown by E3 bioPROTACs (KD < 100 nM12,15,17,38,63) and instead resembles the kinetics of E3 ligase/substrate interactions64.
The optimal affinity for a given bioPROTAC will be controlled by several factors, such as target epitope competition, the intracellular concentrations of both species, the degradation domain, and trans-ubiquitination kinetics. Since E3 bioPROTACs will recruit endogenous E2~Ub donors with relatively weak affinity, that degrader format may require slightly higher target affinity than E2 bioPROTACs, which we show above can tolerate ~1 µM binding. Irrespective of biomolecular design, we hypothesise that higher-affinity recruitment domains are more likely to compensate for sub-optimal orientations, leading to acceptable levels of target ubiquitination. In contrast, weak-binding domains such as VHHVE9 may acquire target molecules via more accessible epitopes or enable superior ubiquitination transfer rates (e.g. improved lysine availability). In support of this idea of balancing factors, we observed that the low-affinity domains (VE9 or 4F4) drove degradation when fused to E2 enzymes but not to VHL (Fig. 5d).
For TPD applications, the concentration of active degrader within the cell is a key factor to understand and control. For small molecules, potency is thus dependent on factors such as host-cell targeting, solubility, membrane permeability, stability and efflux mechanisms79,89. Similarly, the apparent activity bioPROTACs will depend on the delivery efficiency for the genetic material (or intact degrader), protein synthesis, bioPROTAC stability and sub-cellular location relative to the target. Thus both methods must overcome challenges to optimise delivery and maintain stability.
Interestingly, we often observed a trend towards lower expression for higher activity degraders. Furthermore, mutation of E2 bioPROTACs usually lead to an increased expression level, particularly for E2B (Figs. 1, 2 and Supplementary Fig. 4). This suggests that successful target degradation is sometimes associated with faster bioPROTAC clearance, perhaps via auto-ubiquitination and/or co-degradation with the ubiquitinated target. However, we also found that the choice of target binding domain affected self-clearance: Fusing E2B to the high-affinity monobodies (aCS3 or NSa5) resulted in low expressing, yet effective degraders whereas switching to the weak-affinity VE9 domain dramatically increased expression, yet with no overall difference in SHP2 degradation (Fig. 5). Ultimately, a low-expressing E2 bioPROTAC may be preferable to avoid unwanted interference with other biological pathways.
The primary purpose of proteome editing by targeted degraders is to induce specific phenotypic change, such as enhancing tumour cell clearance70,72,90. After 24 hours’ expression of SHP2-targeted bioPROTACs we observed some abundance changes to proteins involved in SHP2 pathways using global proteomics91. These varied in nature according to both the degradation and binding domains, which combine to modulate SHP2 depletion kinetics (Fig. 4 and Supplementary Figs. 6, 7). We also demonstrated that the SHP2-targeted bioPROTACs have a negative impact on downstream ERK phosphorylation (Fig. 6). For some constructs (e.g. E2B_aCS3) this appeared to go beyond inhibition alone16,37,66. However, we acknowledge that both target interference and degradation—both of which are desirable—will contribute to the phenotypic outcome for a given bioPROTAC. In comparison to RNAi—an established, orthogonal approach to protein knockdown—we found that E2B and VHL-based fusions could deliver a greater degree of SHP2 depletion and associated proteomic impact over a shorter time period.
Protein silencing approaches can suffer to varying degrees from off-target effects92,93,94. Furthermore, as a bioPROTAC gradually depletes the target from the cell, the chance of these occurring increases, driving additional phenotypic changes or complicating experimental interpretation95. Global proteomics was useful in comparing target-independent effects for bioPROTAC variants, which were different to those associated with siRNA treatment (Fig. 4). Our data suggest that the degradation domain can induce unique proteomic changes. For the high-expressing E2D1 fusions, protein abundance changes due to the degradation domain were more prevalent, and these increased further when either the catalytic cysteine and/or target binding domain was mutated (Fig. 4 and Supplementary Figs. 5–7)96,97,98. Thus we recommend that a null E2D1C85A mutant is treated with caution as a control sample within biological investigations. In contrast, the VHL_aCS3V33R mutant displayed 80% fewer hits than the wild type, suggesting that a non-targeted VHL fusion is relatively more benign than the analogous E2D1 fusion.
For each bioPROTAC we observed abundance changes for a small number of UPS components, which may reflect functional interactions, bystander ubiquitination, or possibly secondary/downstream effects (Supplementary Fig. 8). As stated above, it may be preferable to engineer E2 fusions that avoid the distraction of endogenous E3 ligases and thus reduce unintended effects. For E2D1 fusions, a possible effect on the cell cycle was highlighted by functional enrichment studies of proteomic hits. However, follow-up cell cycle analysis revealed that expression of E2D1_aCS3 generated a far milder cell cycle phenotype than E2D1 alone97. While we judged that the overall proteomic profile of E2D1 fusions was less attractive than that of E2B fusions we recognise that ranking variants according to their proteomic impact may not translate into better in vivo tolerability.
We have demonstrated the human E2 ubiquitin-conjugating enzymes UBE2D1 and UBE2B can be adapted to induce the degradation of the intracellular proteins SHP2 and KRAS. Compared to the use of E3 ligases, the more central role for E2 enzymes within the UPS may yield more generalised target degradation capabilities with a wider affinity tolerance. However a broader screen of E2 enzymes and E3 ligases against multiple targets is required to test this hypothesis. As with any proteome-editing approach, the detection and mitigation of degradation-domain effects needs to be monitored and minimised where necessary. Future studies will explore the behaviour of E2 bioPROTACs, both in vitro and in vivo, in order to improve their utility in probing fundamental cellular processes, cell engineering, and disease management.
Methods
Cell lines
Human cell lines were cultured in a humidified incubator at 37 °C with 5% CO2. Where required, cells were detached from the flask surface using either Accutase or TrypLE™ Express enzyme and counted using a Beckman Vi-Cell XR. Human osteosarcoma U2OS (ATCC #HTB-96), breast adenocarcinoma MDA-MB-468 (ATCC #HTB-132) and MDA-MB-231 (ATCC #HTB-26) cells were maintained in DMEM medium containing penicillin and streptomycin, and 10% (v/v) fetal bovine serum (FBS). Human colorectal carcinoma HCT116 cells (ATCC #CCL-247) were maintained in McCoy’s 5a Medium Modified medium containing the same supplements. All cell lines underwent short tandem repeat (STR) profiling prior to use and regular Mycoplasma screening.
DNA sequences
See Supplementary Data 4 for all sequences. All DNA was codon-optimised and gene-synthesised by either GeneArt or Twist Bioscience. To reduce the likelihood of auto-ubiquitination, a lysine-free mutant of aCS3 was used containing the mutations K7Q, K55Y, K64H (numbering according to Sha et al.22). Similarly, the NSa5 domain utilised contained the following mutations: K7R, K55Y, K64R. The DARPin domain sequences K19 and E3–5 were used as published41.
6-well SHP2 degradation assay (for western blotting)
Two ml aliquots of U2OS cells at a density of 1.5 × 10⁶/ml were added to wells in a 6-well cell-culture plate and incubated for 24 hours. Transfection mixtures were prepared by mixing 3 µg/well mRNA (diluted in 300 µl Opti-MEM) and 6 µl/well RNAiMAX (diluted in 300 µl Opti-MEM). After addition of transfection mixture, cells were incubated for 24 hours. Cells were then washed with PBS, detached using TrypLE™ Express, collected by centrifugation (300 × g, 5 min), washed with PBS, and stored as pellets at −70 °C until analysis.
96-well SHP2 degradation assay (for immunofluorescence)
U2OS cells were seeded into 96-well cell-culture plates (7000 cells/100 µl per well) and incubated for 24 hours. Unless otherwise stated, each well received a pre-mixed aliquot of 100 ng mRNA + 0.3 µl Lipofectamine RNAiMAX in 20 µl Opti-MEM. Cells were incubated for 24 hours before being fixed by addition of 40 µl 16% (v/v) paraformaldehyde for 30 minutes. Wells were washed once with PBS and cells were permeabilized for 15 minutes in PBS containing 0.25% (v/v) Triton X-100. After washing with PBS, wells were blocked for 30 minutes in PBS containing 1% (w/v) BSA, and then washed again in PBS. Wells were incubated at 4 °C overnight in primary antibody mixture (mouse anti-SHP2 (1:100 dilution, BD Biosciences 610622) and rabbit anti-HA tag (1:3000, Cell Signaling Technology 3724) in PBS/BSA buffer). Control wells received buffer only. After 3 washes in PBS containing 0.1% (v/v) Tween-20 (PBS-T), cells were incubated for 1–2 h with a secondary antibody/stain mixture containing donkey anti-mouse Alexa Fluor 647 (1:1000, Jackson ImmunoResearch 115–605–164), donkey anti-rabbit Alexa Fluor488 (1:2000, Jackson ImmunoResearch 711–545–152), Hoechst stain (1:10,000), and Cell Mask Orange (1:50,000) in a PBS/BSA buffer. Finally, wells were washed 3 times in PBS-T and stored in PBS at 4 °C until analysis. Data acquisition was performed with an ImageXpress Confocal HT.ai, at 10X magnification and collecting 4 adjacent images per well. To analyse data, images were subjected to multi-wavelength cell scoring analysis within MetaXpress. In short, the nuclei were segmented using the Hoechst signal followed by segmentation of the entire cell with the Cell Mask Orange signal. Average cellular antibody signal intensities were then calculated for each well, from which the background autofluorescence control well signals were then subtracted. SHP2 levels were normalised within Prism to the range 0–1 using the mock transfection control value as the maximum. Statistical analyses were performed within Prism, as described in each figure legend. Image rendering was performed in Fiji with brightness contrast settings kept uniform for individual figures.
384-well SHP2 degradation assay (for immunofluorescence)
A 5 µl aliquot of Opti-MEM was added all wells of a 384-well cell-culture plate using a Multidrop. An Echo 650 series acoustic liquid handler was used to transfer 750 nl aliquots of each E2B_VHH or E2B_Tn3 mRNA into separate wells (n = 4 per mRNA). Pre-mixed transfection reagent (0.15 µl RNAiMAX + 5 µl Opti-MEM per well) was then added to each mRNA using a Multidrop and incubated for 10 minutes. A total of 5000 U2OS cells/well were then added in a volume of 40 µl. Transfected cells were incubated for 24 hours and then fixed by addition of 17 µl 16% v/v paraformaldehyde for 30 minutes. Plates were then prepared for immunofluorescence measurements as described above. Results shown are representative of two biological replicates.
Western blotting
Cells were lysed for 15 minutes on ice in RIPA buffer, including Benzonase nuclease and protease/phosphatase inhibitors. The concentration of protein was measured using a BCA assay. SDS-PAGE was carried out using Bolt 4–12% gels, which were blotted onto PVDF membranes using an iBlot2 system. Membranes were blocked in Intercept blocking buffer (TBS- or PBS-based as appropriate) for 45 minutes at room temperature, followed by primary antibodies diluted in Tris-buffered saline + 0.05% Tween-20 (TBST) buffer for 2 hours at room temperature or overnight at 4 °C. Primary antibodies used: mouse anti-SHP2 (1:1000, Abcam 76285); rabbit anti-HA tag (1:1000, Abcam ab137838); mouse anti-tubulin (1:10,000, Li-COR 926-42213), anti-KRAS (1:2000, LS Bio LS-C175665). Membranes were washed three times in TBS-T then incubated for 1 hour with secondary antibodies diluted in TBST + 0.015% sodium dodecyl sulfate (SDS). Secondary antibodies used: goat anti-Rb-800CW (1:15,000, Li-COR 926-32211); goat anti-Ms-680RD (1:5–10,000, Li-COR 926-68070). After three final washes in TBST, blots were imaged using the Odyssey DLx system. Densitometry data were obtained using Image Studio software and normalised using α-tubulin as a loading control.
MG132 assay
U2OS cells were seeded into 6-well plates as described above. After 24 hours, half of the wells were treated with 5 µM MG132 or just DMSO control at the point of transfection. Cells were harvested as above after 8 hours for western blotting analysis. Data shown are representative of two biological replicates.
MLN4924 assay
U2OS cells were seeded into 6-well plates as described above. After 24 hours, half of the wells were treated with 1 µM MLN4924 or just DMSO control at the point of transfection. Cells were harvested as above after 24 hours for Western blotting analysis. Data shown are representative of two biological replicates.
Sample preparation for proteomics
U2OS cells were seeded into 6-well plates and transfected with either 3 µg mRNA + 6 µl RNAiMAX in a total of 600 µl Opti-MEM per well, or 65 pmol siRNA + 6 µl RNAiMAX in a total of 500 µl Opti-MEM per well. The siRNA-treated cells received either Silencer™ Select Negative Control No. 1 siRNA or a 1:1 mixture of Silencer™ Select ptpn11-targeted siRNAs. Cells were subsequently incubated for 24 hours (mRNA-treated) or 40 hours (siRNA-treated). Cells were detached using Accutase, gently centrifuged, washed with PBS, re-centrifuged, and the supernatant discarded. A total of 4 biological replicates were performed per condition. Samples were checked by western blotting to confirm SHP2 depletion and bioPROTAC expression. Cell pellets were stored at −80 °C. U2OS cell extracts were prepared using iST 96x sample preparation kit according to the manufacturer’s instructions (PreOmics). In short, cell pellets were lysed by resuspension in a lysis buffer solution and heated to 95 °C for 10 min shaking (1000 rpm) followed by pulsed sonication (10x 1 sec pulses, Qsonica). Aliquots containing 50 µg of protein were transferred into cartridges, digestion solution was added and proteins were digested for 4 hours at 37 °C. Digestion was stopped by adding “stop” solution and peptides were purified by centrifugation for 2 min at 2000 × g, followed by four washes and elution into a collection plate using provided solutions. Peptides were dried in a vacuum centrifuge and resuspended in 0.1% formic acid, 2% acetonitrile (ACN)for MS analysis.
LC-MS/MS analysis
Nanoflow LC-MS/MS was performed by coupling an Ultimate 3000 RSLCnano system to an Orbitrap Exploris 480 mass spectrometer. 2 µg peptides were trapped on an Acclaim Pepmap column (2 cm × 75 µm, 3 µm, 100 Å) in water with 0.1% formic acid (FA) and separated on a C18 Aurora column (25 cm × 7 5 µm, 1.7 µm, IonOpticks) at 50 °C. Gradient elution was performed from 3% ACN to 30% ACN in 0.1% FA over 100 min at 400 nL/min flow rate. The mass spectrometer was operated in data-independent acquisition (DIA) mode with full scan MS spectra acquired at 120,000 resolution and AGC target at 300% with an IT of 54 ms. MS2 spectra were collected at 15,000 resolution, AGC target at 1500% with IT of 30 ms and normalised collision energy set at 28%. 75 variable windows covering a mass range of 400–1000 m/Z and with an overlap of 1 m/z were used. Default settings were used for FAIMS and three CV values (−45, −55, −75) were set. To identify and quantify peptide sequences, raw files were searched with Pulsar embedded in Spectronaut (version 17.3) against a UniProt human database (February 2021) using directDIA workflow and default BGS factory settings.
Global proteomics data processing and bioinformatics
Proteins containing missing intensities in one or more of the samples were filtered out and the resulting intensities normalised using the total approach with in-house scripts and the data.table R package. To find differentially-expressed proteins against the EGFP mRNA-transfected (bioPROTACs) or Negative Control siRNA-transfected controls, a statistical analysis was carried out with linear models using the four technical replicates per sample and defining comparisons between constructs in the limma Bioconductor package. False discovery rate (FDR)-adjusted p-values were calculated using the Benjamini-Hochberg procedure and discoveries assigned based on a 5% FDR threshold and log2FC < −log2(1.5) for downregulation or log2FC > +log2(1.5) for upregulation. Volcano plots were generated using the ggplot2 and ggrepel R packages. Venn diagrams were created using Venny99. Prior to downstream analyses, bioPROTAC-related proteomics hit lists were filtered to remove artefacts that are likely due to EGFP expression100,101 as follows: (1) A set of 413 suspect hits was identified by quantitative comparison of proteomic data from cells expressing EGFP with cells transfected with the Negative Control siRNA (these hits were defined using the same cut-offs as above). This list is also likely to include proteomic hits due to siRNA transfection. (2) Suspect hits were removed from bioPROTAC datasets if they showed a positive log2FC value in the EGFP/siRNA dataset and an approximately equal but opposite (negative) log2FC value in the bioPROTAC/EGFP dataset (or vice versa). Filtered proteomic hit lists were analysed using Metascape49, using the default statistical parameters, and selecting the Reactome Gene Sets, GO Biological Processes, KEGG Pathway, and WikiPathways for pathway enrichment analyses.
Construction of E2B fusion mRNA library
The 260 unique VHH and Tn3 sequences chosen from phage display outputs were PCR-amplified using VHH_For/Rev (or Tn3_For/Rev) primer pairs, which include Esp3I restriction sites, and the products purified using a MinElute 96 UF kit. Analogous dsDNA fragments containing aCS3, NSa5 or VHHGFP sequences were also prepared by PCR. These dsDNA fragments were ligated into an adapted pMAV plasmid102 containing the ube2b gene fused to an encoded (G4S)3 linker and C-terminal HA tag by Golden Gate cloning. Reaction mixtures were treated with PlasmidSafe DNAse and transformed into NEB High efficiency competent cells and incubated overnight with shaking at 37 °C in 1 ml 2XYTAG medium in a 96 well block. Diagnostic PCR was used to verify the size of each E2B_XXX_HA fusion. To obtain linear dsDNA templates for IVT, glycerol stocks containing each E2B_XXX_HA plasmid were grown overnight in a deep well block and subjected to PCR using the ForHSD and A80Rev primers. After digestion of host and plasmid DNA by DpnI, the dsDNA PCR products were purified using an AMPure XP magnetic bead-based protocol on a Hamilton robotic liquid handler and transferred to an Echo source plate. Product purity and DNA length was verified using 2% 96-well E-Gels. An Echo 650 acoustic liquid handler was used to set up 2 µl IVT reactions (0.6 µl dsDNA template + 1.4 µl master mix, containing HiScribe T7 reagents, CleanCap AG, and 50% dUTP replaced with 5-Methoxyuridine-5’-Triphosphate). After 6 hours’ incubation at 37 °C, dsDNA was digested by addition of 1 µl DNase I, and the final mixture diluted to 40 µl with nuclease-free water. The purity, and relative size and yield of each unpurified mRNA product was verified using 96 well 1.4% agarose gels and visualised with SYBR Safe DNA gel stain. The final libraries of E2B_XXX_HA mRNAs were stored in Echo source plates at −20 °C.
ERK phosphorylation assay
MDA-MB-468 cells were seeded into 12-well cell-culture plates (1.25 × 10⁵ cells per 1.3 ml per well) and incubated for 24 hours in DMEM containing 10% (v/v) FBS. Prior to transfection, wells were aspirated, and the media replaced with DMEM alone. Transfection mixtures were prepared containing 1.5 µg mRNA + 2.5 µl RNAiMAX in 200 µl Opti-MEM per well. After transfection, the starved cells were incubated for 24 hours to allow bioPROTAC expression and activity. Cells in half of the wells were next stimulated by addition of epidermal growth factor (EGF) to a final concentration of 8.5 µM and incubated for 15 minutes. The media was aspirated, wells washed with ice-cold PBS, and cells lysed in situ by addition of an SDS-PAGE sample buffer (made using 4X Bolt LDS sample buffer + 10X Bolt Reducing Agent + 100X Protease/phosphatase inhibitors cocktail). Wells were scraped and the contents transferred to pre-chilled 1.5 ml tubes. Lysates were subjected to SDS PAGE and western blotting. PVDF membranes were blocked using a Tris-buffered saline (TBS) Protein-free blocking solution for 1 hour, followed by incubation with primary antibodies: rabbit anti-p44/42 MAPK (ERK1/2, 1:900, Cell Signaling Technology 9102), rabbit anti-p-p44/42 MAPK (ERK1/2, 1:900, Cell Signaling Technology 4377), mouse anti-tubulin (1:10,000, Li-COR 926-42213), mouse anti-SHP2 (1:1000, Abcam 76285) or rabbit anti-HA tag (1:1000, Abcam ab137838) for >12 hours at 4 °C in the blocking buffer. Blots were washed three times in TBST. Secondary antibody application, near infra-red (NIR) imaging, normalisation to loading control and densitometry measurements were performed as described above. Two biological replicates were performed.
All other methods and reagents used are described in the Supplementary Information in Supplementary Table 1.
Reporting summary
Further information on research design is available in the Nature Portfolio Reporting Summary linked to this article.
Statistics and reproducibility
Information about statistical analyses, the number of experimental replicates, p values are specified within the main text, figure legends or Methods. Unless otherwise stated, data are shown as mean ± SD. A p value less than 0.05 indicates statistical significance (p 2 wells were included as technical replicates for internal averaging prior to further statistical testing alongside biological replicates. For proteomics studies n = 4 biological replicates were chosen to provide sufficient detection of SHP2 degradation.
Data availability
Mass spectrometry proteomics data have been deposited to the ProteomeXchange Consortium via the PRIDE partner repository with the dataset identifier PXD041225 (https://www.ebi.ac.uk/pride/). Source data for main figures are provided in the Supplementary Information and in Supplementary Data 5. All other data are available from the corresponding author on reasonable request. Uncropped images of blots can be found in Supplementary Figs. 13–15.
Code availability
Code used for proteomic analyses was deposited on GitHub and are publicly available as of the date of publication (https://github.com/AstraZeneca/e2-bioprotac).
References
-
Békés, M., Langley, D. R. & Crews, C. M. PROTAC targeted protein degraders: the past is prologue. Nat. Rev. Drug Discov. 21, 181–200 (2022).
Google Scholar
-
Sasso, J. M. et al. Molecular glues: the adhesive connecting targeted protein degradation to the clinic. Biochemistry. https://doi.org/10.1021/acs.biochem.2c00245 (2022).
-
Dikic, I. & Schulman, B. A. An expanded lexicon for the ubiquitin code. Nat. Rev. Mol. Cell Biol. 1–15 https://doi.org/10.1038/s41580-022-00543-1 (2022).
-
Guenette, R. G., Yang, S. W., Min, J., Pei, B. & Potts, P. R. Target and tissue selectivity of PROTAC degraders. Chem. Soc. Rev. 51, 5740–5756 (2022).
Google Scholar
-
Paiva, S.-L. & Crews, C. M. Targeted protein degradation: elements of PROTAC design. Curr. Opin. Chem. Biol. 50, 111 (2019).
Google Scholar
-
VanDyke, D., Taylor, J. D., Kaeo, K. J., Hunt, J. & Spangler, J. B. Biologics-based degraders—an expanding toolkit for targeted-protein degradation. Curr. Opin. Biotechnol. 78, 102807 (2022).
Google Scholar
-
Zhou, P., Bogacki, R., McReynolds, L. & Howley, P. M. Harnessing the ubiquitination machinery to target the degradation of specific cellular proteins. Mol. Cell 6, 751–756 (2000).
Google Scholar
-
Liu, J., Stevens, J., Matsunami, N. & White, R. L. Targeted degradation of β-catenin by chimeric F-box fusion proteins. Biochem. Biophys. Res. Commun. 313, 1023–1029 (2004).
Google Scholar
-
Hatakeyama, S., Watanabe, M., Fujii, Y. & Nakayama, K. I. Targeted destruction of c-Myc by an engineered ubiquitin ligase suppresses cell transformation and tumor formation. Cancer Res. 65, 7874–7879 (2005).
Google Scholar
-
Zhang, J., Zheng, N. & Zhou, P. Exploring the functional complexity of cellular proteins by protein knockout. Proc. Natl. Acad. Sci. USA 100, 14127 (2003).
Google Scholar
-
Li, X. et al. Degradation of HER2 by Cbl-based chimeric ubiquitin ligases. Cancer Res. 67, 8716–8724 (2007).
Google Scholar
-
Ludwicki, M. B. et al. Broad-spectrum proteome editing with an engineered bacterial ubiquitin ligase mimic. ACS Cent. Sci. 5, 852–866 (2019).
Google Scholar
-
Caussinus, E., Kanca, O. & Affolter, M. Fluorescent fusion protein knockout mediated by anti-GFP nanobody. Nat. Struct. Mol. Biol. 19, 117–121 (2012).
Google Scholar
-
Ibrahim, A. F. M. et al. Antibody RING-mediated destruction of endogenous proteins. Mol. Cell 79, 155–166.e9 (2020).
Google Scholar
-
Portnoff, A. D., Stephens, E. A., Varner, J. D. & DeLisa, M. P. Ubiquibodies, synthetic E3 ubiquitin ligases endowed with unnatural substrate specificity for targeted protein silencing. J. Biol. Chem. 289, 7844–7855 (2014).
Google Scholar
-
Chang, S. C. et al. Targeted degradation of PCNA outperforms stoichiometric inhibition to result in programed cell death. Cell Chem. Biol. 29, 1601–1615.e7 (2022).
Google Scholar
-
Fulcher, L. J. et al. An affinity-directed protein missile system for targeted proteolysis. Open Biol. 6, 160255 (2016).
Google Scholar
-
Gosink, M. M. & Vierstra, R. D. Redirecting the specificity of ubiquitination by modifying ubiquitin-conjugating enzymes. Proc. Natl. Acad. Sci. USA 92, 9117–9121 (1995).
Google Scholar
-
Forte, N. et al. Targeted protein degradation through E2 recruitment. ACS Chem. Biol. https://doi.org/10.1021/acschembio.3c00040 (2023).
-
St-Cyr, D. et al. Identification and optimization of molecular glue compounds that inhibit a noncovalent E2 enzyme–ubiquitin complex. Sci. Adv. 7, eabi5797 (2021).
Google Scholar
-
Legg, S., Hunt, J., Gredsted, L. & Minter, R. Fusion proteins comprising an e2 ubiquitin or ubiquitin-like conjugating domain and a targeting domain for specific protein degradation. WO-2022106869-A1. (2019).
-
Sha, F. et al. Dissection of the BCR-ABL signaling network using highly specific monobody inhibitors to the SHP2 SH2 domains. Proc. Natl. Acad. Sci. USA 110, 14924–14929 (2013).
Google Scholar
-
Brzovic, P. S. & Klevit, R. E. Ubiquitin transfer from the E2 perspective: why is UbcH5 so promiscuous? Cell Cycle 5, 2867–2873 (2006).
Google Scholar
-
Roman-Trufero, M. & Dillon, N. The UBE2D ubiquitin conjugating enzymes: potential regulatory hubs in development, disease and evolution. Front. Cell Dev. Biol. 10 https://doi.org/10.3389/fcell.2022.1058751 (2022).
-
David, Y., Ziv, T., Admon, A. & Navon, A. The E2 ubiquitin-conjugating enzymes direct polyubiquitination to preferred lysines. J. Biol. Chem. 285, 8595–8604 (2010).
Google Scholar
-
Fulcher, L. J., Hutchinson, L. D., Macartney, T. J., Turnbull, C. & Sapkota, G. P. Targeting endogenous proteins for degradation through the affinity-directed protein missile system. Open Biol. 7, 170066 (2017).
Google Scholar
-
Stewart, M. D., Ritterhoff, T., Klevit, R. E. & Brzovic, P. S. E2 enzymes: more than just middle men. Cell Res. 26, 423–440 (2016).
Google Scholar
-
van Wijk, S. J. L. et al. A comprehensive framework of E2–RING E3 interactions of the human ubiquitin–proteasome system. Mol. Syst. Biol. 5, 295 (2009).
Google Scholar
-
Branigan, E., Carlos Penedo, J. & Hay, R. T. Ubiquitin transfer by a RING E3 ligase occurs from a closed E2~ubiquitin conformation. Nat. Commun. 11, 1–11 (2020).
Google Scholar
-
Pruneda, J. N. et al. Structure of an E3:E2∼Ub complex reveals an allosteric mechanism shared among RING/U-box ligases. Mol. Cell 47, 933–942 (2012).
Google Scholar
-
Gundogdu, M. & Walden, H. Structural basis of generic versus specific E2–RING E3 interactions in protein ubiquitination. Protein Sci. 28, 1758–1770 (2019).
Google Scholar
-
Kar, G., Keskin, O., Nussinov, R. & Gursoy, A. Human proteome-scale structural modeling of E2–E3 interactions exploiting interface motifs. J. Proteome Res. 11, 1196–1207 (2012).
Google Scholar
-
Poirson, J. et al. Proteome-scale discovery of protein degradation and stabilization effectors. Nature 628, 878–886 (2024).
Google Scholar
-
Foglizzo, M., Middleton, A. J. & Day, C. L. Structure and function of the RING domains of RNF20 and RNF40, dimeric E3 ligases that monoubiquitylate histone H2B. J. Mol. Biol. 428, 4073–4086 (2016).
Google Scholar
-
Baek, K., Scott, D. C. & Schulman, B. A. NEDD8 and ubiquitin ligation by cullin-RING E3 ligases. Curr. Opin. Struct. Biol. 67, 101–109 (2021).
Google Scholar
-
Brownell, J. E. et al. Substrate-assisted inhibition of ubiquitin-like protein-activating enzymes: the NEDD8 E1 inhibitor MLN4924 forms a NEDD8-AMP mimetic in situ. Mol. Cell 37, 102–111 (2010).
Google Scholar
-
Teng, K. W. et al. Selective and noncovalent targeting of RAS mutants for inhibition and degradation. Nat. Commun. 12, 2656 (2021).
Google Scholar
-
Fletcher, A. et al. A TRIM21-based bioPROTAC highlights the therapeutic benefit of HuR degradation. Nat. Commun. 14, 7093 (2023).
Google Scholar
-
Stephens, E. A. et al. Engineering single pan-specific ubiquibodies for targeted degradation of all forms of endogenous ERK protein kinase. ACS Synth. Biol. 10, 2396–2408 (2021).
Google Scholar
-
Gramespacher, J. A., Cotton, A. D., Burroughs, P. W. W., Seiple, I. B. & Wells, J. A. Roadmap for optimizing and broadening antibody-based PROTACs for degradation of cell surface proteins. ACS Chem. Biol. https://doi.org/10.1021/acschembio.2c00185 (2022).
-
Bery, N. et al. KRAS-specific inhibition using a DARPin binding to a site in the allosteric lobe. Nat. Commun. 10, 2607 (2019).
Google Scholar
-
Bery, N., Miller, A. & Rabbitts, T. A potent KRAS macromolecule degrader specifically targeting tumours with mutant KRAS. Nat. Commun. 11, 3233 (2020).
Google Scholar
-
Guillard, S. et al. Structural and functional characterization of a DARPin which inhibits Ras nucleotide exchange. Nat. Commun. 8, 16111 (2017).
Google Scholar
-
Bery, N. et al. A targeted protein degradation cell-based screening for nanobodies selective toward the cellular RHOB GTP-bound conformation. Cell Chem. Biol. 26, 1544–1558.e6 (2019).
Google Scholar
-
Meissner, F., Geddes-McAlister, J., Mann, M. & Bantscheff, M. The emerging role of mass spectrometry-based proteomics in drug discovery. Nat. Rev. Drug Discov. 1–18 https://doi.org/10.1038/s41573-022-00409-3 (2022).
-
Setten, R. L., Rossi, J. J. & Han, S.-P. The current state and future directions of RNAi-based therapeutics. Nat. Rev. Drug Discov. 18, 421–446 (2019).
Google Scholar
-
Hsu, J. H.-R. et al. EED-targeted PROTACs degrade EED, EZH2, and SUZ12 in the PRC2 complex. Cell Chem. Biol. 27, 41–46.e17 (2020).
Google Scholar
-
Orchard, S. et al. The MIntAct project—IntAct as a common curation platform for 11 molecular interaction databases. Nucleic Acids Res. 42, D358–D363 (2014).
Google Scholar
-
Zhou, Y. et al. Metascape provides a biologist-oriented resource for the analysis of systems-level datasets. Nat. Commun. 10, 1523 (2019).
Google Scholar
-
Song, Y., Wang, S., Zhao, M., Yang, X. & Yu, B. Strategies targeting protein tyrosine phosphatase SHP2 for cancer therapy. J. Med. Chem. 65, 3066–3079 (2022).
Google Scholar
-
Bustos, F. et al. RNF12 X-linked intellectual disability mutations disrupt E3 ligase activity and neural differentiation. Cell Rep. 23, 1599–1611 (2018).
Google Scholar
-
Albert, T. K. et al. Identification of a ubiquitin–protein ligase subunit within the CCR4–NOT transcription repressor complex. EMBO J. 21, 355–364 (2002).
Google Scholar
-
Garnett, M. J. et al. UBE2S elongates ubiquitin chains on APC/C substrates to promote mitotic exit. Nat. Cell Biol. 11, 1363–1369 (2009).
Google Scholar
-
Lu, Y., Rosenfeld, R., Simon, I., Nau, G. J. & Bar-Joseph, Z. A probabilistic generative model for GO enrichment analysis. Nucleic Acids Res. 36, e109 (2008).
Google Scholar
-
Osborne, H. C., Irving, E., Forment, J. V. & Schmidt, C. K. E2 enzymes in genome stability: pulling the strings behind the scenes. Trends Cell Biol. 31, 628–643 (2021).
Google Scholar
-
Zhang, J. et al. VHL substrate transcription factor ZHX2 as an oncogenic driver in clear cell renal cell carcinoma. Science 361, 290–295 (2018).
Google Scholar
-
McClellan, A. J., Scott, M. D. & Frydman, J. Folding and quality control of the VHL tumor suppressor proceed through distinct chaperone pathways. Cell 121, 739–748 (2005).
Google Scholar
-
Lim, S. et al. Exquisitely specific anti-KRAS biodegraders inform on the cellular prevalence of nucleotide-loaded states. ACS Cent. Sci. 7, 274–291 (2021).
Google Scholar
-
Macartney, T. J., Sapkota, G. P. & Fulcher, L. J. An affinity-directed protein missile (AdPROM) system for targeted destruction of endogenous proteins. Bio Protoc. 7, e2614 (2017).
Google Scholar
-
Donovan, K. A. et al. Mapping the degradable kinome provides a resource for expedited degrader development. Cell 183, 1714–1731.e10 (2020).
Google Scholar
-
Frigotto, L. et al. Codon-precise, synthetic, antibody fragment libraries built using automated hexamer codon additions and validated through next generation sequencing. Antibodies 4, 88–102 (2015).
Google Scholar
-
Gilbreth, R. N., Chacko, B. M., Grinberg, L., Swers, J. S. & Baca, M. Stabilization of the third fibronectin type III domain of human tenascin-C through minimal mutation and rational design. Protein Eng. Des. Sel. 27, 411–418 (2014).
Google Scholar
-
Lim, S. et al. bioPROTACs as versatile modulators of intracellular therapeutic targets including proliferating cell nuclear antigen (PCNA). Proc. Natl. Acad. Sci. USA 117, 5791–5800 (2020).
Google Scholar
-
Pierce, N. W., Kleiger, G., Shan, S. & Deshaies, R. J. Detection of sequential polyubiquitylation on a millisecond timescale. Nature 462, 615–619 (2009).
Google Scholar
-
Iconomou, M. & Saunders, D. N. Systematic approaches to identify E3 ligase substrates. Biochem. J. 473, 4083–4101 (2016).
Google Scholar
-
Burslem, G. M. et al. The advantages of targeted protein degradation over inhibition: a RTK case study. Cell Chem. Biol. 25, 67–77.e3 (2018).
Google Scholar
-
Wang, M., Lu, J., Wang, M., Yang, C.-Y. & Wang, S. Discovery of SHP2-D26 as a first, potent, and effective PROTAC degrader of SHP2 protein. J. Med. Chem. 63, 7510–7528 (2020).
Google Scholar
-
Asmamaw, M. D., Shi, X.-J., Zhang, L.-R. & Liu, H.-M. A comprehensive review of SHP2 and its role in cancer. Cell. Oncol. 45, 729–753 (2022).
Google Scholar
-
Faust, T. B., Donovan, K. A., Yue, H., Chamberlain, P. P. & Fischer, E. S. Small-molecule approaches to targeted protein degradation. Annu. Rev. Cancer Biol. 5, 181–201 (2021).
Google Scholar
-
Espinoza-Chávez, R. M. et al. Targeted protein degradation for infectious diseases: from basic biology to drug discovery. ACS Bio Med. Chem. Au 3, 32–45 (2023).
Google Scholar
-
Morreale, F. E. et al. BacPROTACs mediate targeted protein degradation in bacteria. Cell 185, 2338–2353.e18 (2022).
Google Scholar
-
O’Brien Laramy, M. N., Luthra, S., Brown, M. F. & Bartlett, D. W. Delivering on the promise of protein degraders. Nat. Rev. Drug Discov. 1–18 https://doi.org/10.1038/s41573-023-00652-2 (2023).
-
Michaelides, I. N. & Collie, G. W. E3 ligases meet their match: fragment-based approaches to discover new E3 ligands and to unravel E3 biology. J. Med. Chem. https://doi.org/10.1021/acs.jmedchem.2c01882 (2023).
-
Ullah, K., Zubia, E., Narayan, M., Yang, J. & Xu, G. Diverse roles of the E2/E3 hybrid enzyme UBE2O in the regulation of protein ubiquitination, cellular functions, and disease onset. FEBS J. 286, 2018–2034 (2019).
Google Scholar
-
Bartke, T., Pohl, C., Pyrowolakis, G. & Jentsch, S. Dual role of BRUCE as an antiapoptotic IAP and a chimeric E2/E3 ubiquitin ligase. Mol. Cell 14, 801–811 (2004).
Google Scholar
-
Zheng, M. et al. Novel PROTACs for degradation of SHP2 protein. Bioorg. Chem. 110, 104788 (2021).
Google Scholar
-
Lin, C.-C. et al. Receptor tyrosine kinases regulate signal transduction through a liquid-liquid phase separated state. Mol. Cell 82, 1089–1106.e12 (2022).
Google Scholar
-
Simpson, L. M. et al. Target protein localization and its impact on PROTAC-mediated degradation. Cell Chem. Biol. https://doi.org/10.1016/j.chembiol.2022.08.004 (2022).
-
Riching, K. M., Caine, E. A., Urh, M. & Daniels, D. L. The importance of cellular degradation kinetics for understanding mechanisms in targeted protein degradation. Chem. Soc. Rev. 51, 6210–6221 (2022).
Google Scholar
-
Windheim, M., Peggie, M. & Cohen, P. Two different classes of E2 ubiquitin-conjugating enzymes are required for the mono-ubiquitination of proteins and elongation by polyubiquitin chains with a specific topology. Biochem J. 409, 723–729 (2008).
Google Scholar
-
Middleton, A. J. & Day, C. L. The molecular basis of lysine 48 ubiquitin chain synthesis by Ube2K. Sci. Rep. 5, 16793 (2015).
Google Scholar
-
Eddins, M. J., Carlile, C. M., Gomez, K. M., Pickart, C. M. & Wolberger, C. Mms2–Ubc13 covalently bound to ubiquitin reveals the structural basis of linkage-specific polyubiquitin chain formation. Nat. Struct. Mol. Biol. 13, 915–920 (2006).
Google Scholar
-
Zheng, N. & Shabek, N. Ubiquitin ligases: structure, function, and regulation. Annu. Rev. Biochem. 86, 129–157 (2017).
Google Scholar
-
Liess, A. K. L. et al. Dimerization regulates the human APC/C-associated ubiquitin-conjugating enzyme UBE2S. Sci. Signal. 13, eaba8208 (2020).
Google Scholar
-
Middleton, A. J., Wright, J. D. & Day, C. L. Regulation of E2s: a role for additional ubiquitin binding sites? J. Mol. Biol. 429, 3430–3440 (2017).
Google Scholar
-
Valimberti, I., Tiberti, M., Lambrughi, M., Sarcevic, B. & Papaleo, E. E2 superfamily of ubiquitin-conjugating enzymes: constitutively active or activated through phosphorylation in the catalytic cleft. Sci. Rep. 5, 14849 (2015).
Google Scholar
-
Thul, P. J. et al. A subcellular map of the human proteome. Science 356, eaal3321 (2017).
Google Scholar
-
Bhuripanyo, K. et al. Identifying the substrate proteins of U-box E3s E4B and CHIP by orthogonal ubiquitin transfer. Sci. Adv. 4, e1701393 (2018).
-
Bartlett, D. W. & Gilbert, A. M. Translational PK–PD for targeted protein degradation. Chem. Soc. Rev. https://doi.org/10.1039/D2CS00114D (2022).
-
Long, M. J. C., Poganik, J. R. & Aye, Y. On-demand targeting: investigating biology with proximity-directed chemistry. J. Am. Chem. Soc. 138, 3610–3622 (2016).
Google Scholar
-
Zhang, A. X. et al. The vital role of proteomics in characterizing novel protein degraders. SLAS Discov. 26, 518–523 (2021).
Google Scholar
-
Jones, L. H. et al. Targeted protein degraders: a call for collective action to advance safety assessment. Nat. Rev. Drug Discov. https://doi.org/10.1038/d41573-022-00055-9 (2022).
-
Jackson, A. L. & Linsley, P. S. Recognizing and avoiding siRNA off-target effects for target identification and therapeutic application. Nat. Rev. Drug Discov. 9, 57–67 (2010).
Google Scholar
-
Wienert, B. & Cromer, M. K. CRISPR nuclease off-target activity and mitigation strategies. Front. Genome Ed. 4, 1050507 (2022).
-
Trapotsi, M.-A. et al. Cell morphological profiling enables high-throughput screening for PROteolysis TArgeting Chimera (PROTAC) phenotypic signature. ACS Chem. Biol. 17, 1733–1744 (2022).
Google Scholar
-
Zhou, C., Bi, F., Yuan, J., Yang, F. & Sun, S. Gain of UBE2D1 facilitates hepatocellular carcinoma progression and is associated with DNA damage caused by continuous IL-6. J. Exp. Clin. Cancer Res. 37, 290 (2018).
Google Scholar
-
Hosseini, S. M. et al. E2 ubiquitin-conjugating enzymes in cancer: implications for immunotherapeutic interventions. Clin. Chim. Acta 498, 126–134 (2019).
Google Scholar
-
Lu, G. et al. UBE2G1 governs the destruction of cereblon neomorphic substrates. eLife 7, e40958 (2018).
Google Scholar
-
Oliveros, J. C. Venny. An interactive tool for comparing lists with Venn’s diagrams (2007).
-
Baens, M. et al. The dark side of EGFP: defective polyubiquitination. PLoS ONE 1, e54 (2006).
Google Scholar
-
Coumans, J. V. F. et al. Green fluorescent protein expression triggers proteome changes in breast cancer cells. Exp. Cell Res. 320 https://doi.org/10.1016/j.yexcr.2013.07.019 (2014).
-
Thess, A. Artificial nucleic acid molecules comprising a 5’top utr. (2013).
Acknowledgements
This work was funded by AstraZeneca and was part of the AZ Post-doc programme. We are grateful to Samuel Gilberto, Alice Fletcher and Michael Winzker for fruitful discussions about bioPROTAC design and for their contribution of screening protocols and reagents. We also thank Bairu Zhang for assistance with the design of global proteomics experiments and Carl Matthews for support with immunofluorescence methods. Graphical abstract was created using Biorender.com.
Author information
Authors and Affiliations
Contributions
Conceptualisation: S.L., R.M., J.H., and J.D.T. Methodology: S.L., R.M., J.H., J.D.T., and A.Z. Formal analysis: J.D.T., S.M.C., K.C., F.P., and R.P. Investigation: J.D.T., N.B., K.C., A.R., F.P., C.B., R.P., T.E., S.L., R.M., and M.B. Writing—original draft: J.D.T. Writing—review & editing: J.D.T., J.H., S.L., R.M., M.B., S.M.C., and D.G.R. Resources: J.D., D.G.R., R.C., and A.Z. Visualisation: J.D.T., S.M.C., and J.D. Project administration: S.L., A.Z., R.M., and J.H.
Corresponding authors
Ethics declarations
Competing interests
All authors are present, or former employees of AstraZeneca. J.D.T., T.M.E., S.M.C., A.R., C.B., N.B., J.H., R.M., M.B., F.P., R.C., D.G.R., A.Z., and J.D. hold AstraZeneca stock. R.M. and S.L. are employees of Alchemab Therapeutics, Cambridge, UK. K.C. is an employee of C4 Therapeutics, Watertown, MA, USA. This work is related to patent WO2022106869A121.
Peer review
Peer review information
Communications Biology thanks the anonymous reviewers for their contribution to the peer review of this work. Primary Handling Editors: Min Zhuang and Laura Rodríguez Pérez. A peer review file is available.
Additional information
Publisher’s note Springer Nature remains neutral with regard to jurisdictional claims in published maps and institutional affiliations.
Supplementary information
Peer Review File
Supplementary Information
Description of Additional Supplementary File
Supplementary Data 1
Supplementary Data 2
Supplementary Data 3
Supplementary Data 4
Supplementary Data 5
Reporting Summary
Rights and permissions
Open Access This article is licensed under a Creative Commons Attribution-NonCommercial-NoDerivatives 4.0 International License, which permits any non-commercial use, sharing, distribution and reproduction in any medium or format, as long as you give appropriate credit to the original author(s) and the source, provide a link to the Creative Commons licence, and indicate if you modified the licensed material. You do not have permission under this licence to share adapted material derived from this article or parts of it. The images or other third party material in this article are included in the article’s Creative Commons licence, unless indicated otherwise in a credit line to the material. If material is not included in the article’s Creative Commons licence and your intended use is not permitted by statutory regulation or exceeds the permitted use, you will need to obtain permission directly from the copyright holder. To view a copy of this licence, visit http://creativecommons.org/licenses/by-nc-nd/4.0/.
Reprints and permissions
About this article
Cite this article
Taylor, J.D., Barrett, N., Martinez Cuesta, S. et al. Targeted protein degradation using chimeric human E2 ubiquitin-conjugating enzymes.
Commun Biol 7, 1179 (2024). https://doi.org/10.1038/s42003-024-06803-4
-
Received: 08 March 2024
-
Accepted: 29 August 2024
-
Published: 19 September 2024
-
DOI: https://doi.org/10.1038/s42003-024-06803-4
Comments
By submitting a comment you agree to abide by our Terms and Community Guidelines. If you find something abusive or that does not comply with our terms or guidelines please flag it as inappropriate.