Study selection
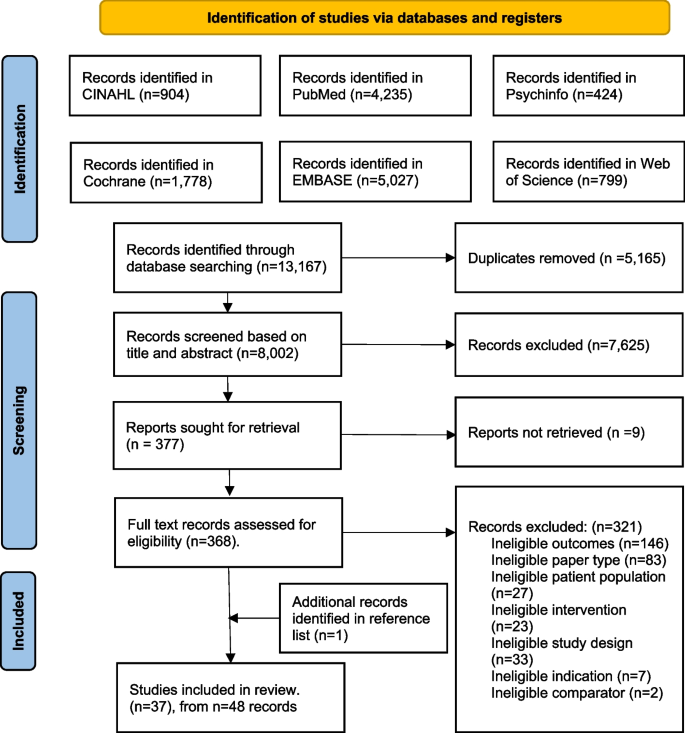
Thirty-seven studies met inclusion criteria, yielding a pooled population of 17,300 participants (see Fig. 1), from five pilot RCTs [35,36,37,38,39], 28 RCTs [40,41,42,43,44,45,46,47,48,49,50,51,52,53,54,55,56,57,58,59,60,61,62,63,64,65,66,67] and four cluster RCTs [68,69,70,71]. Out of the 37 studies, six focused solely on dietary behaviours [38, 42, 44, 48, 58, 65], 28 studies addressed dietary and physical activity behaviours, whilst the remaining three studies also targeted stress management [47, 56] and smoking cessation [57]. Summary of the characteristics of included studies are outlined in Table 2.

PRISMA flow diagram
Twenty-nine studies described their control as receiving standard antenatal care. The definition of standard care varied: they either provided no additional information [35, 36, 38, 40,41,42, 47,48,49,50,51,52, 54, 55, 57, 64, 68, 69]; provided additional information on diet (n = 2) [43, 65], diet and physical activity (n = 6) [39, 53, 60, 61, 66, 71], or GWG (n = 1) [46]; provided access to an educational website with biweekly newsletters with pregnancy and infant care materials (n = 1) [63]; or provided standard nutrition counselling accompanied by study newsletters containing general information on pregnancy related issues (n = 1) [59]. Eight studies described their control group as receiving another intervention which included: the same intervention structure providing generic (not tailored) advice (n = 3) [44, 45, 58], less intensive dietary interventions (n = 4) [37, 56, 62], different dietary recommendations (n = 1) [67] or less intensive and generic information provision (n = 1) [70].
Population characteristics
Five studies included pregnant women with a pre-pregnancy BMI ≥ 25 kg/m2 [37, 39, 45, 49, 63], six included women with a pre-pregnancy BMI ≥ 30 kg/m2 [35, 50, 51, 60, 64, 71] and one study included women with a pre-pregnancy BMI 18.5 to 24.9 kg/m2 [44]. Two studies enrolled only nulliparous women [42, 52] and one study only included women with at least one risk factor for GDM [69].
Intervention characteristics
On average, intervention duration was 20 weeks with initiation in the second trimester of pregnancy: at 15 weeks. Intervention initiation ranged from 8 weeks [41] to 26 weeks [48]. Almost three-quarters (71%, n = 27) of the interventions were shorter than 25 weeks, ranging from 5 to 72 weeks, with five studies including an intervention component postpartum [60, 62, 68, 70]. Twenty-seven studies were delivered in the clinical setting through public or private antenatal care [36, 38, 42,43,44,45,46,47, 49,50,51,52, 54, 55, 57, 58, 60, 65,66,67,68,69, 71]. Interventions were delivered in-person (n = 14) [41, 43, 45, 51,52,53, 56, 58, 60, 62, 66,67,68,69], via telephone calls only (n = 1) [70], via text messages (n = 1) [37], via mobile application (n = 3) [54, 57, 61], or through a different combination of these modalities (n = 18) [35, 36, 38,39,40, 42, 44, 46,47,48,49,50, 52, 55, 63,64,65, 71].
Risk of bias assessment
None of the studies received a low risk of bias in all the areas assessed (Fig. 2). Six RCTs were judged to have only one high risk of bias across all the assessed areas [47, 52, 53, 58, 64, 65]. All studies received an unclear or high risk of performance bias, which is an inherent limitation of dietary behaviour change studies [28]. Over one third of studies (n = 13; 35%) had an unclear to high risk of selection bias, with the majority of these being unclear due to a lack of reporting on how sequence allocation was concealed [35, 37, 42, 44, 46, 51, 55, 59, 62, 68,69,70,71]. Conversely, 97% of the studies received a low risk of bias in random sequence generation, with only one study receiving an unclear rating due to a lack of clarity on how participants were allocated to intervention or control groups [37]. Of the included studies, three received a high risk of attrition bias (attrition ranging from 30 to 77%) [57, 66, 70], and one study received an unclear risk of attrition bias [57, 63, 66, 70]. Five studies did not report conflicting interests and were given an unclear risk of bias in the ‘other’ category [51, 56, 57, 67, 70]. One study received a high risk of bias across four categories [71].

Risk of Bias graph: review author’s judgement about each risk of bias item presented as percentages across included studies
Interventions effectiveness on dietary intake
A wide variety of tools were used to measure dietary outcomes, the most common was a Food Frequency Questionnaire (FFQ) (n = 20) [35, 37,38,39, 43, 45, 48,49,50, 52, 54,55,56, 58, 59, 67,68,69,70,71] of which two FFQs have been validated for use in pregnancy [73, 74] and were used in two studies [49, 60]. The next most common measures were diet diaries (n = 5) [36, 41, 44, 51, 53], 24 h diet recalls (n = 3) [61,62,63], a combination of FFQ and diet diaries (n = 3) [60, 64], diet histories or checklist (n = 3) [10, 40, 67], a combination of FFQ and diet recalls (n = 3) [42, 47, 65], or weighed food records (n = 1) [46]. The method used to capture dietary outcomes was unclear in one study [57]. Six studies reported using tools specifically validated for pregnancy [43, 44, 46, 49, 58, 60]. Dietary data was presented differently across the studies including in serves/day, grams/day, cups/day, and a-priori dietary quality scores (with the most common including the Healthy Eating Index (HEI) scores 2005, HEI-2010, Swedish HEI, nutrition score, and the Mediterranean diet score). Eighty-nine percent (n = 33) reported dietary intake in the third trimester of pregnancy (28 + weeks gestation).
Dietary quality was significantly higher for pregnant women receiving dietary intervention, compared to pregnant women receiving control (16 trials, 7,829 participants in aggregate, SMD 0.49, 95% CI 0.23, 0.75, p = 0.0002), although heterogeneity was very high (I2 = 98%, Q = 393.7, Fig. 3).

Dietary intervention verse control: impact on dietary quality
HEI scores were significantly higher for participants receiving dietary intervention, compared to control participants (6 trials, 4337 participants, SMD 0.22, 95% CI 0.16,0.28, p < 0.00001) and heterogeneity was low (I2 = 0%, Q = 1.3). Mediterranean diet score was significantly higher for participants receiving dietary intervention, compared to those receiving control (6 trials, 2,818 participants, SMD 1.05, 95% CI 0.59,1.51 p < 0.00001), however heterogeneity was very high (I2 = 97%, Q = 145.93). Nutrition scores were significantly higher for participants receiving the dietary intervention, compared to those receiving control (3 trials, 1,634 participants, SMD 0.63, 95% CI 0.32, 0.94, p < 0.00001) and heterogeneity was high (I2 = 88%, Q = 17.12).
A significant between group difference was observed for vegetable intake (15 trials, 5915 participants, SMD 0.22 95% CI 0.13,0.31, p < 0.00001, I2 = 52%), fruit intake (14 trials, 5727 participants, SMD 0.15 95% CI 0.05, 0.24, p = 0.002, I2 = 55%) and dairy intake (6 trials, 4,359 participants, SMD 0.23 95% CI 0.03, 0.43, p = 0.03, I2 = 55%) with higher intakes observed in intervention groups. Due to insufficient data and high heterogeneity in the components that composed these food groups across studies, we were unable to pool the studies reporting the effect of the interventions on intake of meat and alternatives, grains and cereals, and discretionary foods.
Sensitivity analysis excluding studies with three or more high risk of bias scores had little effect on effect sizes. Sensitivity analysis excluding studies that only included women with a pre-pregnancy BMI between 25–29.9 kg/m2 or ≥ 30 kg/m2 significantly reduced heterogeneity for both vegetable (I2 = 52% to I2= 29%) and fruit intake (I2 = 55% to I2= 0%).
Behaviour change techniques
Inter-rater agreement on BCT implementation was 0.72 (Cohen’s kappa). As shown in Table 3, 46 of the available 93 BCTs (49.5%) were used in the studies. Eleven (11.9%) were only used once, with 35 being used between two [54, 70] and 29 [48] times (Median 9, IQR 8–13). Two categories (Goals and planning and Social support) had all BCTs used (n = 9 and n = 3, respectively). An additional four categories (Feedback and monitoring, Self-belief, Comparison of behaviour, and Comparison of outcomes) had over two-thirds of their BCTs used (85.7% (n = 6/7), 75% (n = ¾), 66.7% (n = 2/3), and 66.7% (n = 2/3), respectively). None of the 10 BCTs from the category Scheduled consequences were used in any study. The most common category used was Social support (89%, n = 33 studies), followed by Goals and planning (84%, n = 31 studies) and Comparison of outcomes (84%, n = 31 studies). Individually, the BCTs most used were ‘Social support (unspecified)’ (3.1) (81%, n = 30 studies), ‘Credible source’ (9.1) (78%, n = 29 studies) and ‘Instruction on how to perform a behaviour’ (4.1) (76%, n = 26 studies). The studies that reported the highest number of BCTs used are those that specified which BCTs they had included according to either the BCTTv1 (n = 29) [48] or the CALO-RE taxonomy (n = 20) [62].
Interventions using BCTs from the Reward and threat category were associated with greater vegetable intake (4 trials, 1,048 participants, SMD 0.38 95%CI 0.21,0.55) and a higher dietary quality, (2 trials, 730 participants, SMD 1.43, 95%CI 0.44,2.42), compared to interventions that did not include any BCTs from this category (vegetable: 11 trials, 4,867 participants, SMD 0.16 95%CI 0.09–0.23, p = 0.02; and dietary quality: 14 trials, 7,101; SMD 0.38 95%CI 0.20–0.56, p = 0.04). Importantly, no BCTs were coded that constituted Threats within this category.
Interventions that included the BCT ‘Action planning’ (1.4) from Goals and planning were significantly associated with a higher dietary quality score (10 trials, 4,826 participants, SMD 0.65 95%CI 0.25–1.04, p = 0.03), compared with interventions that did not include this BCT (6 trials, 3,003, SMD 0.21 95%CI 0.14- 0.29).
Conversely, interventions that did not include the BCT ‘Discrepancy between current behaviour and goal’ (1.6) (10 trials, 5,489 participants, SMD 0.66 CI 0.30–1.01) from Goals and planning were associated with a higher dietary quality compared with interventions that did include it (6 trials, 2,340 participants, SMD 0.18 CI 0.02–0.035, p = 0.02). Interventions that did not include the BCT ‘Feedback on behaviour’ (2.2) from the category Feedback and monitoring (8 trials, 2,892 participants, SMD 0.32 95% CI 0.17–0.47) were significantly associated with a greater vegetable intake compared with interventions that did include it (7 trials, 3,023 participants, SMD 0.14 95% CI 0.07–0.21). Effect sizes for BCT categories and individual BCTs can be seen in supplementary file 2.
Intervention features
Data were sufficient to subgroup studies by the professional who delivered the intervention. In studies where the dietary intervention was delivered by a nutrition professional, the difference between the groups receiving the intervention and the control in their dietary quality scores was significant (13 trials, 5,624 participants, SMD 0.57 95% 0.25, 0.88, p = 0.0005, I2 = 96%, Fig. 4). In studies where the dietary intervention was delivered by other health professionals (midwives, nurses, gynaecologists), research staff, and application-delivered interventions, the difference in dietary quality scores between the groups receiving the dietary interventions and those in the control group was still significant but smaller (3 trials, 2,205 participants, SMD 0.20 95% CI 0.11, 0.28, p < 0.00001, I2 = 0%, Fig. 4).

Impact of the dietary intervention versus control on dietary quality: subgrouped by personnel delivering the intervention (nutrition professional, other)
In studies where the dietary intervention delivery included group sessions, the difference between groups receiving the intervention and the control across all measures of dietary intake was significant, including dietary scores (5 trials, 2,287 participants, SMD 0.97 95% CI 0.41, 1.53, p = 0.0007, I2 = 97%), fruit intake (3 trials, 1,002 participants, SMD 0.33 95% CI 0.20,0.45, p < 0.00001, I2 = 0%), and vegetable intake (3 trials, 1,005 participants, SMD 0.43 95% CI 0.31, 0.56, p < 0.00001, I2 = 0%). In studies where the intervention did not include group sessions the difference between intervention and control groups was no longer significant for fruit intake (11 trials, 4,724 participants, SMD 0.09 95% CI −0.00, 0.19, p = 0.05, I2 = 44%) and was significantly smaller for dietary scores (11 trials, 5,542 participants, SMD 0.28 95% CI 0.14, 0.43, p < 0.0001, I2 = 77%) and vegetable intake (12 trials, 4910 participants, SMD 0.15 95% CI0.09, 0.21, p < 0.0001). This was also observed in studies where the intervention was delivered through a combination of group (online or face-to-face) and individualised delivery for dietary quality scores (5 trials, 2,287 participants, SMD 0.97 95% CI 0.41, 1.53, p = 0.0007, I2 = 97%), independent of individualised session delivery mode. In studies where the dietary intervention was delivered through other modalities such as individual face-to-face alone, group sessions alone, or those delivered by application or text message, the difference between the groups receiving the dietary interventions and those in the control group was still significant but significantly smaller (11 trials, 5,542 participants, SMD 0.28 95% CI 0.14, 0.43, p < 0.0001, I2 = 77%). No impact on effectiveness was seen from all other intervention characteristics including the mention of the underlying theory, the number of included BCTs, other forms of intervention delivery (individualised, individualised face to face, individual face-to-face only), frequency of intervention delivery, setting, or duration.
Secondary outcomes
Ten studies reported on GDM incidence diagnosed according to IADPSG criteria and were meta-analysed. Compared with the control group, the incidence of GDM was significantly lower in dietary intervention groups (10 trials, 7,247 participants, RR 0.81 95% CI:0.67,0.97, p = 0.02, I2 = 59%, Fig. 5).

Impact of included interventions on GDM incidence, diagnosed according to IADPSG criteria
Eighteen studies reported on GWG according to IOM criteria and were combined in a meta-analysis. GWG was significantly reduced among those in the dietary intervention group compared with those in the control group (e.g., receiving standard antenatal care, generic advice, and a tailored intervention aimed at restricting fat intake [58, 67]) (18 trials, 8,055 participants, SMD −0.09 95% CI: −0.17 to −0.01, p = 0.03, Fig. 6). Heterogeneity was moderate for both GDM and GWG (I2 = 62% and I2 = 59%, respectively). Eighty percent of studies that reported on GWG and GDM incidence were mixed interventions (combining both physical activity and diet interventions). Eight studies reported on dietary intake postpartum, despite 16 interventions with postpartum follow up [48, 49, 57, 59, 60, 62, 68, 71]. Due to high heterogeneity in dietary measures and timeframes the BCTs used to sustain dietary change postpartum were unable to be meta-analysed.

Impact of included interventions on gestational weight gain (according to Institute of Medicine criteria)
Fidelity and engagement
A diverse range of fidelity measures were reported by a fifth of the included studies (Table 4). These measures included adherence to protocols and random sample reviews. Engagement was measured by tracking participant dropout, session attendance, lost to follow up and those receiving allocated intervention. These engagement measures ranged widely from 0 to 66%. Quantitative usage measures were reported by 68% of included studies, with studies using biomarkers (e.g., urinary hydroxytyrosol) to assess dietary adherence, while others relied on self-reported measures like satisfaction surveys and dietary implementation reports. Table 4 summarises fidelity and engagement measures used.