Abstract
Fitness movement recognition and evaluation systems play a crucial role in accurately, quantitatively, and efficiently guiding the fitness process, thereby enhancing fitness effectiveness and safety.However, existing research in this area still has some drawbacks, such as high computational complexity, insufficient real-time performance, and low stability. To address these issues, a real-time fitness action recognition and evaluation system is developed based on the lightweight BlazePose model. The system integrates the K Nearest Neighbor (KNN) algorithm for action recognition and classification. In addition, an improved dynamic time warping (S – WFDTW) algorithm is introduced. By utilizing similarity calculations, this algorithm quantifies the metrics and significantly improves the real-time alignment of the time series. Moreover, it provides joint angle analysis and motion trajectory feedback, which enables real-time counting and evaluation of fitness movements. The experimental results demonstrate that the system achieves 98.33% accuracy in movement assessment and counting under complex conditions. In a comparison experiment with the COCO dataset, the average processing rate of the BlazePose model used by the system is 13.3 times faster than that of OpenPose. This significant improvement greatly enhances the efficiency and responsiveness of the system. In conclusion, the developed system achieves efficient and stable recognition of fitness movements, and is able to accurately assess and quantify exercise performance. It can also help users optimize their movements through visual feedback, thus significantly improving the efficiency and accuracy of fitness movement recognition and evaluation.
Validation of Amazon Halo Movement: a smartphone camera-based assessment of movement health
A Human Motion Data Capture Study The University of Liverpool Rehabilitation Exercise Dataset
Functional movement screen dataset collected with two Azure Kinect depth sensors
Introduction
The national fitness strategy has significantly boosted public enthusiasm for fitness. However, the fast-paced lifestyle has made fitness time limited, fragmented, and irregular. As a result, the traditional gym-based fitness model can no longer meet the emerging demands. While home fitness allows people to utilize fragmented time, the lack of professional guidance often leads to ineffective workouts and even injuries. Consequently, the demand for home fitness assessment is becoming increasingly urgent, triggering the continuous emergence of numerous intelligent devices. Intelligent fitness assessment equipment can track, evaluate, and visualize the fitness process. It not only enables the timely correction of incorrect movements to prevent sports injuries but also provides real-time professional assessment and guidance, saving the economic cost of hiring a professional coach.
Currently, fitness assessment systems can be primarily classified into two main categories according to their underlying principles: wearable sensor – based systems1,2,3 and vision – based analysis systems4,5,6.
Earlier research on fitness assessment systems predominantly employed wearable sensor technology, demonstrating the application of diverse sensor technologies and algorithms for fitness movement monitoring and recognition. Chang et al.7 effectively tracked hand movements and body postures through accelerometers to identify the movement type and record the movement count; however, it lacked the capacity to assess the movements comprehensively. Yutao Liu8 proposed a nine – axis MEMS inertial sensor fusion scheme, offering a more comprehensive perspective for posture measurement and motion description. Nevertheless, the design of his wearable human motion capture system, with wired connections between sensor nodes and data aggregation nodes, not only made wearing cumbersome but also hindered the user’s normal movement. Skawinski et al.9 utilized a wireless Movesense sensor to recognize and count four different types of workouts (push – ups, sit – ups, squats, and open – close jumps). However, the recognition rate of movement types was low because the sensor could only capture data such as acceleration and angular velocity, lacking complete visual information about the movements. Despite the advantages of these techniques in movement data acquisition, they often encounter issues such as high cost and inconvenience in use.
Vision – based analysis systems are gradually garnering significant attention in the fields of motion monitoring, action recognition, and health assessment due to their merits of eliminating the need for wearable devices, ease of deployment, and facilitation of long – term monitoring. Vision – based analysis systems are mainly divided into two types: Kinect depth camera – based systems and computer vision – based systems.
The Kinect – based depth camera exhibits high – performance advantages in motion monitoring and movement analysis. Xinyi Hu et al.10 employed the Kinect camera as the core for the corrective analysis of badminton technical movements, acquiring real – time image data of the user’s forehand and backhand swinging movements, calculating certain joint angles, and judging whether they exceeded the set thresholds to provide feedback suggestions for movement correction. However, the high computational complexity of this method results in poor real – time performance, and the constraints of specific environments and settings limit the system’s universality and portability. Long Jiahao et al.11 evaluated the push – up movement by extracting joint – point coordinate data and calculating joint angles. Although the problem of high computational complexity and poor real – time performance was addressed, the system only provided a sequence comparison map of four angle features due to the relatively single extracted features, resulting in a lack of comprehensiveness and accuracy in the evaluation. The Kinect depth camera holds strong application potential in motion monitoring and movement analysis but is restricted by specific environment and setting constraints, computational complexity, poor real – time performance, and thus, the universality and practicability of the system need further enhancement.
Meanwhile, computer vision – based motion monitoring methods have attracted substantial attention for their universality and flexibility, especially the application of tools such as OpenPose12,13,14,15 in fitness action monitoring and classification. Gang Liu et al.13 achieved binary classification of postures by using OpenPose and SVM techniques to classify features at keypoints in sit – up video streams, yet lacking the assessment of movement accuracy. Jian Mei et al.16 improved the action recognition accuracy and introduced action evaluation by optimizing the YOLOv5 algorithm, while Xia – Ling Wu et al.17 designed a lightweight fitness movement evaluation system. However, the Dynamic Time Warping (DTW) algorithm utilized in the system may introduce misalignment issues, potentially affecting the evaluation accuracy. Additionally, the high computational complexity of the DTW algorithm may impede the system’s real – time performance.
To sum up, although wearable and vision – based analysis systems have made remarkable progress in their respective technical domains and have practical applications, they still generally confront problems such as low accuracy, lack of fluency, and a trade – off between real – time performance and user experience.
In the existing research on fitness assessment systems, despite the notable progress made by wearable and vision – based analyzing systems in their respective technical fields and their practical applications, there remains a prevalent imbalance between real – time performance and user experience. Especially in the real – time monitoring and feedback of complex movements, many studies overly concentrate on improving algorithm accuracy while neglecting the control of model parameter quantity, resulting in screen lag of the fitness system in practical applications. To tackle this problem, this paper proposes a vision – based fitness action recognition and evaluation system, with a focus on lightweighting the human posture estimation model and stabilizing the accuracy. Meanwhile, weighting, window – limiting, and pruning strategies are introduced to enhance the S – WFDTW algorithm, optimize the efficiency and accuracy of time – series matching, and significantly enhance the real – time performance and stability of the system. By comparing and analyzing the movement trajectory and joint angle, real – time feedback and scoring can be provided to realize the dynamic evaluation of the user’s fitness movement, assisting the user in better correcting the movement and reducing the risk of injury.
Fitness movement recognition and evaluation system design
The vision-based fitness action recognition and evaluation system mainly consists of five parts: video frame acquisition, human posture recognition and classification, action evaluation and counting, and visualization interface, as shown in Fig 1.
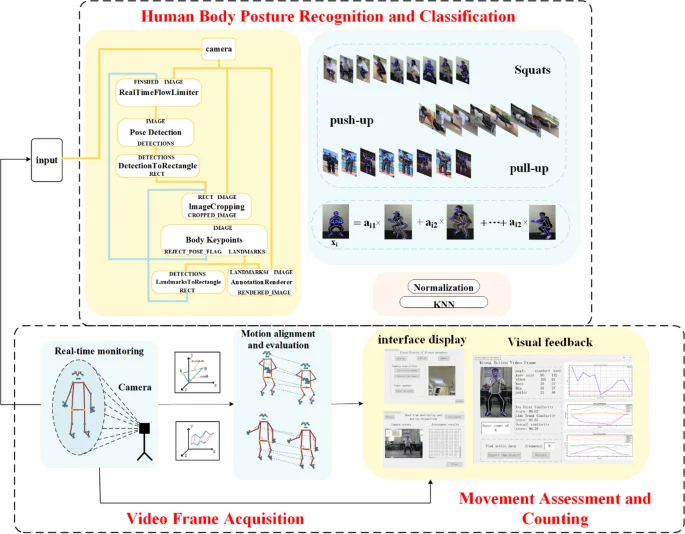
System core function structure diagram. The data in the figure is from the dataset built in this paper.
The system monitors users’ fitness movements in real time and utilizes the lightweight model BlazePose for pose estimation and keypoint coordinate extraction.Then the Euclidean distance between feature vectors and pose embedding vectors is calculated by PCA (Principal Component Analysis) downscaling and max-min normalization to eliminate abnormal samples. After that, the KNN algorithm is used to classify the actions and combined with the improved S-WFDTW algorithm for real-time scoring and counting. Ultimately, the system generates action sequence data and scores the actions to provide real-time fitness assessment and feedback.
Human body posture recognition and classification
Human posture recognition and classification mainly includes two parts: the lightweight BlazePose algorithm for posture detection, and the improved S-WFDTW algorithm.
BlazePose based pose detection
The system deploys BlazePose, which is MediaPipe’s human posture detection model, for the real – time detection of fitness movements. BlazePose18, a state – of – the – art model, employs an efficient convolutional neural network (CNN) architecture, in conjunction with depth – separable convolution and downsampling – upsampling strategies. This sophisticated combination effectively curtails the computational workload and the number of model parameters. By doing so, it ensures high – level accuracy while minimizing the consumption of computational resources, vividly demonstrating its lightweight characteristics. Moreover, BlazePose adopts a multi – stage pose estimation process, encompassing target detection and pose regression. Through a step – by – step refinement in processing, the computational burden of each stage is alleviated, thereby enhancing the overall processing efficiency19.
Initially, the human body region is identified via target detection, and the corresponding image is cropped. This cropped image serves as the input for subsequent pose estimation. Subsequently, the model predicts the locations of human keypoints, such as the head, shoulder, knee, and so on, through a regression method. It then outputs the 2D coordinates of each keypoint along with its confidence level. The 33 human pose keypoint locations and serial numbers established by the BlazePose model20 are graphically illustrated in Fig. 2(a), and the controls Fig. 2(b) are labeled with their keypoint numbers and names in abbreviated form Detailed human pose keypoint names and sequence numbers are shown in Fig. 2(b).
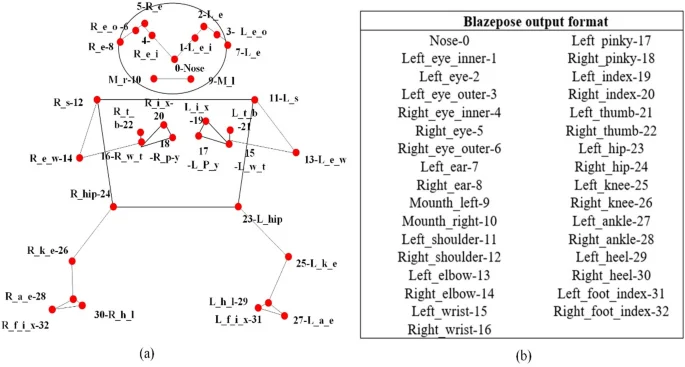
Location of keypoints; (a)skeletal joints, (b)BlazePose model keypoint ordinal numbers.
Improved S-WFDTW algorithm
During the fitness process, the fact that different individuals execute the same movement at varying speeds leads to a significant issue in the movement evaluation system. Specifically, there exists a time – sequence disparity between the video to be evaluated and the standard video. As a result, the time axes of the two are not completely aligned. If the Euclidean distance or other conventional sequence comparison methods are directly applied, the similarity between them cannot be accurately measured. To tackle this problem, researchers predominantly resort to the dynamic time regularization DTW21 technique. By adeptly handling the non – linear distortion within time series, DTW aims to identify the optimal matching path, thereby enabling more precise action comparison.
However, the traditional DTW algorithm is not without its limitations. During the alignment process, it is prone to mis – matching, particularly when a user’s action corresponds to multiple standard actions. This situation can easily result in misalignment, consequently undermining the accuracy of subsequent action evaluations. Moreover, the DTW algorithm exhibits a high temporal complexity, which gives rise to substantial computational requirements and significant latency. As a consequence, it is ill – suited for scenarios demanding real – time performance.
In this paper, the proposed S – WFDTW algorithm represents an advancement over the DTW algorithm. It optimizes the efficiency and accuracy of time – series matching by incorporating weighting, window restriction, and pruning strategies. The improved S-WFDTW algorithm employs the weighted Euclidean distance, which can effectively accentuate the time – series data that warrants particular attention. Through the adjustment of weights, S-WFDTW conducts holistic action matching, thereby reducing the incidence of mis – matching. Subsequently, the window – restriction and pruning – strategy optimization methods are utilized to circumscribe the search space and eliminate superfluous calculations. This effectively curtails the computational load, rendering the S-WFDTW algorithm more amenable to fitness action evaluations with stringent real – time requirements.
-
1.
Weighted dynamic time-regularized distance.
The S-WFDTW algorithm optimizes time series matching by introducing a weighted Euclidean distance. The weighted Euclidean distance can highlight the time series data that need to be concerned, thus reducing the occurrence of false matching. Specifically, for the i and j points in the sequences X and Y, the distance is calculated as follows:
Where (:{x}_{i,k})and (:{text{y}}_{i,k}) denote the coordinates of the i and j points in the sequence X and Y in the k dimension, respectively.
(:{text{w}}_{text{k}}) is the weight of the k dimension, which determines the importance of this dimension in the calculation of distance.
The goal of S-FDTW is to find an optimal matching path that minimizes the matching cost from (:{x}_{1}) to (:{x}_{i}) and from (:{y}_{1}) to (:{y}_{n}) through dynamic programming with the recursive formula:
where (:{text{D}}left( {{text{i}},{text{j}}} right)) denotes the cumulative minimum distance from the starting point to point (i, j), and (:{text{d}}_{text{i}text{j}}) denotes the weighted Euclidean distance of the two time points (see Eq. 1), which represents the minimum historical cumulative distance from the starting point (1,1) that moves progressively rightward, downward, or diagonally to the current position (i, j).
The three fitness movements studied in this paper (push-ups, pull-ups, and squats) were all based on vertical movement (y-axis), but we paid special attention to the differences in the x-axis during the evaluation process. Subsequent experimental validation showed that when (:{x}_{weight})=1.5 and (:{y}_{weight})=1.0, the differences in different axial directions can be better captured, which significantly improves the alignment effect.
-
2.
Sliding window.
In order to improve the efficiency of path matching and reduce the amount of computation, the system reduces the search space by restricting the window range of matching path search, especially in the case of high real-time requirements, this restriction can effectively avoid ineffective computation. That is, the window size is set to w, and the matching calculation is performed only when ∣i-j∣ ≤ w. Considering that the system detects keypoints every 5 frames and the standard video is aligned with the user video every 2 s, the bandwidth w is set to 10 frames.
-
3.
Pruning strategy.
The system introduces a pruning strategy to avoid the computation of invalid matching by dynamically adjusting the matching threshold and adaptive distance. In order to solve the possible invalid matching problems in the DTW algorithm, such as large errors caused by irregular movements (waist collapse or hip cocking, etc.), the system adopts an adaptive setting of the matching threshold with the following formula:
where (:{text{D}}left( {{text{i}},{text{j}}} right))denotes the minimum matching distance or the minimum cumulative distance, and (:{{upepsilon:}}_{text{d}}) is the adaptive distance used to control the matching leniency. When the cumulative distance exceeds the threshold h (h = 20 is set in the experiment), the related matching computation will be skipped, avoiding the waste of invalid matches, and this strategy is called early termination.
-
4.
Algorithmic comparison of S-WFDTW and DTW.
Figure 3 compares the alignment paths of DTW and S-WFDTW. In Fig. 3(a), the traditional DTW path shows potential mismatches, while Fig. 3(b) demonstrates how S-WFDTW restricts the search space with a sliding window.
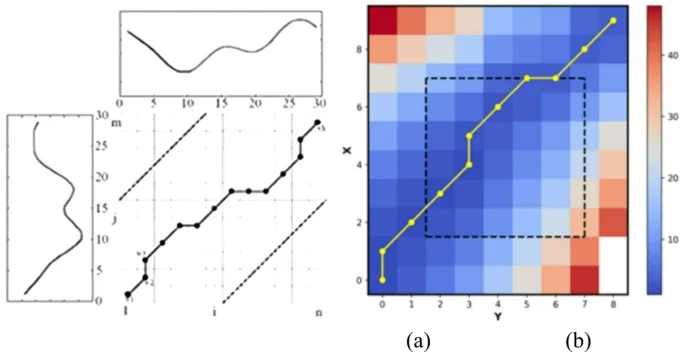
Comparison of DTW alignment and S-WFDTW alignment paths, (a) DTW alignment paths, (b) S-WFDTW alignment paths.
As shown in Fig. 3(a), Dynamic Time Warping (DTW) measures the degree of matching between two time series by constructing a distance matrix. In DTW, the distance matrix is populated by calculating the difference between each time point, and the optimal matching path between two sequences is found step by step by utilizing the minimum cumulative distance from the starting point to each position. However, DTW faces the problem of large computational volume when dealing with large-scale data and is prone to lead to misalignment when there is a difference in the length of the time series or an inconsistent number of actions.
In contrast, S-WFDTW optimizes computational efficiency by introducing adaptive thresholding and sliding window limits. As shown in Fig. 3(b), the calculated cumulative distance matrix is displayed through a heat map, and the color shades indicate the cumulative distances at different locations, and the darker the color the larger the distance. According to the set adaptive threshold, when the cumulative distance of a path exceeds the threshold, the path will be marked as infinite, thus skipping the calculation. The black dashed line in the figure marks the restriction window area, and paths outside this area will be ignored. The yellow line, obtained by connecting the nodes with the minimum cumulative distance, indicates the optimal path from the bottom right corner to the top left corner, which is calculated by backtracking.
To summarize, S-WFDTW is able to handle time series matching more efficiently than traditional DTW, especially for time series with different lengths or different movements, through the adjustment of thresholds, restriction windows and weights. The algorithm not only improves the computational efficiency, but also reduces misalignments, which makes it more suitable for real-time fitness action evaluation tasks.
Movement assessment and counting
Fitness movement assessment focuses on comparing and evaluating the movements in the standard video with the movements in the video of the fitness practitioner following the exercise, and combines Euclidean distance22 and cosine similarity23 to assess the similarity of fitness movements. Euclidean distance was used to measure the actual distance between keypoints, and cosine similarity assessed angular differences between keypoints. Movement scores were derived for each video frame by calculating the deviation of keypoints and limb angles. The final score is a weighted average of the keypoint scores and limb angle scores, and the number of successful movements is counted when a set threshold is exceeded.
The Euclidean distance is calculated as a straight line distance between two points in space, and its formula under the two-dimensional plane is shown in Eq. 4:
Where A represents the keypoint of the standard movement, B represents the keypoint of the movement to be detected, and (, ) and (, )are the coordinates of points A and B, respectively. The method mainly measures the actual distance between the two points, but this may lead to errors in the similarity metric due to differences in human height proportions.
The cosine similarity measure, on the other hand, evaluates the similarity of two vectors by calculating the cosine of the angle between them. The formula in two dimensions is shown in Eq. 5:
where both A and B denote vectors. The method focuses on the differences in the limb pinch angle described by the keypoints without considering the height scale of the human body.The similarity between A and B ranges between [−1, 1], and the closer the pinch angle is to 0 degree, the higher the similarity value is.
In order to evaluate the fitness movements, this paper scaled the human skeleton in the standard fitness video to the same scale as the skeleton in the follow-along video, and then calculated the distance between the same keypoints on these two skeletons by the Euclidean distance, which is denoted as (:{D}_{p}), where the value of p is in the range of [0, 32]. A threshold T (action time sequence length) was set equal to the length of the user’s torso, and the score for each keypoint was calculated according to Eq. 6:
The overall rating 1 on each frame of the video is taken as the average of all the keypoint ratings and is calculated as shown in Eq. 7:
Based on the analysis of the human skeleton, there are 13 limb structures. The limb offset was calculated by cosine similarity to calculate the angle with the horizontal line, and the angular difference between the user’s movement and the same limb of the standard movement was labeled as (:{D}_{l}), where the range of l is [0, 12]. The scoring of the limb angle deviation is labeled as , and the calculation formula is shown in Eq. 8:
The overall score 2 in each video frame is the average of all the keypoint scores, which is calculated as shown in Eq. 9:
The final score of each frame is the weighted average of 1 and 2, and the formula is shown in Eq. 10:
In this paper, the weights = 0.2 and = 0.8 were chosen to calculate the final score. Since the accuracy of limb angle has a direct impact on the movement standardization, giving higher weights (β = 0.8) can better assess the accuracy of the movement, while the keypoint distance score S1 may be affected by factors such as height, and therefore has lower weights (α = 0.2). This setting helps to improve the accuracy and reliability of the assessment results. Finally, movement counting was performed by setting a threshold, and the number of successfully completed movements was only counted if the final score exceeded 80.
Visualization interface
This system uses Python to design the visualization interface. The interface mainly consists of system home page, real-time fitness movement monitoring page and movement analysis page.
-
1.
System home page: provides users with three types of fitness movement assessment functions and selects the video capture method (using camera capture or input video). The home page interface is shown in Fig. 4.
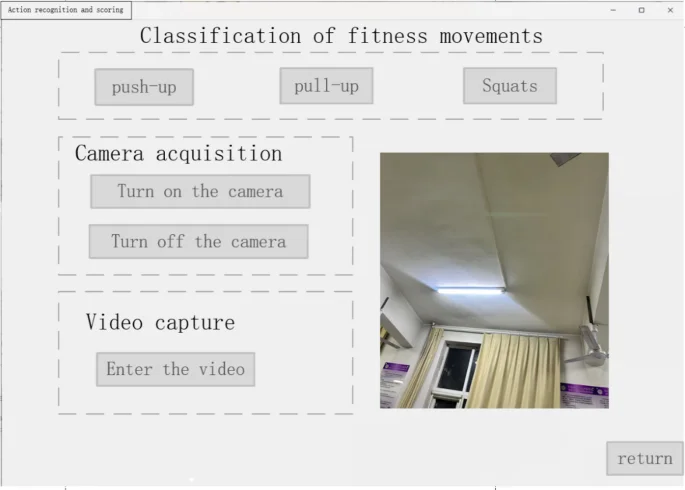
System home page.
-
2.
Real-time fitness action monitoring page: once the user selects the collection method on the system’s homepage, a redirection to the real – time monitoring page occurs. On this page, the system undertakes the recognition and classification of the user’s fitness actions. Subsequently, it fetches the corresponding standard fitness action video from the database and conducts similarity computations with the user’s actions. Meanwhile, the page presents, in real – time, the user’s fitness screen captured by the camera. The page demonstrating the fitness action evaluation results is depicted in Fig. 5.
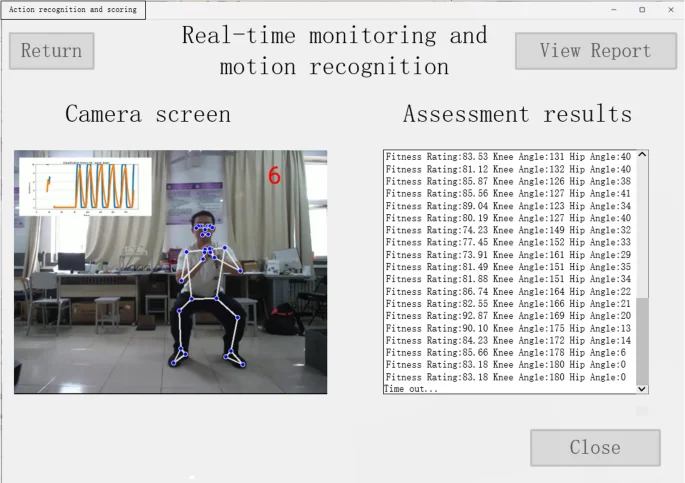
Real-time fitness movement monitoring page.
The system performs action scoring every 2 s, which is mainly based on the similarity assessment algorithm, with a scoring interval of [0, 100], and the higher the similarity, the higher the scoring.
-
3.
Action analysis page: after clicking the end button on the real-time fitness action monitoring page, the user clicks View Report to jump to the action analysis page, and at the same time, the generated report is stored in the database, which is shown in Fig. 6.
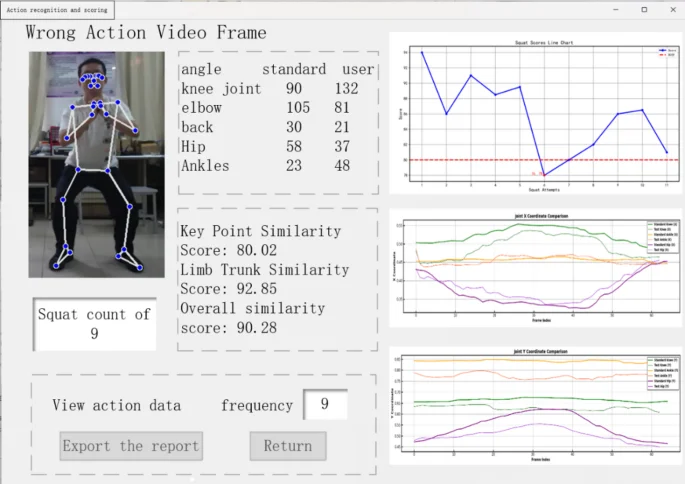
Action analysis page.
The movement analysis page offers visual feedback, enabling users to effortlessly review their movement assessment scores and the count of valid movements. Users have the option to selectively view their initial several movements. This analysis page encompasses a movement count and score module, a joint angle data comparison module, a fitness movement score line graph, and a focused key-point movement trajectory comparison graph.
System performance verification
To ensure the comprehensiveness and representativeness of the data, six testers with large differences in height and weight and different genders were selected for the experiment (gender ratio 3:1, BMI range 18.5–28.4), who were 183 cm/74 kg, 178 cm/83 kg, 178 cm/77 kg, 178 cm/80 kg, 174 cm/70 kg and 166 cm/60 kg (female) physical characteristics. During data collection, testers performed 3 types of movements (squat/push-up/pull-up) under different lighting conditions (mixed natural/artificial light scenarios), site environments, and shooting distances, with 40 video samples in each type to ensure the diversity and comprehensiveness of the data. 40 video samples were collected for each type of movement, which served as the base data for subsequent categorization and evaluation. The video resolution was 1920 × 1080 with a frame rate of 30 fps. Meanwhile, three additional videos of standardized movements were collected to provide reference and comparison as standard material for evaluation and comparison.All research participants have signed informed consent forms to publish the information/image(s) and the patient photographs and other information included in the article have been authorized and consented by the patients.As shown in Fig. 7, the keypoint labeling diagrams of one tester when performing the three fitness movements are shown.
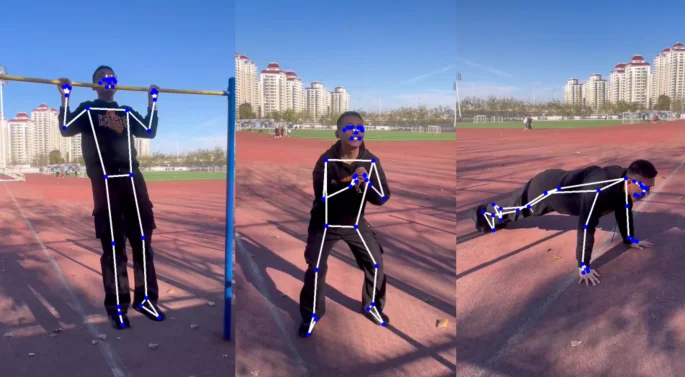
Extraction of keypoint coordinates.
In order to improve the accuracy of action recognition and evaluation, the system is optimized through the steps of data preprocessing, feature extraction and normalization. In terms of data acquisition, in order to facilitate the extraction of effective image data from the movement videos of the athletes, the system extracts images from the video files at a rate of 5 frames per second, which constitutes the experimental dataset. In the feature extraction stage, taking the squatting action as an example, the system divides the image samples into two states: “completely squatting” and “completely standing up”, and accurately extracts the coordinates of the keypoints of the human body through the BlazePose model, and transforms them into feature vectors, which are able to represent the relative values of the keypoints of the human body. The vectors can represent the relative positions and directions of the keypoints of the human body, thus providing key data for subsequent analysis.
The key-point data were downscaled by employing the Principal Component Analysis (PCA) algorithm. This step aimed to retain the principal features while minimizing redundant information24. To mitigate the impact of individual differences in height and body dimensions on the data, the key-point coordinates underwent max-min normalization. Regarding the identification of anomalous samples, the Euclidean distance between the embedding vector of each sample and the embedding vector of the input pose was calculated. A larger distance implies a more substantial difference between the two feature vectors, indicating a higher likelihood of the sample being anomalous data. When the threshold is set at 1.0, if the Euclidean distance between the embedding vector of the sample and the input-pose embedding vector exceeds 1, the sample is likely to be anomalous. Samples with a distance from the input pose embedding vector surpassing the preset threshold are flagged as outliers and subsequently removed from the dataset.
A KNN classifier was used for fitness movement classification25. The model performs classification by converting human features into vectors and calculating the similarity between these vectors. The confidence level for each category is calculated through Eqs. 11, 12, and 13. Assuming that among the k nearest-neighbor samples, m belong to the category of “squat”, n belong to the category of “push-up”, and p belong to the category of “pull-up”, the confidence level is calculated as follows The confidence level is calculated as follows:
where K denotes the number of nearest neighbors. In this experiment, K = 3 is set, i.e., 3 nearest neighbors are considered. Among these 3 neighbors, if the number of samples in a category in the category exceeds a threshold, the category is marked as the current fitness action category.
In order to improve the generalization ability of the model, the dataset was divided into training and test sets in the ratio of 7:3. The confidence threshold is set to 0.6, if the confidence level of the current action exceeds the threshold, the model will consider that the current video frame corresponds to that action. For example, if the confidence level of “squat” exceeds 0.6, the frame will be labeled as squat. Figure 8 shows the confusion matrix of the KNN classification model, demonstrating the recognition between the action categories (squat: a, push-up: b, pull-up: c).
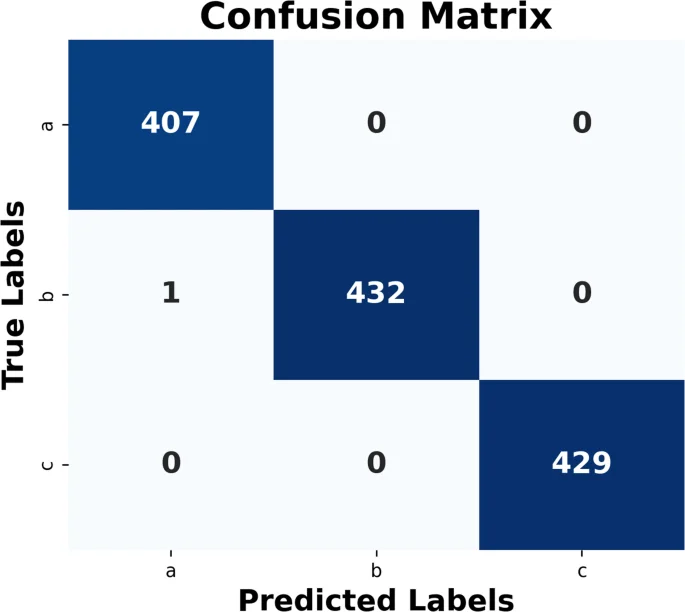
Confusion matrix for classification models.
Motion recognition verification
BlazePose comparison experiment
To verify the accuracy and objectivity of human joint recognition results, an experiment was conducted to compare BlazePose and OpenPose on the COCO dataset26. The Percentage of Correct Keypoints (PCK), a human posture estimation index, was employed to evaluate the human joint recognition results separately. PCK represents the proportion of the normalized distance between the detected joint coordinates and their corresponding true annotations (ground truth) that is less than a predefined threshold. The definition of PCK is presented in Eq. 13:
In the above Eq. 13, N is the total number of joints, d_i corresponds to the Euclidean distance between the recognized i joint and the manually labeled value, (:{d}_{det}) denotes the scale factor, and the diameter of the human head is taken in the experiments, T denotes the judgment threshold, δ is the judgment law, and the judgment is established by taking 1,otherwise it is 0.
Table 1 Data comparison of recognition accuracy and rate.
As can be seen from Table 1, there are significant differences between OpenPose and BlazePose in terms of accuracy, PCK (correctness of keypoints) and processing speed.
In terms of accuracy and PCK, OpenPose performs better. Specifically, in the high-end workstation configuration, the accuracy of OpenPose is 0.81 and PCK is 0.83, while the accuracy of BlazePose is 0.69 and PCK is 0.77; in the ordinary PC configuration, the accuracy of OpenPose is 0.78 and PCK is 0.81, which is still better than BlazePose. This shows that OpenPose is more accurate in terms of joint recognition accuracy, which is suitable for application scenarios that require higher accuracy.
In terms of processing speed, BlazePose significantly outperforms OpenPose; in the high-end workstation, the processing time of BlazePose is only 0.0075 s, while that of OpenPose is 0.1070 s, which is 13.3 times faster than OpenPose; in the ordinary PC, the processing time of BlazePose is 0.0220 s, while that of OpenPose is 0.1070 s, which is 13.3 times faster than OpenPose. On a regular PC, BlazePose’s processing time is 0.0220 s, compared to 0.2931 s for OpenPose. This speed difference makes BlazePose more suitable for real-time applications with low latency and high performance requirements, especially in environments with limited computing resources. In this paper, BlazePose is better suited for the application scenarios, while OpenPose is suitable for applications that prioritize accuracy.
Validation of the S-WFDTW algorithm
In order to validate the advantages of the improved S-WFDTW algorithm in terms of alignment quality and to determine the optimal adaptive distance and weight parameters, several sets of experiments were conducted. Different adaptive distance parameters ε_d and weighting coefficients were set for the knee (squat) as well as elbow (pull-up and push-up) motion trajectory samples and matched using the S-WFDTW algorithm.
In this paper, the S-WFDTW algorithm at (:{epsilon:}_{d})=20, (:{:x}_{weight}=1.5)and (:{:y}_{weight}=1.0),is able to reduce the time complexity while maintaining high matching accuracy. Figure 9(a)(b)(c) demonstrates the effect of DTW and S-WFDTW in the alignment of feature curves for three types of fitness movements (squat, push-up, pull-up) for the same user. Where the blue line represents the joint motion trajectory of the standard video, the red line represents the user’s joint motion trajectory, and the dashed line indicates the alignment effect of the two trajectories.
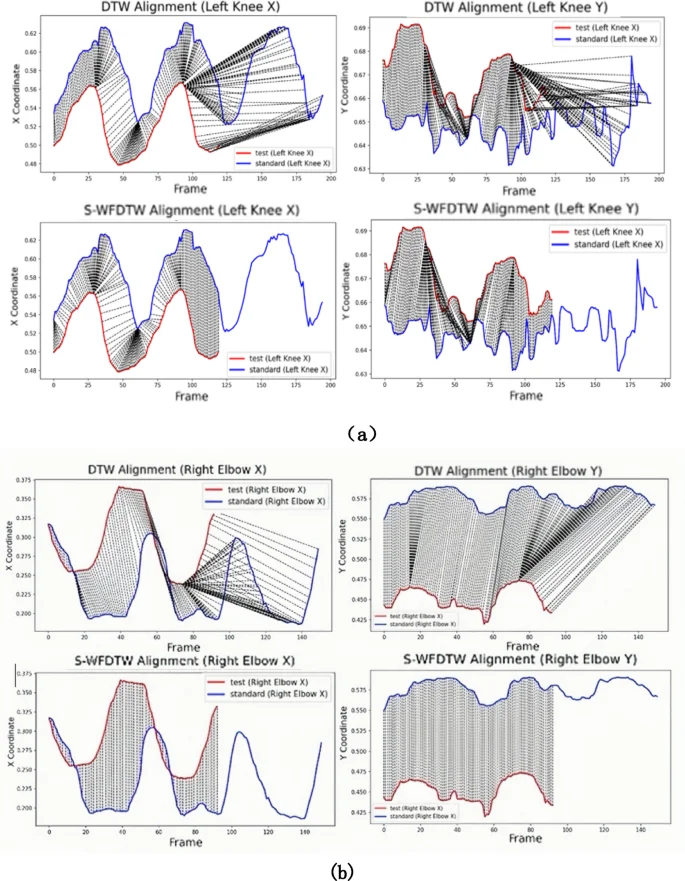
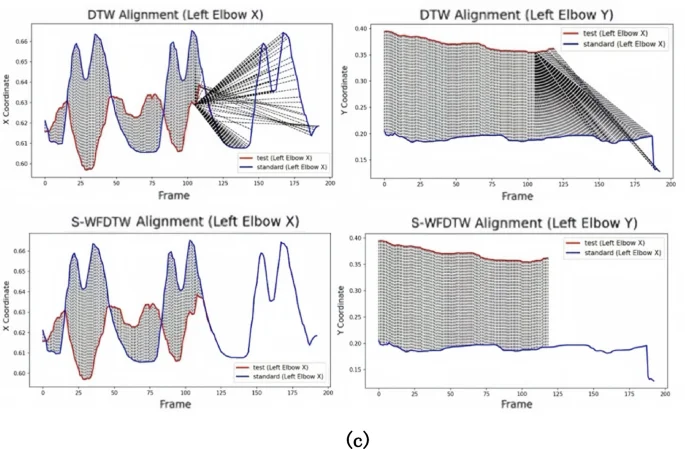
Alignment effects of characteristic curves for three types of fitness movements. (a) deep squats (b) pull-ups (c) push-ups.
To validate the alignment performance of the algorithm, this study conducted experiments where the standard video featured three movements, while the user only completed two during real – time monitoring. As an example, the DTW algorithm aligns the user’s two deep squat movements with the three movements in the standard video in Fig. 9(a). In contrast, the S-WFDTW algorithm achieves more precise alignment by weighting the x and y coordinates and more accurately controlling knee – position changes. The S-WFDTW algorithm prioritizes the alignment process to ensure a match between the two movements, effectively reducing misalignment. Meanwhile, the DTW algorithm lacks strict attention to precise action alignment, potentially leading to mismatches. Meanwhile Figs. 9(b) and 9(c) show the movement alignment effects for push-ups and pull-ups respectively.
In summary, the DTW algorithm focuses on minimizing the total distance between two sequences without strictly considering precise action alignment. Thus, it may generate matching errors, especially for complex actions. Conversely, the S-WFDTW algorithm, through the introduction of a weighting mechanism and dynamic time – window restriction, not only enables more precise action alignment and reduces mismatches but also optimizes the computational efficiency of the matching process.
To further assess the improvement of the S-WFDTW algorithm over the traditional DTW algorithm, we performed comparison experiments on six testers for three movements: deep squats, push – ups, and pull – ups. We compared the performance of the two algorithms in terms of matching time and minimum distance. Figure 10 presents the specific comparison results.
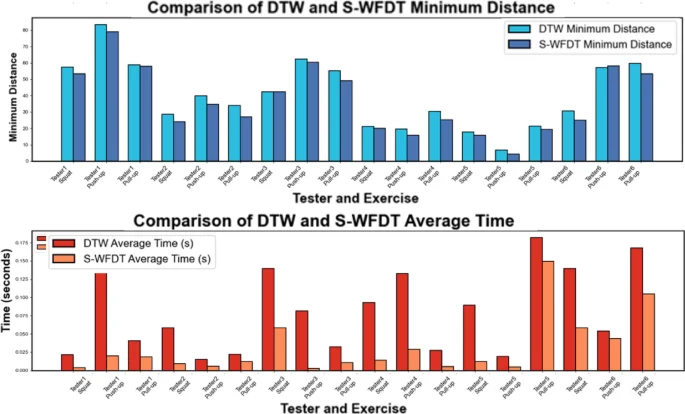
Comparison of matching time and minimum distance.
From Fig. 10, it can be obtained that the S-WFDTW algorithm outperforms the traditional DTW algorithm in terms of action alignment accuracy and matching time, especially in terms of computation time.The average performance enhancement effect of the S-WFDTW algorithm is 34.72%. This performance improvement makes S-WFDTW more advantageous in application scenarios that require efficient and accurate action matching.
System performance
In order to verify the real-time and accuracy of the system, this study constructed a comparative experimental framework based on the combination of multiple algorithms. The experiment uses Intel(R)Core(TM) i9-13900HX 2.20 GHz platform, the dataset covers three types of fitness movements (40 video samples for each type), squats, push-ups, and pull-ups, and divides the training set and the test set by 70%−30% ratio, and all the data are pre-processed by PCA dimensionality reduction and normalization. The four groups of typical algorithm combinations (shown in Table 2) are systematically evaluated by three dimensions: accuracy, average processing time and memory consumption, and the performance of each method is further analyzed in key aspects such as pose recognition, movement classification and time series alignment, as shown in Table 3.
As seen in Tables 2 and 3, compared to other combinations, BlazePose + KNN + S-WFDTW has the shortest combined processing time and the best overall performance. Especially in application scenarios with high real-time requirements, the total processing time of this combination is only 0.29 s, which is significantly better than other methods (e.g., OpenPose + KNN + DTW, with a processing time of 0.60 s.) The combination of BlazePose and S-WFDTW is able to ensure real-time performance while providing more accurate action recognition and alignment effects.
Movement assessment
In this paper, experiments containing movement trajectories and joint angles are designed to evaluate the system’s movement assessment function and to verify the stability and accuracy of the system’s assessment.
Comparison of movement trajectories
To validate the system’s capabilities in real – time evaluation and visualization feedback, a detailed verification of the movement trajectory was conducted. By comparing the actual movement trajectories of testers with those of standard movements, the synergy, stability, overall amplitude, and cycle pattern of joints during movements were precisely captured. This enabled a comprehensive assessment of movement smoothness and efficiency. Standard movement trajectories typically exhibit a high level of stability and coordination, whereas non – standard movements may display improper postures, technical flaws, or uneven loading. Comparative analysis can effectively pinpoint these deviations and offer users timely corrective suggestions. Figure 11 depicts the real – time X – and Y – axis motion trajectories of key joint points during the push – up movement. These trajectories clearly illustrate the periodicity, stability, and coordination of the overall movement, providing a framework for subsequent in – depth analysis.
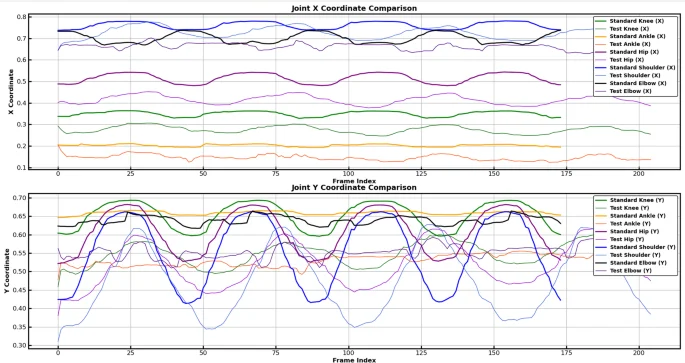
Comparison of joint motion trajectories.
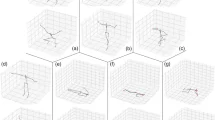
Figure 11 clearly depicts the joint movement trajectories, cyclic fluctuations, stability, and coordination within the overall movement. This visualization offers valuable data for a more in – depth analysis of specific movements. As presented in Table 4 and Fig. 12, the system zeroes in on detecting deviations in specific movements. Through trajectory comparisons, it pinpoints particular issues, enabling users to identify irregularities in their movements. For instance, during push – up exercises, a downward deviation in the X – axis trajectory of the elbow joint might stem from elbow valgus. This condition increases the stress on the shoulder and elbow, thereby heightening the risk of injury27. Hence, users should be mindful of their hand placement, avoid excessive arm – width, and maintain a stable posture. Moreover, Fig. 12 reveals that the Y – axis fluctuations of the user’s joints are minimal. This could be attributed to insufficient core and lower – limb control, resulting in an inadequate lowering of the chest and a limited range of motion in the shoulder, elbow, and hip joints. To address this, it is advisable to strengthen core and lower – limb stability training in subsequent workouts and strive to control the movement depth. To conduct a more comprehensive assessment of movement quality, the system incorporates 3D visualization analysis. As shown in Fig. 13, this analysis presents the 3D skeletal dynamics of the deep – squat movement. Users can observe movement details from multiple perspectives via this dynamic 3D view, ensuring movement standardization and accuracy. This, in turn, provides a foundation for subsequent technical adjustments and enhancements.
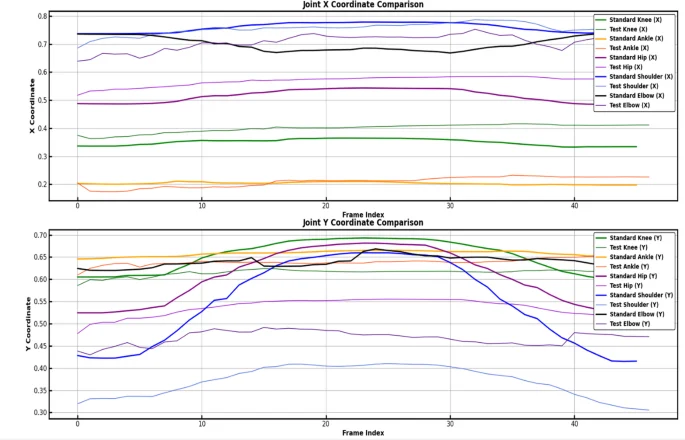
Individual push-up movement trajectory.
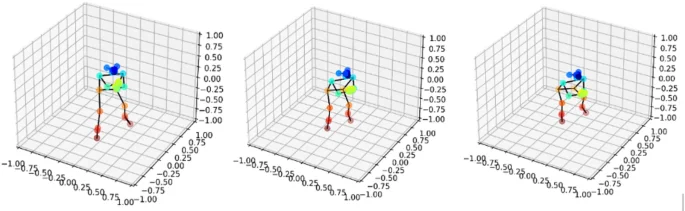
Deep Squat 3 d Coordinate Chart.
b.Angle analysis
To conduct a more in – depth analysis of users’ exercise performance, the system carried out a meticulous examination of joint angles. These angles were employed to quantitatively evaluate users’ fitness movements. Table 5 presents the specific discrepancies between the tester’s and the standard deep-squat movements. Through comparative analysis, the system can offer a theoretical framework for users to improve their subsequent movements and further optimize exercise outcomes. The data in Table 5 indicate significant angle deviations in the users’ knee and ankle joints. Such deviations may result in excessive joint pressure or unstable locomotion. Particularly in weight -bearing exercises like deep squats, joint-angle deviations directly influence overall exercise performance and heighten the risk of injury. Deviations in elbow and back angles also merit attention. Overly flexed elbow angles augment the load on upper-extremity joints, whereas insufficiently flexed back angles can cause spinal instability. Hip-angle deviations suggest limited lower- extremity range of motion, leading to incomplete movement execution and potentially undermining exercise performance.
System stability
The system’s scoring system was validated for consistency and stability by analyzing tester scoring data in combination with statistical parameters such as the mean and variance. The consistency and fluctuation of scores were primarily evaluated by calculating the mean and variance of testers’ scores. Table 6 presents the scoring data of six testers and their corresponding statistical results. As shown in Table 6, the testers were ranked 5, 4, 2, 6, 3, and 1 in descending order based on the degree of movement standardization, which aligns with the actual movement standards. The minimal changes in the mean and small variance of the scores in the table indicate that the system exhibits high stability and consistency during the assessment process, thus validating the scientificity and feasibility of the assessment method.
Counting accuracy
In order to validate the performance of the system in real-time evaluation, this design provides an experimental evaluation of the real-time detection and counting function of push-up movements. The confidence level of the counting system is set to 60, and the system records an action count when the similarity exceeds this threshold. Table 7 shows the results of the experimental tests. According to the data in the table, the difference between the similarity (Q1 in %) calculated from the full action video and the average similarity (Q2 in %) calculated from every 5 frames by the real-time detection system is small, and the final counting results are consistent.
The experimental results show that the real-time detection performance of the system is stable and can accurately capture the details of the movements. Meanwhile, the real-time counting function of the system performs well, and the average accuracy of real-time counting reaches 98.33% after several tests. This result proves the efficiency and stability of the system in practical application, which is able to accurately count and evaluate the push-up movement of each tester. Overall, the system demonstrated excellent performance and reliability in the field of fitness monitoring and motion analysis.
Conclusion
In this paper, we propose a real-time fitness action evaluation system based on computer vision and machine learning techniques, and its core innovation lies in the realization of efficient action recognition and accurate evaluation by means of a lightweight pose estimation model (BlazePose) and an improved dynamic time regularization algorithm (S-WFDTW). Compared with the traditional scheme, the system makes a significant breakthrough in computational efficiency: the frame processing speed of BlazePose reaches 13.3 times that of OpenPose, and combined with the window limitation and pruning strategy of S-WFDTW, the total processing time is reduced to 0.29 s, which meets the real-time feedback demand. Through PCA dimensionality reduction and KNN classification algorithm, the system can achieve 98.33% recognition accuracy for squats, push-ups and pull-ups, and generate personalized improvement suggestions based on weighted joint angle and trajectory similarity analysis (S-WFDTW algorithm) to effectively reduce the risk of sports injury. Experiments show that the system is 34.72% more efficient than the traditional DTW algorithm in real-time counting and scoring, which validates its potential application in home fitness monitoring and personalized guidance.
While the system excels in real-time performance and lightweight design, it has some limitations.The joint detection accuracy of BlazePose (PCK = 0.72) is lower than that of OpenPose (PCK = 0.81), which may affect the reliability of the evaluation of complex movements.S-WFDTW performs well in short-time sequences, but in long-time sequential movements, due to the window limitation, it may lead to cumulative errors. Current tests have only focused on mixed-light scenarios and have not yet verified robustness in extreme light or dynamic backgrounds, so data augmentation with multimodal sensor fusion needs to be introduced to improve adaptability. The available test data covers only six testers and a limited number of action types, which may affect the model’s ability to generalize to diverse body types and action variants.
Future work will focus on the following directions:
-
1.
Algorithm enhancement: design an adaptive window mechanism to dynamically adjust the window size of S-WFDTW to adapt to different time-length action sequences, and then introduce a multimodal alignment strategy based on the ALBEF framework, and fuse the inertial sensor data to enhance the evaluation dimension.
-
2.
Application extension: develop the occlusion processing algorithm in multi-person fitness scenarios to support group training guidance; and construct open-source community datasets to promote algorithm standardization and cross-platform compatibility.
Data availability
All data generated or analyzed during the current study are included in this published article. The datasets used and/or analyzed during the current study are available from the corresponding authors upon reasonable request.
References
-
Yanling, R. Research on Human Activity Recognition and Fall Detection Based on Flexible Wearable Sensors (Hangzhou University of Electronic Science and Technology, 2024).
-
Wang, X. Design of human action node recognition system based on human body. Inform. Technol. Informatization, (08):84–86. (2021).
-
Wang, J. Research on wearable swimming posture capture and phase segmentation algorithm. Dalian University of Technology, (2021). https://doi.org/10.26991/d.cnki.gdllu.2021.003901
-
Huang, H. X., Wang, Y. Y. & Tsai, M. Q. A bottleneck layer multiscale graph convolutional action recognition method based on skeleton features. Comput. Sci. 51 (S2), 354–358 (2024).
-
Yang, G. Automatic identification method of athletes’ training error movement images based on 3D image visual features. Autom. Instrum. (08), 117–120. https://doi.org/10.14016/j.cnki.1001-9227.2024.08.117 (2024).
-
Zhang, N. Research on multi-feature recognition algorithm for motion action based on machine vision. Autom. Instrum. (03), 82–86. https://doi.org/10.14016/j.cnki.1001-9227.2024.03.082 (2024).
-
Chang, K., Chen, M. Y. & Canny, J. Tracking free weight exercises//UbiComp 2007: Ubiquitous Computing: 9th International Conference, UbiComp2007, Innsbruck, Austria, September 16–19, 2007. Proceedings 9. Springer Berlin Heidelberg, 19–37 (2007).
-
Liu Yutao. Research on human motion capture and recognition based on wearable sensors. Harbin Inst. Technol. https://doi.org/10.27061/d.cnki.ghgdu.2020.001440 (2020).
Google Scholar
-
Skawinski, K., Roca, F. M., Findling, R. D. & Sigg, S. Workout type recognition and repetition counting with CNNs from 3D acceleration sensed on the chest. In Advances in Computational Intelligence; (eds Rojas, I., Joya, G. & Catala, A.) Springer: Berlin/Heidelberg, Germany, pp. 347–359. (2019).
Google Scholar
-
Hu, X. et al. Design and realization of the badminton technical movement correction analysis system based on Kinect//Sports Information Branch of the Chinese Society of Sports Science.2022 Compendium of Abstracts of the 14th National Academic Conference on Sports Information Science and Technology. Key Laboratory of Sports Intelligence, Hunan Normal University, 2. (2022). https://doi.org/10.26914/c.cnkihy.2022.046697
-
Long, J-H. Design and realization of push-up movement evaluation system based on kinect. Jianghan Xue. https://doi.org/10.27800/d.cnki.gjhdx.2023.000183 (2023).
Google Scholar
-
Huang, L-S., Zhang, F. & Lu, J-W. Table tennis swing motion recognition based on openpose. J. Taiyuan City Vocat. Tech. Coll. (09), 24–26. https://doi.org/10.16227/j.cnki.tycs.2024.0501 (2024).
-
Liu, G., Zhang, X. & Hou, E. Research on sit-up posture Estimation based on Fast-OpenPose. Foreign Electron. Meas. Technol. 43 (07), 112–121. https://doi.org/10.19652/j.cnki.femt.2405988 (2024).
Google Scholar
-
Mei, J., Sun, J. & Zou, Q. Research on the scoring method of skiing movement based on human key point. J. Jilin Univ. (Information Sci. Edition). 42 (05), 866–873. https://doi.org/10.19292/j.cnki.jdxxp.20240606.002 (2024).
Google Scholar
-
Caixia, M. et al. OpenPose human fall detection algorithm incorporating attention mechanism. J. Comput. Aided Des. Graph., 1–12. http://kns.cnki.net/kcms/detail/11.2925.TP.20240204.1112.014.html (2024).
-
Mei, J., Sun, J. Y. & Zou, Q. Research on the scoring method of skiing movement based on human key points. J. Jilin Univ. (Information Sci. Edition). 42 (05), 866–873. https://doi.org/10.19292/j.cnki.jdxxp.20240606.002 (2024).
Google Scholar
-
Xia-Ling, W. Research and application of fitness movement evaluation based on posture Estimation. Changjiang Univ. https://doi.org/10.26981/d.cnki.gjhsc.2023.000161 (2023).
Google Scholar
-
Wu, S., Xu, R. & Kong, M. Sports evaluation system based on blazepose and depth camera. Comput. Digit. Eng. 52 (08), 2306–2311 (2024).
-
Kong, D. Z. Research on the application of human movement recognition model based on MediaPipe framework in Y balance test. Chengdu Inst. Phys. Educ. https://doi.org/10.26987/d.cnki.gcdtc.2023.000330 (2023).
Google Scholar
-
Zaorong, H. et al. Abnormal gait detection based on blazepose and random forest algorithm. Comput. Technol. Autom. 43 (02), 62–69. https://doi.org/10.16339/j.cnki.jsjsyzdh.202402011 (2024).
Google Scholar
-
Zhongshan, H. Human movement similarity assessment based on posture Estimation and its application in sports training. Univ. Electron. Sci. Technol. https://doi.org/10.27005/d.cnki.gdzku.2023.002971 (2023).
Google Scholar
-
Gu, J., Xu, J. & Liu, H. An improved DTW algorithm for human behavior recognition. J. Hebei Univ. Technol. 47 (04), 17–20. https://doi.org/10.14081/j.cnki.hgdxb.2018.04.004 (2018).
Google Scholar
-
Hao, S. et al. A multimodal imitation learning method based on cosine similarity. Comput. Res. Dev. 60 (06), 1358–1372 (2023).
-
Jing, S. & Hong, J. Research on wrist movement recognition of surface EMG signals based on PCA and ELM. J. Chongqing Univ. Technol. (Natural Science). 33 (12), 96–100 (2019).
-
Xia, P. & Wang, S. Research on movement evaluation algorithm based on openpose and machine learning – An example of over-the-top deep squat movement// Chinese Society of Sports Science. Compilation of Abstracts of the Twelfth National Conference on Sports Science – Special Presentation (Sports Engineering Division). Beijing Sport University; :2. (2022). https://doi.org/10.26914/c.cnkihy.2022.004441
-
Yang, L. & Zong, Z. Research on human joint recognition of tennis serve based on blazepose. Industrial Control Comput. 36 (11), 115–117 (2023).
-
Kothurkar, R. & Lekurwale, R. Techniques to determine knee joint contact forces during squatting: A systematic review. Proc. Institution Mech. Eng. Part. H: J. Eng. Med. 236 (6), 775–784 (2022).
Google Scholar
Author information
Authors and Affiliations
Contributions
T.G. and Q.Y. wrote the main manuscript text, X.L. and Y.S. prepared Figs. 1, 2 and 3 and Z.Q. and Y.H. participated in the data analysis, and G.L. provided study design and guidance. All authors reviewed the manuscript.
Corresponding author
Ethics declarations
Competing interests
The authors declare no competing interests.
Ethical approval
The human movement assessment experiment involved in this study was reviewed and approved by the Medical Ethics Committee of Tianjin Vocational and Technical Normal University.
Informed consent
Written informed consent was obtained from all participants and their legal guardians before the start of the study. The consent clearly stated the purpose of the study, procedures, potential risks and scope of data use, and participants had the right to withdraw from the experiment at any time and without conditions.All subjects and/or their legal guardians gave informed consent for the release of identifying information/images in online open access publications.
Methodological compliance
All experimental methods and processes in this study strictly complied with the Relevant Ethical Guidelines and were in compliance with the laws and regulations on human subjects research in the region of China where they were conducted. The study design adequately safeguarded the participants’ right to privacy, information and health and safety.
Additional information
Publisher’s note
Springer Nature remains neutral with regard to jurisdictional claims in published maps and institutional affiliations.
Rights and permissions
Open Access This article is licensed under a Creative Commons Attribution-NonCommercial-NoDerivatives 4.0 International License, which permits any non-commercial use, sharing, distribution and reproduction in any medium or format, as long as you give appropriate credit to the original author(s) and the source, provide a link to the Creative Commons licence, and indicate if you modified the licensed material. You do not have permission under this licence to share adapted material derived from this article or parts of it. The images or other third party material in this article are included in the article’s Creative Commons licence, unless indicated otherwise in a credit line to the material. If material is not included in the article’s Creative Commons licence and your intended use is not permitted by statutory regulation or exceeds the permitted use, you will need to obtain permission directly from the copyright holder. To view a copy of this licence, visit http://creativecommons.org/licenses/by-nc-nd/4.0/.
Reprints and permissions
About this article
Cite this article
Guo, T., Yin, Q., Liu, X. et al. Fitness exercise evaluation system based on improved DTW algorithm.
Sci Rep 15, 19961 (2025). https://doi.org/10.1038/s41598-025-02535-5
-
Received: 22 February 2025
-
Accepted: 14 May 2025
-
Published: 06 June 2025
-
DOI: https://doi.org/10.1038/s41598-025-02535-5
Keywords
- Motion recognition
- Machine vision techniques
- S-WFDTW algorithm
- Motion performance evaluation