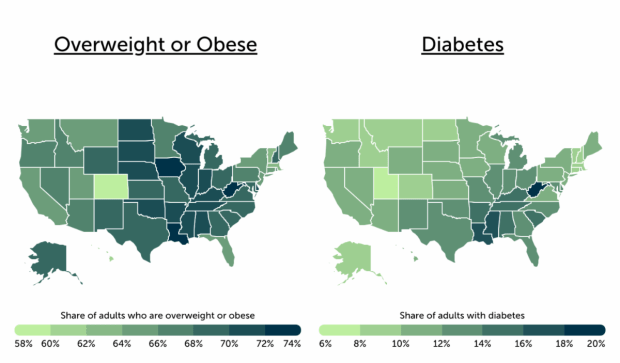
Obesity rates have tripled since the 1960s in the U.S., according to a report from Trace One, with over 40% of adults classified as obese.
Diabetes has surged from less than 3% of the adult population in 1980 to more than 11% today.
Diets play a key factor in these numbers, but how does Connecticut perform compared to other states across the nation?

Trace One
Obesity rates have tripled since the 1960s in the U.S., according to a report from Trace One, with over 40% of adults classified as obese. Diabetes has surged from less than 3% of the adult population in 1980 to more than 11% today. (Courtesy: Trace One)
According to Trace One, when factoring in eating habits, food insecurity rates, alcohol consumption, and the prevalence of diet-related health conditions, the Nutmeg state ranks 15th overall in healthiest diets, with a Healthy Diet Index of 61.4.
Curious how that total is calculated? Here is Connecticut’s full list of percentages, as well as how they compare to national averages, according to Trace One:
Connecticut:
- Healthy Diet Index: 61.4
- Consume fruits daily: 64.6%
- Consume vegetables daily: 80.0%
- Drink alcohol moderately or don’t drink: 94.1%
- Drink sugar-sweetened beverages daily: 72.2%
- Food insecurity: 10.4%
- Overweight or obesity prevalence: 65.9%
- Diabetes prevalence: 9.9%
- High cholesterol prevalence: 38.6%
- High blood pressure prevalence: 32.0%
- Coronary heart disease or heart attack prevalence: 5.9%
National Average:
- Healthy Diet Index: N/A
- Consume fruits daily: 59.2%
- Consume vegetables daily: 80.3%
- Drink alcohol moderately or don’t drink: 93.9%
- Drink sugar-sweetened beverages daily: 63.0%
- Food insecurity: 12.2%
- Overweight or obesity prevalence: 68.7%
- Diabetes prevalence: 11.5%
- High cholesterol prevalence: 36.9%
- High blood pressure prevalence: 34.0%
- Coronary heart disease or heart attack prevalence: 6.3%

Trace One
Food Insecurity and Its Impact on Diet. (Courtesy: Trace One)
While Connecticut performs better in every statistic, it is not by much for most numbers. The state’s biggest boon is in the amount sugar-sweetened beverages consumed daily, with a 9.8% difference over the national average. Many other stats are only better than the average by a couple or few percentage points, with a few even under a percent, according to Trace One.
In CT town, major redevelopment and fresh construction underway
Connecticut falls behind top performers like Utah and Colorado, with Healthy Diet Index scores above 80. The Nutmeg state falls behind other New England states, too: Vermont, Massachusetts, and New Hampshire all crack the top ten with 75, 74 and 66.6, respectively.
How about the worst-performing states? Louisiana takes the top spot with a staggeringly low 8.4 Healthy Diet Index score. Second-worst is Arkansas with 17, followed by Mississippi in third with 17.2.
Check out the full chart below on the top and bottom 10 states based on Healthy Diet Index scores, according to Trace One:

Trace One
The top and bottom ten states based on Healthy Diet Index scores, according to Trace One.
Trace One had other key takeaways in their report. Perhaps the most shocking is how much obesity costs the U.S. healthcare system each year: $173 billion. Trace one goes on to say that “Diabetes, heart disease, and stroke cost $835 billion in medical costs and lost productivity.”
The U.S. also pays the most for its health care internationally at $12,555 per capita, but ranks 34th in life expectancy worldwide, according to a report.
Nine of the 10 most unhealthy states are all in the South, according to Trace One: “These areas often have high rates of food insecurity, leading many families to turn to cheaper, calorie-dense options due to a lack of access to nutritious (and affordable) food.”
Lastly, states with less food insecurity fare better. Western states, especially in the Mountain West, tend to report healthful diets, lower rates of diet-related conditions, and below-average food insecurity rates.
Check out the full report by Trace One here.
Originally Published: February 1, 2025 at 6:00 AM EST