Abstract
Switching to alternative global diets offers established benefits, but the challenges and opportunities for individual countries during and after the transition remain unassessed. In this study, we project changes in water use, dietary quality, and food affordability under four dietary scenarios (including Mediterranean diet, the EAT-Lancet diet, the Healthy US-Style diet, and Vegetarian diet), assessing the potential implications at the country level from 2020 to 2070. Here, we show that by 2070, transitioning to healthy and sustainable diets can improve dietary quality by 30.29 – 45.43%, with all countries reducing water use (1.21 – 14.73%) and increasing food affordability (9.29 – 63.23%). However, in the initial phases, increased food demand escalated water use and worsened food affordability, especially in emerging and developing economies, with the maximum average deterioration being 2.62% and 13.06%, respectively. These highlight the need for long-term planning and financial support to ensure successful global transitions.
Mexican national dietary guidelines promote less costly and environmentally sustainable diets
Global food systems transitions have enabled affordable diets but had less favourable outcomes for nutrition, environmental health, inclusion and equity
Equity as a priority in EAT–Lancet-aligned food system transformations
Introduction
Dietary preferences greatly influence the sustainability of the global food system1,2,3,4. As income levels increase2, so does the demand for high-calorie, sugar, and animal-sourced food5,6, a shift with complex repercussions4,7. The primary environmental alarm centers on the sizable resources required and the emissions from producing these foods, particularly animal-sourced food. They not only amplify the release of greenhouse gases (GHG) emissions8 but also exert an undue strain on water use9. Globally, the food system is the largest freshwater consumer, accounting for ~ 85–90% of water use10,11. The ongoing shift towards resource-intensive food choices exacerbates the risk of water scarcity and substantial transgression of the freshwater boundary12. This, combined with escalating demand and the impact of climate change, underscores the growing importance of understanding the impact of diet on water stress11,12. Health-wise, the overconsumption of these foods is linked to increasing instances of malnutrition, encompassing both undernutrition and overnutrition, cardiovascular disorders, diabetes, and other chronic ailments13,14. Studies have shown that the adoption of healthier diets involving a reduction in animal-sourced food consumption15 can lead to a reduction in diet-related environmental15,16,17,18 and health issues17,19,20. However, given the existing disparities among diet-related diseases, understanding how the adoption of such diets would impact the dietary quality21 of diverse communities across different geographic areas becomes absolutely crucial. More importantly, the task ahead is daunting, particularly for resource-scarce settings and economically less privileged populations. The pursuit of healthy and sustainable diets in emerging and developing economies [as defined by the International Monetary Fund22], especially within Africa, implies a considerable escalation in food consumption23. Such a shift, though vital, could precipitate a significant drop in affordability24, thereby forming significant impediments to dietary transitions in these emerging and developing economies.
Existing studies had delved into the effects of dietary shifts on environmental sustainability, health, and food affordability, yielding a wealth of valuable insights. These findings demonstrated the potential of such transitions to alleviate environmental burdens25 and enhance health outcomes17. However, research also indicated a looming challenge: over 1.6 billion people could face increased food costs as a result of adopting these sustainable diets24,26,27. Some recent research has delved deeper into the intricate interplay between dietary shifts and supply-demand dynamics, shedding light on the multifaceted consequences of these transitions for environmental sustainability, health outcomes, and food security amidst fluctuating market conditions28,29. While previous research predominantly emphasized promising endpoint outcomes through static snapshots, leaving the dynamic changes over time unclear. This analytical perspective proved inadequate for addressing the evolving processes involved, particularly failed to account for the escalating environmental and economic challenges that some countries encountered. Consequently, this limited perspective obscured critical insights into the ongoing complexities of these transitions28. Moreover, such studies often concealed the long-term benefits that emerged post-transition, thereby hindering the development of robust incentives for transforming food systems.
In this work, we use the Model of Agricultural Production and its Impacts on the Environment (MAgPIE) (version 4.6.3)30 to assess dynamic changes in water use, dietary quality, and food affordability spanning from 2020 to 2070 (see “Method”). Based on the quantification, we explore the potential integrated benefits of adopting four healthy and sustainable diets (including Mediterranean dietary (MED)31, the EAT-Lancet reference diet (EAT)7, the Healthy US-Style (HUS)32, and a vegetarian scenario (VEG) (see Method and Supplementary Table 1) at the country level over time relative to a baseline diet (BaU) scenario. These results provide further insight into the environmental and economic challenges that different countries may face in the dietary transition process, as well as the enduring benefits that accrue upon the completion of this transformation. We highlight that while dietary transition can reduce water use and improve dietary quality and food affordability globally, emerging and developing economies must prepare for the potential escalation in water use and economic burden, necessitating thoughtful reflection in their decision-making as well as international governance and support. This knowledge can assist countries in actively promoting a dietary transition and working towards achieving sustainable development of agricultural systems.
Results
Dietary quality of different diet scenarios
We utilized the widely recognized Alternative Healthy Eating Index (AHEI)33 as a metric to assess dietary quality, specifically designed for exploring the relationship between diet and health34 (see “Method”). Amid sustained economic growth, the anticipated surge in meat and sugar consumption in future diets was projected to result in persistent global declines in dietary quality.
In the BaU scenario, global dietary quality was projected to decrease from 52.34 points in 2020 to 51.57 points in 2070 (Fig. 1a). By 2070, the projected AHEI was expected to gradually fall below the values observed during the historical period of 2010–2020. This declining trend was evident in 107 countries, where the rise in meat and sugar (− 1.30 points), coupled with reduced grains intake (−1.87 points), offset the positive impacts of vegetables (+ 0.24 points), fruits (+ 0.32 points), seafood (+ 1.01 points), and polyunsaturated fatty acids (PUFAs) (+ 0.79). Consequently, the overall AHEI score for these countries was expected to have decreased by 2.20 ± 2.05 points (Fig. 1b, c). This phenomenon was particularly noticeable in emerging and developing economies, especially Africa (− 2.64 ± 1.95 points), Latin America (− 3.14 ± 2.25 points), and Asia (− 3.78 ± 3.27 points). Following economic growth, a shift in these countries towards high-sugar and animal-sourced food occurred, reducing their dietary quality.
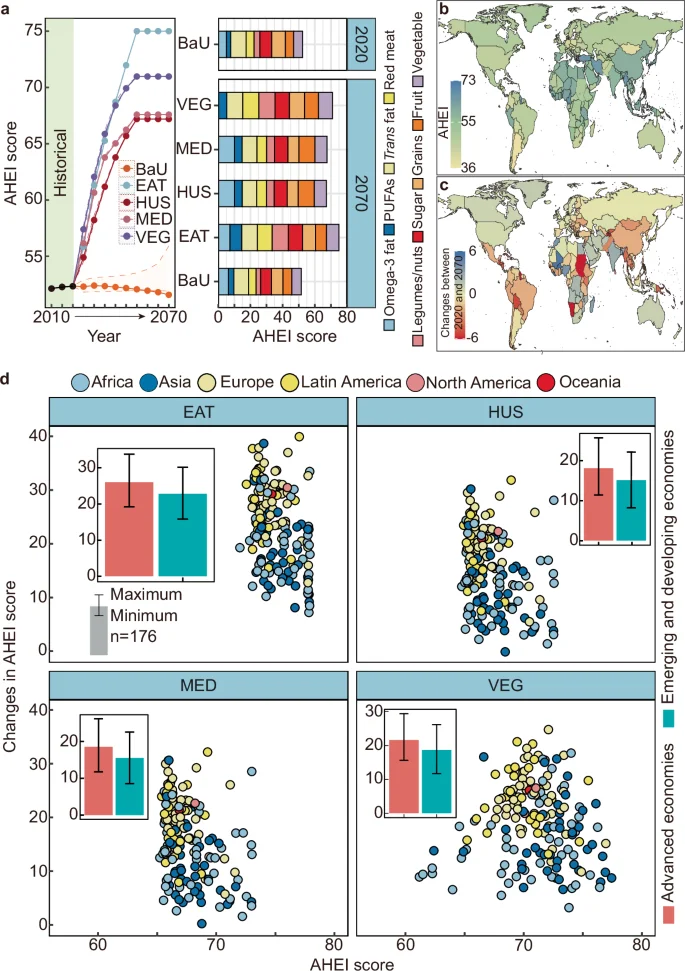
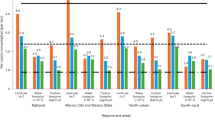
a The AHEI scores over time under different dietary scenarios (including Mediterranean dietary (MED), the EAT-Lancet reference diet (EAT), the Healthy US-Style (HUS), vegetarian scenario (VEG) and baseline diet (BaU)) and the composition of AHEI score under different dietary scenarios in 2020 and 2070 (Solid lines represent scenarios in an SSP2. The transparent area shows the range between SSP1 and SSP3). b AHEI score for 2020 in different countries. c Change in 2070 under BaU scenarios of each country. d AHEI score and difference with BaU in 2070 under four diets across 176 countries classified into six regions. Note: Food intake data and dietary quality scores (AHEI) for different countries are obtained through the MAgPIE model and combined with dietary composition provided by FAO. For the specific calculation process, please refer to the data processing code in https://doi.org/10.6084/m9.figshare.23905866. Source data are provided as a Source Data file.
In contrast, all four healthy and sustainable diets demonstrated varying degrees of improvement in dietary quality by restricting high-calorie, sugary, and animal-sourced food. The HUS diet exhibited the least improvement, increasing from 52.34 points in 2020 to 67.19 points in 2050 (Fig. 1a). The MED diet, with lower sugar and oil consumption, yielded an additional 0.39-point improvement compared to the HUS diet. The EAT diet further reduced the dairy products, sugars, and meat while increasing legumes/nuts and grains, resulting in a total score of 75.00 in 2070. In addition, the VEG scenario replaced all meat with legumes/nuts, displaying further improvements in red meat and slightly higher scores for trans fats. However, the lack of seafood/fish consumption results in a lower score of 70.97 in 2070.
Although dietary transitions had the potential to enhance dietary quality in all countries, the impact was particularly pronounced in advanced economies [as defined by the International Monetary Fund22], where high levels of sugar and animal-sourced food were already being consumed (Fig. 1d). Shifting towards a more balanced diet in advanced economies involved curtailing meat and sugar intake, resulting to a notable increase in AHEI scores (18.04–25.98 points). Conversely, emerging and developing economies experienced more modest improvements in AHEI scores (15.02–22.79 points) due to increased meat and sugar consumption along with a decreased proportion of grains in their diets. Overall, countries such as Hungary (29.51 to 37.71 points), Bolivia (31.85–39.93 points), and Argentina (30.14–37.71 points) showed the greatest improvement in dietary quality among the four scenarios. This improvement was largely due to the effect of food subcategories on PUFAs and trans-fat, indicating that reducing certain food categories and including healthier alternatives could significantly improve the nutritional profile of diets in these countries.
Changes in water use due to dietary transitions
To assess the environmental impact, we examined the influence of various dietary transitions on global water use from 2020 to 2070. In the BaU scenario, water use was projected to rise from 4448.08 km3 in 2020 to 4998.33 km3 by 2070 (Fig. 2a) driven by escalating food demand (Supplementary Fig. 1). By 2070, water use exceeded 2020 levels in 118 countries (Fig. 2b), notably increasing in Brazil, Argentina, Niger, Nigeria, and Uruguay (Supplementary Fig. 2). Argentina experienced the most significant rise (128.88 km3), while 58 countries were projected to use less water due to improved irrigation efficiency (Supplementary Fig. 3) and declining populations (Supplementary Fig. 4), with India experiencing the largest reduction (208.63 km3).
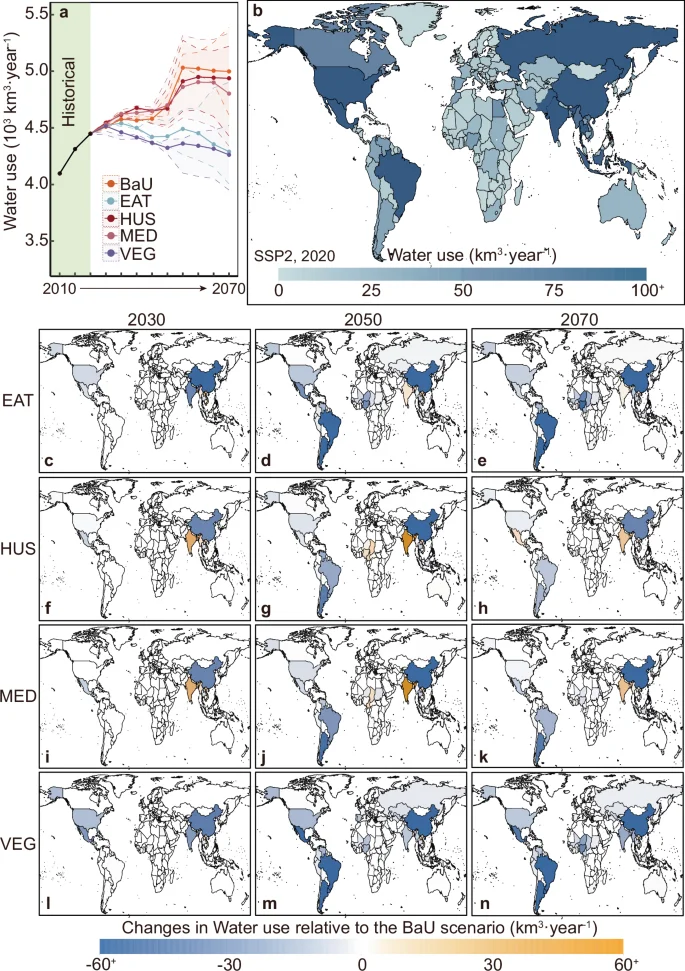
a shows the water use at the global scale from 2020 to 2070, Solid lines represent scenarios in an SSP2. The transparent area shows the range between SSP1 and SSP3; (b) shows water use at the country level in 2020; (c–n) show the spatial distribution of changes relative to BaU (baseline diet) for different diets (including Mediterranean dietary (MED), the EAT-Lancet reference diet (EAT), the Healthy US-Style (HUS), vegetarian scenario (VEG)) in 2030, 2050 and 2070. Note: water use in different countries can be obtained directly through the MAgPIE model. For the specific calculation process, please refer to the data processing code in https://doi.org/10.6084/m9.figshare.23905866. Source data are provided as a Source Data file.
In dietary transition scenarios, lower demand for animal-sourced food (Supplementary Figs. 5–8) and food waste (Supplementary Fig. 9) led to a projected reduction in water use to a range of 4262.06-4937.68 km3 by 2070. The VEG and EAT diets emphasize plant-based diets (Supplementary Table 1), which can reduce water-intensive foods9 such as meat and sugar, while reducing feed and crop requirements. making them more effective in reducing water use (736.27 and 708.65 km3), while the MED and HUS diets (195.86 and 60.65 km3) were less effective. Some African and Asian countries, already below recommended intake levels (Supplementary Fig. 9), encountered heightened water challenges during the initial phases due to rising food demand (Fig. 2c–n). For instance, in the EAT diet, water use in 43 countries surpassed that in the BaU scenario by 2030, with 69.8% being African and Asian countries. Vietnam experienced the most substantial increase (37.56 km3) due to elevated consumption of grains and fruits. While water use gradually decreased with the dietary transition over time, it consistently remained higher than the BaU scenario.
In the HUS and MED diets, more countries (69 and 79, respectively) experienced increased water use compared to the EAT scenarios in 2030. The higher consumption of water-intensive foods such as meat and sugar contributed to this trend. Consequently, approximately 39–45% of countries faced more severe water use challenges. In contrast, the VEG scenarios substantially reduced water use by reducing meat consumption and associated feed and crop requirements. This transition to a plant-based diet greatly conserved water resources. However, increased consumption of food like legumes/nuts17 in certain emerging and developing economies may still pose water use challenges. Notably, even under the VEG diet with the lowest water use in the SSP2 scenario, water use remained above the 2010 historical level, a reduction achievable only in the SSP1 scenario.
Share of food expenditure
As economies developed, the food expenditures as a share of total income was expected to continue to decline, signaling an enhancement in global food affordability and positive prospects for food security worldwide (Fig. 3a). However, for a deeper understanding of the dynamics associated with changes in food affordability, focusing on food demand, prices, and incomes was crucial. In the BaU scenario, projections indicated persistent increases in food demand (Supplementary Fig. 1) and prices (Supplementary Fig. 10) by 10.67% and 14.17%, respectively. This led to an overall 26.36% increase in food expenditures, notably driven by a substantial rise in spending on animal-sourced food, expected to increase by 43.75% by 2070 (Fig. 3b). Yet, due to increased income, affordability was anticipated to improve by 49.92%, with the share decreasing from 3.19% to 1.60% (Fig. 3a), which was more significant than the historical period. In the HUS and MED diets, despite a general decrease in overall demand, food expenditures were expected to increase by 7.13% and 14.61%, respectively. This upward trend was linked to an elevated demand for animal-sourced food, sugar/oil, and fruits/vegetables (with corresponding food price increases anticipated at 5.52% and 12.92%). In contrast, the EAT and VEG diets displayed the opposite effect, with dietary changes resulting in a substantial reduction in demand for animal-sourced food. Consequently, food expenditures were expected to decrease by − 24.51% and − 53.54%, respectively, leading to a significant improvement in food affordability by 70.08% and 81.58%.
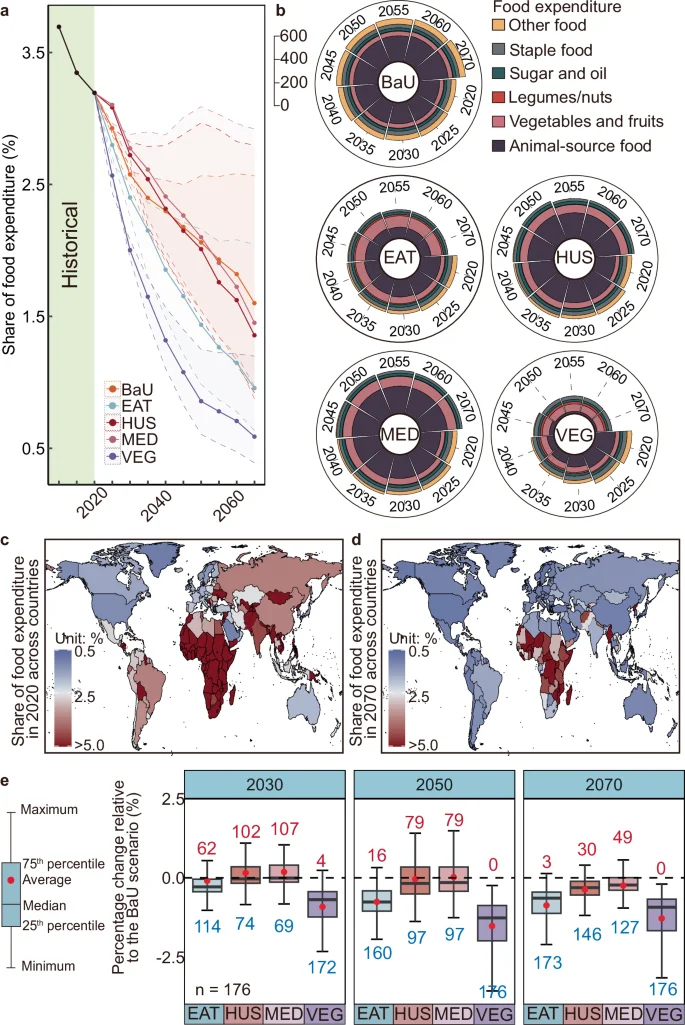
a share of food expenditure in different dietary scenarios at the global level over time (Solid lines represent scenarios in an SSP2. The transparent area shows the range between SSP1 and SSP3 scenario); (b) expenditures by food category in different diets (Unit: USD per capita); (c, d) share of food expenditure in different countries in 2020 and 2100 under the BaU scenario; (e) percent change relative to BaU; red number indicate the amount by which the country’s burden increased; blue number indicates the opposite; Note: income and food expenditure data in different countries can be obtained directly through the MAgPIE model. For the specific calculation process, please refer to the data processing code in https://doi.org/10.6084/m9.figshare.23905866. Source data are provided as a Source Data file.
Despite significant strides in global food affordability, disparities persist among countries, spanning from 0.39% to 90.44%, driven by variations in economic development (Fig. 3c). In 2020, Africa and Asia faced challenges in food affordability, with the 20 countries experiencing the poorest affordability mainly being African nations, averaging a food expenditure share of 33.48%. The Central African Republic had the highest share at 90.44%. In contrast, advanced economies like the US and Europe had minimal affordability issues, with food expenditure shares at 1.22% and 2.16%, respectively. With sustained economic development, there was a substantial global improvement in food affordability. It was projected that the share of food expenditures among different countries worldwide would range from 0.38% to 12.35% by 2070. Africa and Asia were expected to experience significant improvements in food affordability, decreasing to 4.47% in Africa and 2.16% in Asia (Fig. 3d). Notably, the Central African Republic, burdened heavily in 2020, also benefited from economic growth, witnessed a decrease in its food expenditure share from 90.44% to 9.46%.
During the dietary transition, certain countries, particularly those already facing poverty and economic challenges, encountered increased pressure on food affordability. For example, in 2030, during the transition to the EAT, HUS, MED, and VEG diets, 62, 102, 107, and 4 countries, respectively, were projected to face increased food affordability pressure (Fig. 3e), mainly in Africa and Asia. However, this pressure gradually diminished as dietary transitions completed. By 2070, in the MED diet, only 49 countries experienced a higher share of food expenditure due to increased dietary demand, ranging from 6.32% to 48.31%, with Iraq being the highest.
Environment-health-affordability trade-offs and synergies
Finally, we explored the synergies and trade-offs associated with diverse dietary transitions. The findings suggest significant improvements in global dietary quality over time. However, these positive changes are accompanied by trade-offs in food affordability and water use, particularly in emerging and developing economies (Fig. 4). Notably, the HUS and MED diets (Fig. 4b, c) faced more prominent challenges among the diets studied. In the initial stages of the dietary transition, both the HUS and MED diets encountered trade-offs between water use and food affordability, placing them in quadrant III. Despite these initial challenges, positive prospects emerged as the transition progressed and was completed (post-2050). The advantages became more evident, with reduced calorie requirements and evolving trade-offs shifting towards synergies, especially in the HUS and MED diets. Both diets gradually moved from the food affordability and water use trade-offs quadrant to the triple win quadrant.
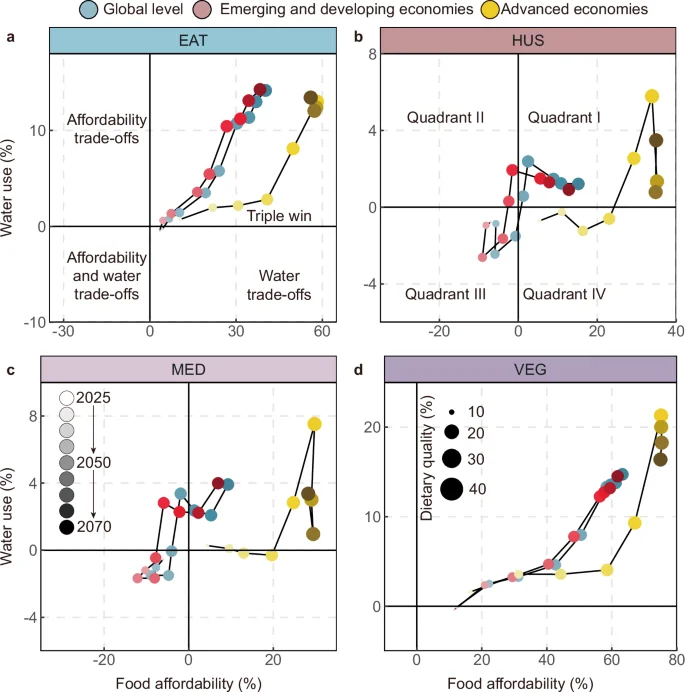
a synergies and trade-offs of the EAT-Lancet diet (EAT); (b) synergies and trade-offs of the Healthy US-Style (HUS); (c) synergies and trade-offs of the Mediterranean dietary (MED); (d) synergies and trade-offs of the vegetarian scenario (VEG). Note: If the point is in the first quadrant, it means that dietary transitions can provide a triple win for dietary quality, water use and food affordability; If in quadrant II, it means dietary transitions can have benefits for dietary quality and water use, but at the expense of food affordability trade-offs; If in quadrant III, it means dietary transitions can only have benefits for dietary quality, but at the expense of food affordability and water use trade-offs; If in quadrant IV, it means dietary transitions can have benefits for dietary quality and food affordability, but at the expense of water use trade-offs; the synergies and trade-offs data at the global level are calculated by calculating the percentage change of the four healthy diets relative to the BaU diet. For the specific calculation process, please refer to the data processing code in https://doi.org/10.6084/m9.figshare.23905866. Source data are provided as a Source Data file.
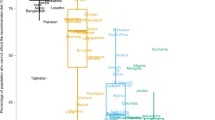
Synergies and trade-offs in dietary transitions varied significantly among countries, exemplified by the EAT diet (Fig. 5). By 2030, the adoption of the EAT diet improved dietary quality, reduced water use, and lowered food expenditure in 80 countries, primarily in advanced economies like Europe and North America (Fig. 5a, b).
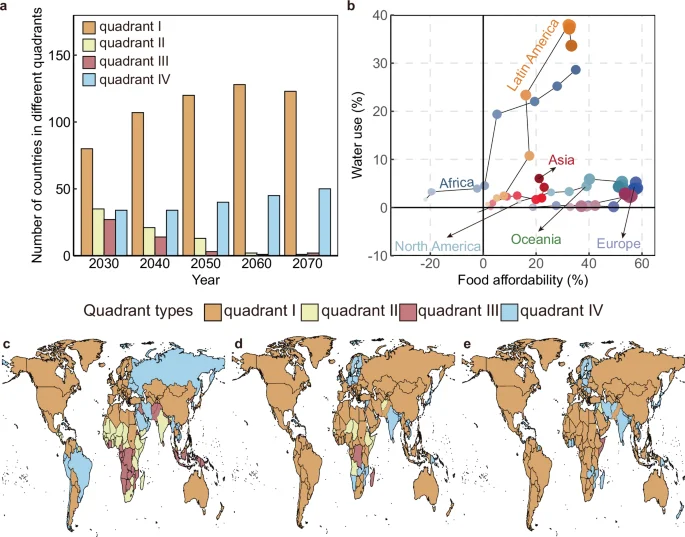
a Number of countries in different quadrants over time. b Synergies and trade-offs. c–e Distribution in different country quadrants and changes in 2030, 2050, and 2070; Note: the synergies and trade-offs data at the regional level are calculated by calculating the percentage change of the four healthy diets relative to the BaU diet. For the specific calculation process, please refer to the data processing code in https://doi.org/10.6084/m9.figshare.23905866. Source data are provided as a Source Data file.
Yet, during the initial transition stages, many countries in Africa and Asia faced water use, affordability, or dual trade-offs, despite dietary quality enhancements. Specifically, 35 countries faced food affordability trade-offs, mainly in Africa (− 31.72 ± 12.78%), Asia (− 14.25 ± 10.32%), and Latin America (− 4.48 ± 3.81%). Notably, Burundi (− 54.28%), Ethiopia (− 50.10%), and Chad (48.10%) experienced the most significant declines. In addition, 33 countries, predominantly in Asia (− 10.49 ± 17.21%), faced water use trade-offs.
However, as the dietary transition progressed, the trade-offs gradually lessened, decreasing from 96 in 2030 to 56 in 2050, and to 53 in 2070 (Fig. 5c–e). This was mainly because economic development and population growth, without dietary transition intervention, would drive total food demand over time, widening the gap with the diet scenarios (Supplementary Fig. 1). Encouragingly, a significant majority of countries in the EAT scenario are poised to transition to quadrant I before 2050. However, 40 countries were still projected to face food affordability trade-offs, and 13 countries, mainly in Africa and Asia, encountered water trade-offs after the completion of the dietary transition.
Sensitivity analysis
To assess the robustness of our conclusions across various socioeconomic development trajectories, we conducted a sensitivity analysis focusing on dietary transitions within the SSP1-3 pathways. These pathways represent diverse futures, with SSP135 illustrating a sustainable development trajectory and SSP336 depicting a scenario marked by regional rivalry. Sensitivity analyses were performed on crucial assumptions (Supplementary Tables 2, 3), encompassing GDP, population dynamics, climate change impacts, water demand, transition nodes, technological advancements, and irrigation efficiency. The objective was to ensure the reliability of our findings by exploring a spectrum of plausible assumptions concerning future socioeconomic development.
Across all pathways studied, the advantages of dietary transitions became increasingly evident over time. Emerging and developing economies consistently experienced greater water use and food affordability pressures during the transition compared to advanced economies. However, subtle differences in the results were observed along the different development pathways.
In both SSP1 and SSP3 scenarios, all dietary transitions led to a reduction in water use, aligning with conclusions drawn from the SSP2 scenario. In the SSP1 scenario, the reduction ranged from 4.01% to 14.36%, while in SSP3, it varied between 0.88% and 16.06% (Supplementary Table 4). Regarding food affordability, slight variations were noted. EAT and VEG diets generally decreased food affordability, but HUS and MED diets intensified affordability pressures in both SSP1 and SSP3 scenarios (Supplementary Table 5).
In the SSP1 scenario, marked by rapid economic development and a commitment to sustainability, the BaU diet shifted compared to the HUS and MED regions. It entailed reduced meat and sugar consumption and an increased intake of staple food. Consequently, the dietary transition towards a preference for meat and sugar in HUS and MED resulted in a greater burden on affordability, ranging from − 5.25% to − 10.79%.
A similar situation occurred in the SSP3 scenario. However, in this scenario, economic challenges in emerging and developing economies led to a BaU diet structure favoring staple food. Despite a relative increase in meat consumption compared to the SSP1 scenario, it remained significantly lower than HUS and MED diets in emerging and developing economies. This resulted in a substantial rise in meat expenditures, ultimately causing a decrease in affordability by − 15.60% and − 20.51%.
Furthermore, we provide the impact of changes in individual indicators on the results in the supplementary information, detailing absolute changes, relative changes, and elasticity relative to BaU for different dietary transition scenarios in 2070. It is worth noting that the model results exhibit relatively higher sensitivity to the assumptions on population and irrigation efficiency, while showing less sensitivity to those concerning GDP and climate change. Despite variations in the effects of altering individual indicators, we emphasize that the overall trends in the results remain consistent. For example, upon reviewing the results of the dietary transition node set for the year 2030, we observe that in the early stages of the dietary transition, due to the more rapid increase in food demand, the increases in water use and the deterioration in food affordability become more pronounced, with maximum deteriorations of 3.54% and 24.82%, respectively. These effects are anticipated to gradually ameliorate as the transition progresses, which aligns with the conclusions for the year 2050 (Supplementary Tables 6–16).
Discussion
In this study, a global dynamic agricultural economic model was utilized to evaluate the evolving changes in water use, dietary quality, and food affordability from 2020 to 2070. Compared to prior research assessing the impacts of alternative diets28,29, we tracked the impacts of dietary transition over time at the national level. Conducting a thorough analysis of the long-term effects before and after dietary transitions becomes crucial. This goes beyond highlighting the repercussions of current unsustainable dietary paths to illuminate the challenges and opportunities inherent in dietary transitions. We aim to encourage countries to actively engage in these dietary transformations, while also highlighting potential challenges and prompting proactive measures.
Overall, we indicated that during the transition phase of the dietary transitions (2020–2050), advanced economies will use less water due to reduced dietary requirements and animal-sourced food consumption18,20. However, it is important to recognize that in some countries, especially those actively addressing widespread malnutrition and hunger issues in emerging and developing economies (Supplementary Fig. 11), the challenges they face are distinctly different from other regions. The substantial nutrition gaps in these countries, coupled with variations in the dietary structures between original and healthy sustainable diets, present a more intricate set of environmental challenges in meeting elevated food demands34. This required research and innovation in food systems beyond current levels to ensure more environmentally sustainable agricultural systems. Possible measures include more scientific crop rotation to increase agricultural production37,38; improving water management through precision agriculture and water harvesting39,40,41,42 (Supplementary Fig. 12). Moreover, to address food scarcity in emerging and developing economies, it was necessary to further strengthen international cooperation, guided by relevant experts and institutions. This included adopting region-specific measures based on local agricultural conditions, such as improving seedling quality and enhancing production techniques43. Efforts aimed at helping emerging and developing economies mitigate the challenges of food insecurity caused by technological limitations44. For advanced economies and major food-producing nations (Supplementary Tables 17–21), the challenges were more related to trade-associated environmental issues. In addition to providing necessary technical support to emerging and developing economies to boost production, it is crucial to optimize logistics and distribution to reduce losses and waste in the supply chain45, thereby minimizing the associated environmental impacts.
While all countries will eventually benefit from dietary transitions in terms of health, the cost to achieve the same benefits varies. Advanced economies can achieve more significant improvements in dietary quality at a relatively lower economic cost (affordability), whereas emerging and developing economies experience the opposite. It should be noted that dietary transition will lead to greater affordability burdens for some African and Asian countries28. Higher food expenditures and slower economic development may hinder and reduce the benefits of the global dietary transition. Although we emphasize that this situation will ease as the dietary transition is completed, policies that support income growth or food price stabilization in these countries during the transition may help to alleviate affordability pressures. To ensure the feasibility of dietary transitions, reallocating government subsidies and leveraging new tax revenues can support transition programs. For instance, taxing sugary drinks reduces health risks and generates revenue that can be redistributed to low-income groups, enabling them to benefit fully. Providing compensation to the countries, as Feng et al.46 suggest, can protect vulnerable populations without disadvantaging others. Increasing subsidies for healthy diets and implementing pricing policies to stabilize food prices amid rising demand are critical for improving nutrition47. Such measures promote public health and economic development by fostering sustainable, affordable diets. However, these policies may reduce wages for low-skilled agricultural workers and lead to unemployment28. Therefore, creating more job opportunities within and beyond the food system is essential to stabilize incomes and mitigate adverse effects48.
Although we consider national dietary differences in the scenario design, there remain many complex challenges in implementing dietary transitions. Cultural and social factors may hinder the process of promoting healthier food in certain countries49. For instance, in 2015, the Chinese government implemented a policy to promote potatoes as a staple food50 to improve food security and reduce environmental impacts. However, the implementation of this policy has been slow due to the strong influence of the traditional rice and wheat culture in China. Furthermore, countries have diverse perspectives on what constitutes a healthy and sustainable diet. In emerging and developing economies, people generally believe consuming more meat is better, while downplaying the health benefits of seafood, vegetables, and fruits. This may lead to discrepancies between actual eating behavior and their desire for healthy and sustainable diets. Addressing these challenges will necessitate guidance and protection from institutions, laws, and policies, and may require a long transition period, which highlights the importance of examining and responding to potential challenges in the process of dietary transitions.
Methods
Land-use modeling with MAgPIE
The MAgPIE model is a computational tool designed to simulate the global environmental impacts of agricultural land use and management30. MAgPIE employs a global economic model to estimate the impact of different agricultural policies and technologies on a range of environmental indicators, including water use. A key strength of MAgPIE is its ability to perform a detailed analysis of the trade-offs between multiple environmental indicators. For example, the model can assess the impact of transitions in dietary patterns on water use, food prices, and land use. In this way, MAgPIE can offer insights into the complex interplay between various factors and facilitate evidence-based policymaking that balances the benefits of agricultural production with its environmental impacts—a property that is crucial to meeting our research objectives. This study used MAgPIE version 4.6.3 to identify the impact of dietary transitions on the environment, health, and affordability at the country level.
Agricultural supply is endogenously determined, considering production costs and spatially defined agricultural productivity levels51. Costs include input resources, transportation, converting non-arable land, irrigation, and yield-enhancing technology52. Geographically specific information on biophysical factors, including crop yields, is supplied by the Lund-Potsdam-Jena managed land model (LPJmL)53. The model integrates high-resolution (0.5-degree) meteorological, land use, vegetation ecology, water resources management, and carbon cycle data to reflect the impact of climate change on various crops. Its strong interaction with the MAgPIE model aids in assessing climate change and carbon dioxide effects on the land use sector, ensuring a nuanced evaluation of regional agricultural supply systems. Interregional reallocation of agricultural production depends on an exogenous self-sufficiency rate (Supplementary Fig. 13), with detailed model information in the Supplementary Information.
Transition node
A literature review of relevant studies published in top-tier journals reveals that research on dietary transition timelines primarily focuses on three key time points: immediate, 2030, and 205017,25,54. Among these, the comprehensive global framework established by the EAT-Lancet Commission proposes scientifically-grounded targets for achieving healthy diets and sustainable food production by 2050 for 10 billion people, emphasizing the feasibility and necessity of such a transition operating in safe planetary boundaries7. Considering the EAT-Lancet Commission’s framework and our research objectives, which include assessing the long-term impacts of dietary transitions, we set 2050 as the main scenario and supplement the results for 2030 as a sensitivity analysis (Supplementary Tables 6–11).
Food demand and intake under different dietary scenarios
The MAgPIE model we employed explicitly encompasses the global production of 22 major crops, as reported by the FAOSTAT. These crops collectively represent over 70% of the total harvested area and contribute to over 85% of the calorie supply from crops, according to FAOSTAT data55. In addition, the model includes five categories of livestock products and fish, ensuring a comprehensive representation of the food system.
In the MAgPIE model, the food demand (food intake + food waste) in the Business as Usual (BaU) diet is determined through cross-national regression analyses based on different future GDP and population growth scenarios56. The other four healthy dietary scenarios, including the Mediterranean diet (MED) defined by Bach-Faig et al. (2011)31, the EAT-Lancet reference diet (EAT)7, dietary patterns from the 2015–2020 Dietary Guidelines for Americans (HUS)32, and a vegetarian scenario (VEG), have their food intake directly determined based on previous research results7,31,32,57 (Supplementary Table 1). Notably, given the substantial variation in current dietary preferences across countries, and to respect national dietary cultures, the four additional dietary scenarios were redistributed based on existing preferences from the Food Balance Sheets (FBS) of 2011–202055. International trade in the model occurs after meeting regional minimum self-sufficiency requirements, implying that some part of the food demand in every world region is produced domestically.
Among them, the proportion of food waste in the BaU diet is primarily established through regression analysis grounded in per capita income. Additional comprehensive details regarding the model can be accessed in Bodirsky et al.58 For the other four healthy dietary scenarios, we make the assumption that the share of final household consumption which is wasted at the household level is 20% by 2050, which is about half of that in high-income countries (Supplementary Table 3).
In addition, we further decomposed the dietary components output by the MAgPIE model. Although the raw output of dietary components includes 26 food items, some dietary components are aggregated (e.g., fruits, vegetables, and nuts are classified as “other”). This level of aggregation was considered too coarse for assessing nutritional quality. Therefore, our approach involved utilizing the averages of the FBS for 2011–202055 to separate these aggregated food categories (Supplementary Table 22). For more details, please refer to the Supplementary Information.
To better analyze the impact of different diets on the environment, health, and affordability, the four dietary patterns were assessed at the 2500 kcal per day level. For detailed settings, please refer to Supplementary Table 1.
Impact of water use
The escalating impact of global agricultural production on water resources, coupled with the surging global population and transitioning dietary patterns, underscores the urgent need to capture water use patterns across different food categories. In this study, the water use in the model encompasses a broad range of sectors beyond agricultural irrigation, manufacturing, electricity, domestic demand, livestock, and ecosystems. Agricultural water use is endogenously calculated based on irrigated cropland, irrigation efficiency (Supplementary Fig. 3), and livestock production, while water use from all other sectors is treated exogenously10. By integrating these data, the MAgPIE model can estimate water use for different regions, crops, and irrigation methods at the 0.5-degree grid cell level under different dietary patterns53. For more details, please refer to Supplementary Information.
Impact on dietary quality
We chose the Alternate Healthy Eating Index (AHEI)59 to evaluate the relationship between diet and health. Since the creation of AHEI, there has been substantial evidence supporting the strong link between AHEI and health. Such dietary indices are often designed to assess the dietary patterns of individuals or groups to better understand their potential impact on health33,60. By applying specific nutritional standards and guidelines, these indices can provide information on dietary quality, revealing health-related patterns and trends. We scored nine components of the AHEI for each stratum. These components include fruit, non-starchy vegetables, grains, sugars, legumes/nuts, red meat, omega-3 fats, polyunsaturated fatty acids (PUFAs), and trans fats (sodium is not estimated in the MAgPIE model). Each component was scored from 0 to 10, and the final score ranged from 0 to 90 (Supplementary Table 23).
Impact on food affordability
As MAgPIE is an economic optimization model that operates under constrained conditions, it can derive a food shadow price for each country’s food demand constraint. In this study, we calculated food expenditures in different countries based on food prices and consumption. Food affordability was defined as the share of total food expenditure in total personal consumption expenditure, which was obtained from the model output.
Synergies and trade-offs
Finally, we analyzed the synergies and trade-offs of different dietary transitions by calculating the relative change of three indicators relative to the BaU scenario in the other four dietary scenarios of 176 countries (Supplementary Table 24) from 2020–2070 using Eqs. (1, 2).
where ({S}_{{i}^{+}}) and ({S}_{{i}^{-}}) respectively indicate the relative change of positive (dietary quality) indicator i+ and negative (water use and food affordability) indicator i−. x′ represents the value of each indicator for different scenarios, and xBaU represents the value of each indicator for the BaU scenario. If S > 0, it means that dietary transition can have a positive impact on indicators (synergies), and if (S , < , 0) means that there is a negative impact (trade-offs).
Limitations
Although we assessed changes in dietary quality resulting from dietary transitions based on the Alternative Healthy Eating Index (AHEI), this method does not directly reflect health impacts related to diet. If health risks, including air pollution from dietary changes, are taken into account, there is a risk of underestimating the health impacts of dietary changes. Additionally, our study concentrated on understanding the impact of dietary shifts on water use, diet quality, and affordability. It is important to note that while our research provides insights into these crucial aspects, we did not quantify GHG emissions, health issues related to agricultural pollution, or biodiversity loss. While these are significant environmental impacts, they have already been extensively studied17,44,61. Our decision to exclusively focus on water impact stems from the understanding that this particular aspect, especially in the context of dietary transitions, is not sufficiently comprehended. By emphasizing the water impact, our intention is to fill a void in existing research, contributing valuable findings to an area that has garnered less attention compared to other environmental impacts. While some studies have touched upon the impact of dietary transitions on water62, these static analyses do not fully illuminate the potential challenges that arise during the transition.
Secondly, while we have analyzed a range of different diets, our consideration of the full diversity of available food types is limited. We have covered major crops, livestock, and fish, but have not included non-essential items such as beverages and processed meat. This omission may underestimate changes in dietary patterns. Despite this, we maintain confidence in our model’s robustness, believing that the broader trends and conclusions regarding the affordability of essential dietary components persist, even with the exclusion of non-essential items. It should be noted that our diets were split into nuts, vegetables, and fruit is based on the average historical data from FAO. We assume that this split will not change with GDP in the future. However, we believe that this approach will not affect the conclusions. Future work could address the resolution of food types to improve the accuracy of the data.
Finally, it is important to emphasize that, despite conducting sensitivity analyses on the development path and key assumptions to ensure the robustness of the results, we acknowledge the importance of broader validation methods, such as inter-model comparisons63.
Reporting summary
Further information on research design is available in the Nature Portfolio Reporting Summary linked to this article.
Data availability
Data supporting the findings of this study are available within the article and its Supplementary Information files or are available on figshare (https://doi.org/10.6084/m9.figshare.23905866). Source data are provided in this paper.
Code availability
The model code of the MAgPIE model is openly available under the GNU Affero General Public License, version 3 (AGPLv3) and accessible via GitHub (https://github.com/magpiemodel/magpie). The release version (MAgPIE 4.6.3), on which this study is based, has been archived via Zenodo (https://doi.org/10.5281/zenodo.7782037). In addition, we provide code for model data post-processing and data analysis, which can be obtained on figshare (https://doi.org/10.6084/m9.figshare.23905866). Using the provided plotting code and source data, all figures presented in this study can be reproduced.
References
-
Ritchie, H., Reay, D. S. & Higgins, P. The impact of global dietary guidelines on climate change. Glob. Environ. Change 49, 46–55 (2018).
Google Scholar
-
Tilman, D., Balzer, C., Hill, J. & Befort, B. L. Global food demand and the sustainable intensification of agriculture. Proc. Natl. Acad. Sci. USA 108, 20260–20264 (2011).
Google Scholar
-
Wada, Y. et al. Global monthly water stress: 2. Water demand and severity of water stress. Water Resour. Res. 47, https://doi.org/10.1029/2010WR009792 (2011).
-
Masson-Delmotte, V. et al. Climate Change and Land: An IPCC Special Report on Climate Change, Desertification, Land Degradation, Sustainable Land Management, Food Security, and Greenhouse Gas Fluxes in Terrestrial Ecosystems. (2019).
-
Godfray, H. C. J. et al. Food security: the challenge of feeding 9 billion people. Science 327, 812–818 (2010).
Google Scholar
-
Lara-Castor, L. et al. Sugar-sweetened beverage intakes among adults between 1990 and 2018 in 185 countries. Nat. Commun. 14, 5957 (2023).
Google Scholar
-
Willett, W. et al. Food in the Anthropocene: the EAT–Lancet Commission on healthy diets from sustainable food systems. Lancet 393, 447–492 (2019).
Google Scholar
-
Crippa, M. et al. Food systems are responsible for a third of global anthropogenic GHG emissions. Nat. Food 2, 198–209 (2021).
Google Scholar
-
Mekonnen, M. M. & Hoekstra, A. Y. A global assessment of the water footprint of farm animal products. Ecosystems 15, 401–415 (2012).
Google Scholar
-
Müller Schmied, H. et al. The global water resources and use model WaterGAP v2.2d: model description and evaluation. Geosci. Model Dev. 14, 1037–1079 (2021).
Google Scholar
-
Qin, Y. et al. Flexibility and intensity of global water use. Nat. Sustain. 2, 515–523 (2019).
Google Scholar
-
Richardson, K. et al. Earth beyond six of nine planetary boundaries. Sci. Adv. 9, eadh2458 (2023).
Google Scholar
-
Afshin, A. et al. Health effects of dietary risks in 195 countries, 1990–2017: a systematic analysis for the Global Burden of Disease Study 2017. Lancet 393, 1958–1972 (2019).
Google Scholar
-
Murray, C. J. L. et al. Global burden of 87 risk factors in 204 countries and territories, 1990–2019: a systematic analysis for the Global Burden of Disease Study 2019. Lancet 396, 1223–1249 (2020).
Google Scholar
-
Tuninetti, M., Ridolfi, L. & Laio, F. Compliance with EAT–Lancet dietary guidelines would reduce global water footprint but increase it for 40% of the world population. Nat. Food 3, 143–151 (2022).
Google Scholar
-
Semba, R. D. et al. Adoption of the ‘planetary health diet’ has different impacts on countries’ greenhouse gas emissions. Nat. Food 1, 481–484 (2020).
Google Scholar
-
Guo, Y. et al. Environmental and human health trade-offs in potential Chinese dietary shifts. One Earth 5, 268–282 (2022).
Google Scholar
-
Vanham, D., Guenther, S., Ros-Baró, M. & Bach-Faig, A. Which diet has the lower water footprint in Mediterranean countries? Resour., Conserv. Recycling 171, 105631 (2021).
Google Scholar
-
Springmann, M., Godfray, H. C. J., Rayner, M. & Scarborough, P. Analysis and valuation of the health and climate change cobenefits of dietary change. Proc. Natl. Acad. Sci. USA 113, 4146–4151 (2016).
Google Scholar
-
Navarre, N., Schrama, M., de Vos, C. & Mogollón, J. M. Interventions for sourcing EAT-Lancet diets within national agricultural areas: A global analysis. One Earth 6, 31–40 (2023).
Google Scholar
-
Grummon, A. H., Lee, C. J. Y., Robinson, T. N., Rimm, E. B. & Rose, D. Simple dietary substitutions can reduce carbon footprints and improve dietary quality across diverse segments of the US population. Nat. Food 4, 966–977 (2023).
Google Scholar
-
Long, A. & Ascent, D. World Economic Outlook. (2020).
-
Geyik, Ö., Hadjikakou, M. & Bryan, B. A. Climate-friendly and nutrition-sensitive interventions can close the global dietary nutrient gap while reducing GHG emissions. Nat. Food 4, 61–73 (2023).
Google Scholar
-
Hirvonen, K., Bai, Y., Headey, D. & Masters, W. A. Affordability of the EAT–Lancet reference diet: a global analysis. Lancet Glob. Health 8, e59–e66 (2020).
Google Scholar
-
Sun, Z. et al. Dietary change in high-income nations alone can lead to substantial double climate dividend. Nat. Food 3, 29–37 (2022).
Google Scholar
-
Batis, C. et al. Adoption of healthy and sustainable diets in Mexico does not imply higher expenditure on food. Nat. Food 2, 792–801 (2021).
Google Scholar
-
Gupta, S., Vemireddy, V., Singh, D. K. & Pingali, P. Ground truthing the cost of achieving the EAT lancet recommended diets: Evidence from rural India. Glob. Food Security 28, 100498 (2021).
Google Scholar
-
Gatto, A., Kuiper, M. & van Meijl, H. Economic, social and environmental spillovers decrease the benefits of a global dietary shift. Nat. Food 4, 496–507 (2023).
Google Scholar
-
Springmann, M., Clark, M. A., Rayner, M., Scarborough, P. & Webb, P. The global and regional costs of healthy and sustainable dietary patterns: a modelling study. Lancet Planet. Health 5, e797–e807 (2021).
Google Scholar
-
Dietrich J. P. et al. MAgPIE – An Open Source land-use modeling. Zenodo https://doi.org/10.5281/zenodo.7551451 (2023).
-
Bach-Faig, A. et al. Mediterranean diet pyramid today. Science and cultural updates. Public Health Nutr. 14, 2274–2284 (2011).
Google Scholar
-
Dietary guidelines for Americans. US Department of Health and Human Services and US Department of Agriculture. (2015).
-
McCullough, M. L. et al. Diet quality and major chronic disease risk in men and women: moving toward improved dietary guidance123. Am. J. Clin. Nutr. 76, 1261–1271 (2002).
Google Scholar
-
Miller, V. et al. Global dietary quality in 185 countries from 1990 to 2018 show wide differences by nation, age, education, and urbanicity. Nat. Food 3, 694–702 (2022).
Google Scholar
-
van Vuuren, D. P. et al. Energy, land-use and greenhouse gas emissions trajectories under a green growth paradigm. Glob. Environ. Change 42, 237–250 (2017).
Google Scholar
-
Fujimori, S. et al. SSP3: AIM implementation of Shared Socioeconomic Pathways. Glob. Environ. Change 42, 268–283 (2017).
Google Scholar
-
Zhang, W. et al. Closing yield gaps in China by empowering smallholder farmers. Nature 537, 671–674 (2016).
Google Scholar
-
Garnett, T. et al. Sustainable intensification in agriculture: premises and policies. Science 341, 33–34 (2013).
Google Scholar
-
Rosegrant, M. W. Innovation in Food Systems: Challenges and Opportunities. (2023).
-
Zhao, X. et al. Revealing trade potential for reversing regional freshwater boundary exceedance. Environ. Sci. Technol. 57, 11520–11530 (2023).
Google Scholar
-
Pastor, A. V., Ludwig, F., Biemans, H., Hoff, H. & Kabat, P. Accounting for environmental flow requirements in global water assessments. Hydrol. Earth Syst. Sci. 18, 5041–5059 (2014).
Google Scholar
-
Gerten, D. et al. Feeding ten billion people is possible within four terrestrial planetary boundaries. Nat. Sustain. 3, 200–208 (2020).
Google Scholar
-
Zhang, B. et al. Identifying opportunities to close yield gaps in China by use of certificated cultivars to estimate potential productivity. Land Use Policy 117, 106080 (2022).
Google Scholar
-
Humpenöder, F. et al. Projected environmental benefits of replacing beef with microbial protein. Nature 605, 90–96 (2022).
Google Scholar
-
Gatto, A. & Chepeliev, M. Global food loss and waste estimates show increasing nutritional and environmental pressures. Nat. Food 5, 136–147 (2024).
Google Scholar
-
Feng, K., Hubacek, K., Liu, Y., Marchán, E. & Vogt-Schilb, A. Managing the distributional effects of energy taxes and subsidy removal in Latin America and the Caribbean. Appl. Energy 225, 424–436 (2018).
Google Scholar
-
Marijke, K., van Zeist, W.-J., van Meijl, H. Addressing Synergies and Trade-offs in the Food System. (2022).
-
Ruggeri Laderchi, C. et al. The Economics of the Food System Transformation. Food System Economics Commission (FSEC). Global Policy Report (2024).
-
Han, A., Chai, L. & Liu, P. How much environmental burden does the shifting to nutritional diet bring? Evidence of dietary transformation in rural China. Environ. Sci. Policy 145, 129–138 (2023).
Google Scholar
-
Liu, B. et al. Promoting potato as staple food can reduce the carbon–land–water impacts of crops in China. Nat. Food 2, 570–577 (2021).
Google Scholar
-
Stevanović, M. et al. Mitigation strategies for greenhouse gas emissions from agriculture and land-use change: Consequences for food prices. Environ. Sci. Technol. 51, 365–374 (2017).
Google Scholar
-
Dietrich, J. P., Schmitz, C., Lotze-Campen, H., Popp, A. & Müller, C. Forecasting technological change in agriculture—An endogenous implementation in a global land use model. Technol. Forecast. Soc. Change 81, 236–249 (2014).
Google Scholar
-
Schaphoff, S. et al. LPJmL4 – a dynamic global vegetation model with managed land – Part 1: Model description. Geosci. Model Dev. 11, 1343–1375 (2018).
Google Scholar
-
Sun, Z., Scherer, L., Zhang, Q. & Behrens, P. Adoption of plant-based diets across Europe can improve food resilience against the Russia–Ukraine conflict. Nat. Food 3, 905–910 (2022).
Google Scholar
-
FAOSTAT (Food and Agriculture Organization). https://doi.org/http://faostat.fao.org (2016).
-
Bodirsky, B. L. et al. Global Food Demand Scenarios for the 21st Century. PLOS ONE 10, e0139201 (2015).
Google Scholar
-
Blackstone, N. T. & Conrad, Z. Comparing the Recommended Eating Patterns of the EAT-Lancet Commission and Dietary Guidelines for Americans: Implications for Sustainable Nutrition. Curr. Dev. Nutr. 4, nzaa015 (2020).
Google Scholar
-
Bodirsky, B. L. et al. The ongoing nutrition transition thwarts long-term targets for food security, public health and environmental protection. Sci. Rep. 10, 19778 (2020).
Google Scholar
-
Wang, D. D. et al. Global Improvement in dietary quality could lead to substantial reduction in premature death. J. Nutr. 149, 1065–1074 (2019).
Google Scholar
-
Belin, R. J. et al. Diet quality and the risk of cardiovascular disease: the Women’s Health Initiative (WHI)123. Am. J. Clin. Nutr. 94, 49–57 (2011).
Google Scholar
-
von Jeetze, P. J. et al. Projected landscape-scale repercussions of global action for climate and biodiversity protection. Nat. Commun. 14, 2515 (2023).
Google Scholar
-
Water is life, water is food. Nature Food 4, 823–823 https://doi.org/10.1038/s43016-023-00875-x (2023).
-
Roelfsema, M. et al. Taking stock of national climate policies to evaluate implementation of the Paris Agreement. Nat. Commun. 11, 2096 (2020).
Google Scholar
Acknowledgements
This study is financially supported by the National Natural Science Foundation of China (42377321 to Z.W. and 42077060 to Z.W.) and the Fundamental Research Funds for the Central Universities of the Ministry of Education of China (2662021JC003) to Z.W.
Author information
Authors and Affiliations
Contributions
Z.W. and Y.H. conceived the study. Z.W. designed the study methodology. Z.D., J.W., and C.L. collected the data, did the data analysis, and visualization. Z.D. drafted the manuscript. X.W. devised the methodology. B.B., Z.W., Y.H., X.W., and P.H. reviewed and edited the manuscript. B.B. and Z.W. supervised all the work.
Corresponding author
Ethics declarations
Competing interests
The authors declare no competing interests.
Peer review
Peer review information
Nature Communications thanks the anonymous reviewer(s) for their contribution to the peer review of this work. A peer review file is available.
Additional information
Publisher’s note Springer Nature remains neutral with regard to jurisdictional claims in published maps and institutional affiliations.
Supplementary information
Supplementary Information
Reporting Summary
Transparent Peer Review file
Source data
Source data figure 1
Source data figure 2
Source data figure 3
Source data figure 4
Source data figure 5
Rights and permissions
Open Access This article is licensed under a Creative Commons Attribution-NonCommercial-NoDerivatives 4.0 International License, which permits any non-commercial use, sharing, distribution and reproduction in any medium or format, as long as you give appropriate credit to the original author(s) and the source, provide a link to the Creative Commons licence, and indicate if you modified the licensed material. You do not have permission under this licence to share adapted material derived from this article or parts of it. The images or other third party material in this article are included in the article’s Creative Commons licence, unless indicated otherwise in a credit line to the material. If material is not included in the article’s Creative Commons licence and your intended use is not permitted by statutory regulation or exceeds the permitted use, you will need to obtain permission directly from the copyright holder. To view a copy of this licence, visit http://creativecommons.org/licenses/by-nc-nd/4.0/.
Reprints and permissions
About this article
Cite this article
Deng, Z., Hu, Y., Wang, X. et al. Transitioning to healthy and sustainable diets has higher environmental and affordability trade-offs for emerging and developing economies.
Nat Commun 16, 3948 (2025). https://doi.org/10.1038/s41467-025-59275-3
-
Received: 10 September 2024
-
Accepted: 15 April 2025
-
Published: 27 April 2025
-
DOI: https://doi.org/10.1038/s41467-025-59275-3